SILVER SELLERS WILL DOMINATE THE MARKET|SHORT
SILVER SIGNAL
Trade Direction: short
Entry Level: 3,599.6
Target Level: 3,126.8
Stop Loss: 3,914.2
RISK PROFILE
Risk level: medium
Suggested risk: 1%
Timeframe: 1D
Disclosure: I am part of Trade Nation's Influencer program and receive a monthly fee for using their TradingView charts in my analysis.
✅LIKE AND COMMENT MY IDEAS✅
Bearish Patterns

GBP/AUD BEARISH BIAS RIGHT NOW| SHORT
Hello, Friends!
GBP/AUD pair is in the downtrend because previous week’s candle is red, while the price is obviously rising on the 2H timeframe. And after the retest of the resistance line above I believe we will see a move down towards the target below at 2.074 because the pair is overbought due to its proximity to the upper BB band and a bearish correction is likely.
Disclosure: I am part of Trade Nation's Influencer program and receive a monthly fee for using their TradingView charts in my analysis.
✅LIKE AND COMMENT MY IDEAS✅

USOIL BEST PLACE TO SELL FROM|SHORT
USOIL SIGNAL
Trade Direction: short
Entry Level: 73.94
Target Level: 72.14
Stop Loss: 75.12
RISK PROFILE
Risk level: medium
Suggested risk: 1%
Timeframe: 2h
Disclosure: I am part of Trade Nation's Influencer program and receive a monthly fee for using their TradingView charts in my analysis.
✅LIKE AND COMMENT MY IDEAS✅

NZD/USD BEST PLACE TO SELL FROM|SHORT
NZD/USD SIGNAL
Trade Direction: short
Entry Level: 0.607
Target Level: 0.603
Stop Loss: 0.610
RISK PROFILE
Risk level: medium
Suggested risk: 1%
Timeframe: 3h
Disclosure: I am part of Trade Nation's Influencer program and receive a monthly fee for using their TradingView charts in my analysis.
✅LIKE AND COMMENT MY IDEAS✅

EUR/NZD SENDS CLEAR BEARISH SIGNALS|SHORT
EUR/NZD SIGNAL
Trade Direction: short
Entry Level: 1.922
Target Level: 1.899
Stop Loss: 1.938
RISK PROFILE
Risk level: medium
Suggested risk: 1%
Timeframe: 12h
Disclosure: I am part of Trade Nation's Influencer program and receive a monthly fee for using their TradingView charts in my analysis.
✅LIKE AND COMMENT MY IDEAS✅

EUR/AUD BEARS ARE GAINING STRENGTH|SHORT
Hello, Friends!
EUR/AUD is making a bullish rebound on the 12H TF and is nearing the resistance line above while we are generally bearish biased on the pair due to our previous 1W candle analysis, thus making a trend-following short a good option for us with the target being the 1.762 level.
Disclosure: I am part of Trade Nation's Influencer program and receive a monthly fee for using their TradingView charts in my analysis.
✅LIKE AND COMMENT MY IDEAS✅

EUR/CAD SELLERS WILL DOMINATE THE MARKET|SHORT
Hello, Friends!
The BB upper band is nearby so EUR-CAD is in the overbought territory. Thus, despite the uptrend on the 1W timeframe I think that we will see a bearish reaction from the resistance line above and a move down towards the target at around 1.575.
Disclosure: I am part of Trade Nation's Influencer program and receive a monthly fee for using their TradingView charts in my analysis.
✅LIKE AND COMMENT MY IDEAS✅

GBPJPY Potential DownsidesHey Traders, in tomorrow's trading session we are monitoring GBPJPY for a selling opportunity around 195.600 zone, GBPJPY is trading in a downtrend and currently is in a correction phase in which in which it is approaching the trend at 195.600 support and resistance area.
Trade safe, Joe.

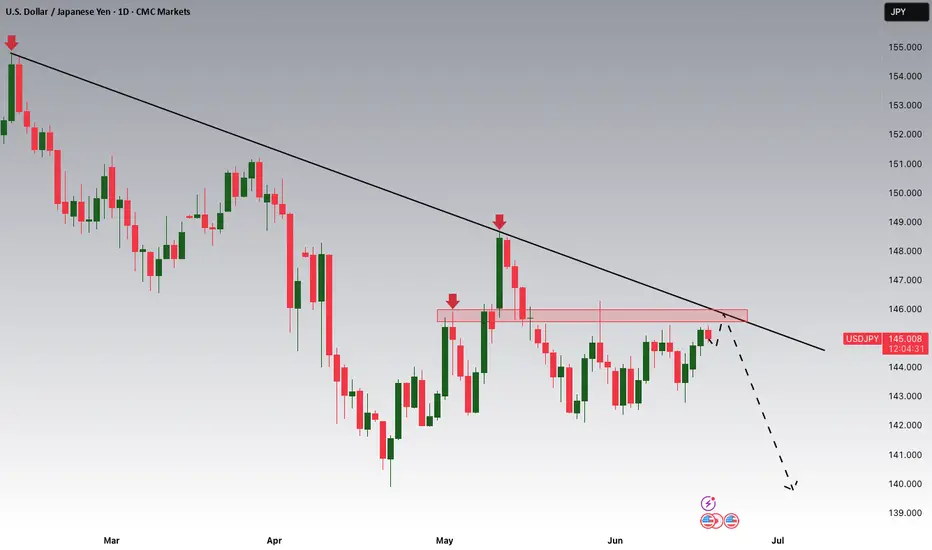
USDJPY Potential DownsidesHey Traders, in today's trading session we are monitoringUSDJPY for a selling opportunity around 145.700 zone, USDJPY is trading in a downtrend and currently is in a correction phase in which it is approaching the trend at 145.700 support and resistance area.
Trade safe, Joe.
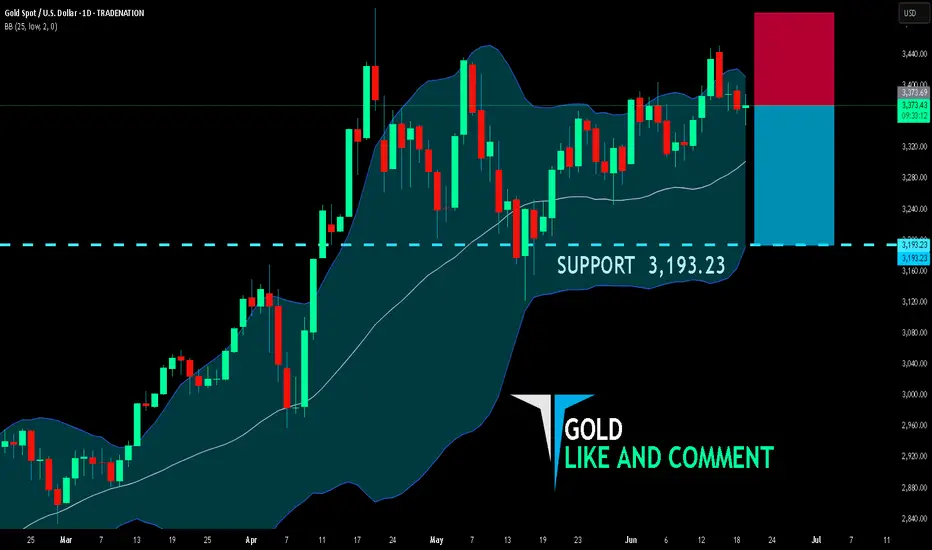
GOLD BEARISH BIAS RIGHT NOW| SHORT
GOLD SIGNAL
Trade Direction: short
Entry Level: 3,373.69
Target Level: 3,193.23
Stop Loss: 3,493.66
RISK PROFILE
Risk level: medium
Suggested risk: 1%
Timeframe: 1D
Disclosure: I am part of Trade Nation's Influencer program and receive a monthly fee for using their TradingView charts in my analysis.
✅LIKE AND COMMENT MY IDEAS✅
EUR/JPY BEST PLACE TO SELL FROM|SHORT
EUR/JPY SIGNAL
Trade Direction: short
Entry Level: 167.194
Target Level: 165.108
Stop Loss: 168.580
RISK PROFILE
Risk level: medium
Suggested risk: 1%
Timeframe: 17h
Disclosure: I am part of Trade Nation's Influencer program and receive a monthly fee for using their TradingView charts in my analysis.
✅LIKE AND COMMENT MY IDEAS✅

EUR/GBP BEARS ARE STRONG HERE|SHORT
Hello, Friends!
Bearish trend on EUR/GBP, defined by the red colour of the last week candle combined with the fact the pair is overbought based on the BB upper band proximity, makes me expect a bearish rebound from the resistance line above and a retest of the local target below at 0.846.
Disclosure: I am part of Trade Nation's Influencer program and receive a monthly fee for using their TradingView charts in my analysis.
✅LIKE AND COMMENT MY IDEAS✅

USD/CAD SHORT FROM RESISTANCE
Hello, Friends!
USD/CAD is trending down which is evident from the red colour of the previous weekly candle. However, the price has locally surged into the overbought territory. Which can be told from its proximity to the BB upper band. Which presents a beautiful trend following opportunity for a short trade from the resistance line above towards the demand level of 1.361.
Disclosure: I am part of Trade Nation's Influencer program and receive a monthly fee for using their TradingView charts in my analysis.
✅LIKE AND COMMENT MY IDEAS✅

NZDCHF - The Bears Are Back!Hello TradingView Family / Fellow Traders. This is Richard, also known as theSignalyst.
📈NZDCHF has been overall bearish trading within the falling channel marked in red, and it is currently retesting the upper bound of the channel.
Moreover, the green zone is a strong resistance.
🏹 Thus, the highlighted red circle is a strong area to look for sell setups as it is the intersection of the upper red trendline and resistance.
📚 As per my trading style:
As #NZDCHF approaches the red circle zone, I will be looking for bearish reversal setups (like a double top pattern, trendline break , and so on...)
📚 Always follow your trading plan regarding entry, risk management, and trade management.
Good luck!
All Strategies Are Good; If Managed Properly!
~Rich
Disclosure: I am part of Trade Nation's Influencer program and receive a monthly fee for using their TradingView charts in my analysis.

Great Depression 2.0 Starting in 2030?Looking at the Dow Jones, we can see clear cycles forming on this index. I believe we could see one more major run on the Dow between now and 2030, followed by a repeat of the Great Depression. I could easily be wrong, but the charts suggest this is a very real possibility.
So, between now and our potential top in 2030, we have an opportunity to make a significant amount of money in markets like crypto.
As always, stay profitable.
– Dalin Anderson

USOIL BEARS WILL DOMINATE THE MARKET|SHORT
USOIL SIGNAL
Trade Direction: short
Entry Level: 73.10
Target Level: 68.31
Stop Loss: 76.29
RISK PROFILE
Risk level: medium
Suggested risk: 1%
Timeframe: 3h
Disclosure: I am part of Trade Nation's Influencer program and receive a monthly fee for using their TradingView charts in my analysis.
✅LIKE AND COMMENT MY IDEAS✅

USD/JPY BEARS ARE GAINING STRENGTH|SHORT
Hello, Friends!
USD/JPY pair is in the uptrend because previous week’s candle is green, while the price is evidently rising on the 1D timeframe. And after the retest of the resistance line above I believe we will see a move down towards the target below at 141.669 because the pair overbought due to its proximity to the upper BB band and a bearish correction is likely.
Disclosure: I am part of Trade Nation's Influencer program and receive a monthly fee for using their TradingView charts in my analysis.
✅LIKE AND COMMENT MY IDEAS✅

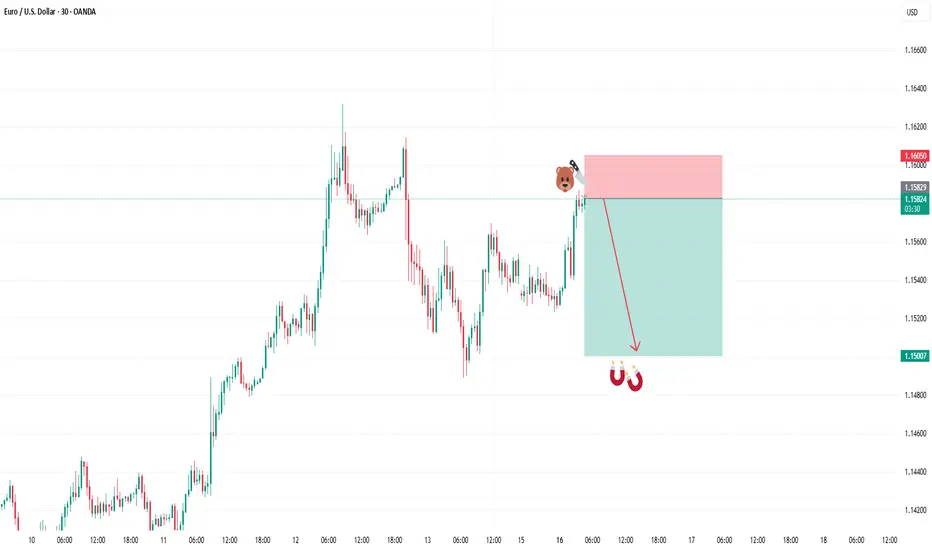
SELL EURUSDIn todays session we are monitoring EURUSD for selling opportunity. Our entry is at 1.15814 and stops are above 1.16050. Our target is 1.15000. Use proper risk management and stay safe fam.
SILVER BEARISH BIAS RIGHT NOW| SHORT
SILVER SIGNAL
Trade Direction: short
Entry Level: 3,714.4
Target Level: 3,384.5
Stop Loss: 3,933.3
RISK PROFILE
Risk level: medium
Suggested risk: 1%
Timeframe: 1D
Disclosure: I am part of Trade Nation's Influencer program and receive a monthly fee for using their TradingView charts in my analysis.
✅LIKE AND COMMENT MY IDEAS✅

EUR/USD SHORT FROM RESISTANCE
Hello, Friends!
We are now examining the EUR/USD pair and we can see that the pair is going up locally while also being in a uptrend on the 1W TF. But there is also a powerful signal from the BB upper band being nearby, indicating that the pair is overbought so we can go short from the resistance line above and a target at 1.143 level.
Disclosure: I am part of Trade Nation's Influencer program and receive a monthly fee for using their TradingView charts in my analysis.
✅LIKE AND COMMENT MY IDEAS✅

AUD/CHF SENDS CLEAR BEARISH SIGNALS|SHORT
AUD/CHF SIGNAL
Trade Direction: short
Entry Level: 0.528
Target Level: 0.525
Stop Loss: 0.530
RISK PROFILE
Risk level: medium
Suggested risk: 1%
Timeframe: 1h
Disclosure: I am part of Trade Nation's Influencer program and receive a monthly fee for using their TradingView charts in my analysis.
✅LIKE AND COMMENT MY IDEAS✅

NZD/CHF BEARS ARE GAINING STRENGTH|SHORT
Hello, Friends!
It makes sense for us to go short on NZD/CHF right now from the resistance line above with the target of 0.487 because of the confluence of the two strong factors which are the general downtrend on the previous 1W candle and the overbought situation on the lower TF determined by it’s proximity to the upper BB band.
Disclosure: I am part of Trade Nation's Influencer program and receive a monthly fee for using their TradingView charts in my analysis.
✅LIKE AND COMMENT MY IDEAS✅

AUD/NZD SELLERS WILL DOMINATE THE MARKET|SHORT
Hello, Friends!
Bearish trend on AUD/NZD, defined by the red colour of the last week candle combined with the fact the pair is overbought based on the BB upper band proximity, makes me expect a bearish rebound from the resistance line above and a retest of the local target below at 1.074.
Disclosure: I am part of Trade Nation's Influencer program and receive a monthly fee for using their TradingView charts in my analysis.
✅LIKE AND COMMENT MY IDEAS✅
