Bearish 5-0 Entry Below Ascending Broadening Wedge Demand LineJust Like BTC Did a Few Weeks Ago , The SPY has broken below an Ascending Broadening Wedge Demand Line and has formed a Bearish 5-0 at the tail-end of the breakout. The Reciprocal AB=CD PCZ of this Bearish 5-0 takes us to the 55% Fibonacci Retracement and that's where we closed today. If we get follow-through price action we should see the SPY Continue Downwards from here and perhaps fulfil the Measured Move of the Ascending Broadening Wedge and take us all the way back down to $344.43
Bearish 5-0

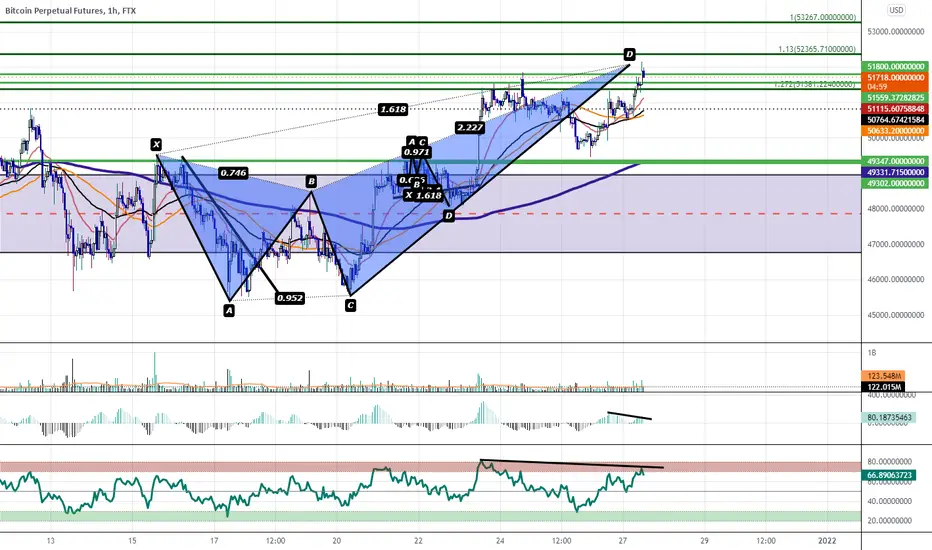
1hr Bearish Butterfly at Macro Levels of InterestWe have a 1hr Bearish Butterfly at the PCZ of a Potential Bearish 5-0 on the macro timeframe with Bearish Divergence. This maybe the last test of this level before making truly lower lows check the related Ideas tab for more details on the macro.
Bearish 5-0 Entry Below Ascending Broadening Wedge Demand LineFrom the looks of things we should see prices at least peak below the 40k level and at worst see this be the beginning of something much more bearish.

Bearish 5-0 Looking To Break Down Below The 4HR 55 SMAWe have a Rising Wedge and Bearish Divergence on the MACD after rejecting the PCZ of a Potential Bearish 5-0; I will be looking for a big correction from here.

Weekly Bearish Harami at PCZ of Bearish 5-0 on PalantirWe are at the PCZ of a bearish 5-0 and the weekly candle which is currently opened is as of right now a Bearish Harami but it hasn't closed yet but since i like to speculate and get the best price i will be entering a bearish position tomorrow in anticipation of the weekly closing bearishly and i suspect that it will make a lower low down to the 0.886 retracement.

Weekly Bearish Engulfing Bearish 5-0 May Take Us Down to 12KIt's not completely hopeless for the bulls yet but from the looks of things on the charts it seems way more likely that BTC will see 12.5K again rather than it seeing all time highs anytime soon. The Weekly Bearish Engulfing makes the perfect rejection signal at this Pattern Completion Zone.
I think we just spotted the trend reversal.

A Bearish 5-0 Could Take AMC Down Below $32 In The Coming Weeks.We have Bearish Divergence at the 50 percent retrace of a Potential Bearish 5-0 here and if this pattern plays out we will likely see AMC attempt to make a new lows below $32

It's time to go deep into the long positions here at the 0.886 Right now the EURO is at the lowest level I'd be willing to buy at i think it's time to put the majority of the position here as anything much lower than the 886 would go against my view on this setup.

Bullish Divergences Above the 200 day Moving AverageI think it may try to go back up to around 55 dollars in the short-term before continued downside in the long-term.

NZDJPY - Bullish SharkIf you are familiar with Harmonic Patterns, NZDJPY is a fun pair to trade. At this moment, either 5-0 Pattern or Bullish Shark check back is going to happen on the 4-hourly timeframe.

Bullish Bounce Off Shark for now; Bearish 5-0 Continuation LaterI will be playing XRP for a potential Bullish Bounce for now but i will be exiting around the 50 percent retracement due to the potential of developing a Bearish 5-0 later.

Extremely Oversold At Support: A Bullish Retracement is LikelyI think the EURO will rally back to make a 50 percent retracement before continuing to the downside.
The RSI is extremely oversold on multiple timeframes and it's at a strong support level, A temporary bounce wouldn't be unexpected.

Decent Argument For Bearish Divergence On The 4 Hour at a 61.8%At a 61.8% Fibonacci Retracement we have 4 Hour Bearish Divergence on the MACD, and Stochastic RSI and the Regular RSI is at Overbought territory. I expect to see at least some kind of of mild pull back from here Potentially making this a Bearish 5-0 where we continue to make lower lows.

4HR Bullish Divergence at the PCZ of a Bullish Shark MACD Bullish Divergence, Oversold Stochastic, Oversold RSI, and the MFI is rebounding from Oversold territory after hitting a 1.13 PCZ of a 4HR Bullish Shark I will be longing and targeting the 50 percent retrace from high to low and expect to see the AUD potentially continue it's downtrend after hitting the 50% retrace to confirm a potential Bearish 5-0.


$ZRXUSD forward guidanceThe Cajun thinks he has a bead on a him:) Lots of things can happen but when things line up, we must take notice and not doubt Ketu (astrotalk-aka your gut). We must build the narrative, then test it. I just wish I had full access to trade crypto:)


Bitcoin's Harmonic JourneyBearish 5 Drives megastructure leading into a Bullish 5 drives up to 8500 to which will fulfill the overall Bearish 5 Drives w a target at around 5.5k.
Upon completion of 5.5k retracement OR sideways trending on a strong demand zone, Bitcoin's harmonic may become a Bullish Deep Crab to which will have a target of $10k+.
I've been bullish about bitcoin and I'm open to us shattering 8500 and reaching for 10k+ but I'm just reading the chart as it's presented and it's pretty clear what is being presented.
The following is astrological and Gann fan related. I am in now way a master of this and while I've witnessed the significant correlations of astrological events w price action and fud and fomo doesn't mean I am an authority on recognizing it. These are data points that I am interested in observing so just understand that's where this part of the analysis comes from.
There are different star systems that astrologers use. In the beginning, I used tropical, which is used for Western astrology but I'm favoring and using Sidereal (of the stars) astrology based on observations I've thus far made between tropical and sidereal for bitcoin's price action.
Astrological and Gann fan aspects: It's interesting to note that this weekend, there are several planetary bodies (the moon is a planetary body) that are moving into constellations. In astrology, it's significant when a planet enters a constellation/sign and even greater significance when it multiple planets entering a sign/s.
6/8 - Friday - Moon enters Pisces
6/9 - Saturday - Venus enters Cancer - Gann fan cross
6/10 - Sunday - Moon enters Aries
6/10 - Sunday - Mercury enters Gemini
Last time we had this many planetary events in a 4 day time period was during Consensus 2018 last month.
Next there's June 18th... as in 6/18... (Golden ratio anyone?) and this day is at the apex of the pennant that we are forming from our run up to 20k. Fun fact: Kepler characterized Harmonics Law on May 25th, 1618. Nice timing with that year, Keppler! Also, May 25th is when the Buddha's birthday is celebrated.
6/18--- Neptune Retrograde - I've been trying to understand how different planets could affect price action and I'm afraid I don't have enough experience to talk about Neptune retrograde in that regard. What I can say is that Neptune retrograde is a wake-up call to the delusional fantasizers. The big question is who is delusional; the bears about the price dropping or the bull greedy for the moon?
Gann Fan - so in a previous chart I published, about how hype 4/20 is going to this year has a Gann fan apex/wedge/crossing at 4/20. If you press play, bitcoin literally drove right into the wedge, continuing upward. It's not at cleanly depicted in this chart bc scale has things slightly off, but subsequently parallel to the 4/20 apex is a Gann fan apex at 6/18. What does that mean? mmmm, I'm counting on the Bearish 5 Drives harmonic to play out.
6/26 - Mars goes retrograde - This isn't looked as favorable but we shall see how it goes.
7/7 - Mercury enters retrograde zone - This should be daytrading- short term bearish.
7/10 - Jupiter goes direct - bullish. Planet of wealth, abundance, expansiveness goes direct is a good sign. When mercury went direct (4/15) we took off. 5/3 - Mercury left the retrograde zone and that day is associated w one of our double top/highs from the April bull run. We also have a Gann fan cross on 7/10 reinforcing the significance of that day.
7/13 - partial solar eclipse - historically a bullish event. Significance reinforced by a Gann fan crossing.
7/26 - Mercury goes retrograde - Bearish
7/27 to 28 - Total Lunar Eclipse - Bearish
I use astrology to find confluence in the story that's being told w price action. I am very much a novice and appreciate you hanging around to read the end. :)

USD/CAD - Bearish 5-0Continuing with the majors before moving onto the crosses, I am monitoring a bearish 5-0 on the USD/CAD. Even without the harmonic ratios, price has made a clear head and shoulders, broken the neckline and is now re-testing the neckline as resistance. As per usual with a bearish 5-0 pattern, I will be on the looking for any reversal candles (hanging men/bearish engulfing) before price reaches the 0.618 retracement level of the previous wave.
Next week, Tuesday 1st of May, we will see the release of Canadian GDP data. This announcement can be very volatile so the trade must be managed effectively- I will give further updates as this move progresses.
5-0 Ratios
B = 1.13-1.618
C = 1.618-2.24
D = 0.5

CAD/CHF - Bearish 5-0Hello, Traders! I hope everyone is having a great weekend! I'm VERY excited to share and keep an eye on this set up with you guys.
Today, we are looking at a bearish 5-0 pattern on the 4H chart with the CAD/CHF.
Price seems to have started to reverse between 1.13-1.618 at B point. Lets look for price to break the current trend when the markets open back up to continue its way to C point.
The measurements for a valid 5-0 pattern are detailed below.
B: 1.13 - 1.618
C: 1.618 - 2.24
D: 0.50

XAU/USD - Harmonic ConfluenceHello, Traders!
Today, we have GREAT structure forming on GOLD!
Here, we have a bullish shark and a bearish 5-0 pattern. I personally, LOVE these set ups... GOLDEN RATIO X2!
Price has temporarily retraced at a support & resistance zone, which is also X point, but the down trend continues.
With these types of set up, we ALWAYS look for the DOUBLE PLAY:
1. BUY the Shark
2. CLOSE at the 50% retracement
3. SELL the 5-0
SUPER excited to share this one with you guys and to watch this structure develop with you all.
PLEASE set your stop loss appropriately, paired with proper account management.
The measurements for a valid shark are detailed below.
C: 1.13 - 1.618
D: 1.618 - 2.24
Final X to D: 0.886 - 1.13
Risk:Reward -
The measurements for a valid 5-0 pattern are detailed below.
B: 1.13 - 1.618
C: 1.618 - 2.24
D: 0.50

NZD/CHF - Bearish 5-0Hello, everyone! I hope everyone week is going well.
Today, we are looking at a bearish 5-0 on the 1D chart with the NZD/CHF.
Price is making its way down to C point measuring in at 1.618, which is also a very strong support and resistance zone for this pair.
With price reversing at C point, we can look to place a position at the 0.50 retracement coming in around 0.7024
Risk/Reward Ratio - 1:3
The measurements for a valid 5-0 pattern are detailed below.
B: 1.13 - 1.618
C: 1.618 - 2.24
D: 0.50

CAD/CHF - Bearish 5-0Hello, traders! I hope everyone had a great weekend. I am PUMPED for the week ahead!
Here, we have a bearish 5-0 pattern on the 4h chart with the CAD/CHF.
The Canadian Dollar is looking bullish on all charts this week.
With price beginning to reverse at the C point, which is a strong support/resistance zone, we can look for price to make its way up to D point.
The level in the market we are looking for a reversal in price is 0.7424
Risk/Reward Ratio - 1:3
The measurements for a valid 5-0 pattern are detailed below.
B: 1.13 - 1.618
C: 1.618 - 2.24
D: 0.50
