NZDUSD - Bearish BatLet's see how this trade's going. A potential Bearish Bat Pattern on NZDUSD. Depends what time it form as tomorrow there's a NFP.
Bearish Bat

ROSE/USDT Rose/usdt on 4h Timeframe making harmonic Bearish Bat
- TP 1 = 0.335
- TP 2 = 0.24
- SL = 0.45583
DYOR

Short Call on Tanla Petroleum Tanla petroleum has given a breakout today and has another resistance forming up at the base line given in the chart

Bearish Bat Visible on the 1 Hour at Overbought on RSIWill put my stop above X and Take profit at C I like that the RSI is a little bit Exhausted in Confluence with this harmonic level.

USDJPY-Weekly Market Analysis-Dec21,Wk3On the Daily Chart, USDJPY is on a potential Bearish Head and Shoulders which coincide with the Type2 Bearish Gartley Pattern and the 15minutes chart Bearish Bat that you see on this 1-hourly chart.
I'm waiting for the Bat Pattern confirmation on the intra-day timeframe and head in for the shorting opportunity.
This is the only trading idea I have that allows the stretching of targets that I've identified this week.

EURUSD-Weekly Market Analysis-Dec21,Wk3EURUSD is on a Bearish run. During this season, I will take almost every Harmonic Patterns setup, that is only if you drew it correctly.
We have Bearish Bat on the Daily Chart, Bearish Butterfly and another Bat Pattern in the 4-hourly chart too.
But what matters for the coming week is the Bearish Shark Pattern that complete at 1.1344 on the 1-hourly chart this will most probably completed before Wednesday, and it can be as early as Monday.

ETH Bearish BAT potential
The Bat Pattern is a 5-point retracement structure that was discovered by Scott Carney in 2001. It has specific Fibonacci measurements for each point within its structure and it is important to note that D is not a point, but rather a zone in which price is likely to reverse, called the Potential Reversal Zone (PRZ). The B point retracement of the primary XA leg must be less than a 0.618, preferably a 0.50 or 0.382 and the PRZ consists of 3 converging harmonic levels: 1) 0.886 retracement of the primary XA leg, 2) extended AB=CD pattern, usually 1.27 AB=CD and 3) minimum BC projection is 1.618.
The first target would be the 382 retracement of AD and the second target the 618 retracement of AD. A common stop level would be behind the X-point. Conservative traders may look for additional confirmation. Bat Patterns can be bearish and bullish. TradingView has a smart XABCD Pattern drawing tool that allows users to visually identify 5-point reversal structures on a chart.
www.tradingview.com

AUDCAD - Bearish BatA Bearish Bat Pattern is complete at 0.9191 on both 4-hourly and 1-hourly charts to provide a Trend Trading setup.
However, if the market slide towards 0.9050 instead, we have the Bullish Butterfly to catch the move on a Counter-Trend trading opportunity.
So which Harmonic Pattern setup would you prefer?


DXY Hidden Bearish Divergence close to ResistanceThere's a lot of uncertainty in the markets right now, hence the spike in the relative value of the dollar. A lot of investors in the world are flocking to the dollar. They believe a crash is coming and best believe it is but not before the biggest blow off top ever. The meltdown will be devastating but not until you see crude oil reverse. Crude oil bullish move is just getting started. Don't be shorting this market, you will most likely get burned.

AUDUSD - Bullish ChannelThere are two Harmonic Patterns, namely the Gartley Pattern and the Bat Pattern on the Daily Chart, but what I want to put my focus on is the Bullish Parallel Channel.
The three timeframes, the Daily, 4-Hourly and 1-Hourly chart respected the Bullish Parallel Channel which gives the counter-trend traders an opportunity for a buying opportunity. The potential target level will be at 0.7545 as a type2 Gartley Pattern is formed.

Bearish Bat At PCZ Near Market Close on TOMOCHAINThis will be a quick trade if it plays out but if it goes above the X point i will be exiting my hope for this trade is that we get a nice bearish reaction before the Sydney Session.

Potential 🦇 Forming USDCAD
We have a potential bat pattern forming on the Daily between the weekly HL,LL, we're currently on a weekly downtrend so any pullback on the daily is to fill the weekly gap.
Price is currently bullish and ranging on the Daily so I'm looking for price to break the daily highs but first to potentially drop (Filling some imbalaces left over from the previous push) but staying within the Daily Bullish Structure before then breaking the daily highs.
Let me know your thoughts!

WORK | Bearish Bat | Take Profit Position BreakoutWORK | Thailand SET Index | Media Sector | Chart Pattern | Price Action Analysis
> Take Profit position
> Rising Wedge Breakout
> Bearish Bat Harmonic Pattern
> Banker Fund Flow BBD dead cross 0
> RSI bearish divergent
> 1st Target Bearish Bat at Bat position C around EMA100
Always respect your stop-loss,
Goodluck

GBPJPY - Bearish BatIf you have engaged after this candle closed. It is a great call. And this is why you should have engaged in the trade.
1. It has reached the completion price of the Bullish Butterfly Pattern(cyan).
2. Bat Pattern consolidation at D, but fail to break and close above Point X of the Bat Pattern and that is a good sign. It attracts structure traders to hop in.
3. Long shadows appears, showing a strong rejection of the Bearish Bat Pattern.
4. RSI Divergence is a good sign of GBPJPY weakening.

NZDUSD - Bearish BatTrend Traders might want to take note of this bearish bat shorting opportunity that completes at 0.7068 for a trend-trading opportunity.
The bearish bat pattern is formed within the sell zone of the current timeframe and within the bearish channel of the bat pattern.

EURJPY - Bearish Deep Crab HOP LevelA Bearish Deep Crab pattern has touched the D-Point completion at 132.45. Counter Trend traders can consider engaging in the trade.
Conservative traders can wait for
1) Further consolidation and make sure it didn't break and close above 132.77 for a shorting opportunity.
2) Wait for consolidation to happen at 133.60 for a shorting opportunity as a second chance entry for a shorting opportunity. That level coincides with the daily chart bearish bat pattern.

NAS - Short Frame Double TopAfter a great move to the upside, supported by the 2 hour 8 EMA - Watching for Opex fireworks (or just a Friday Fizzle). The Bar Bat is still in play for next week, with further weekly room to the upside.
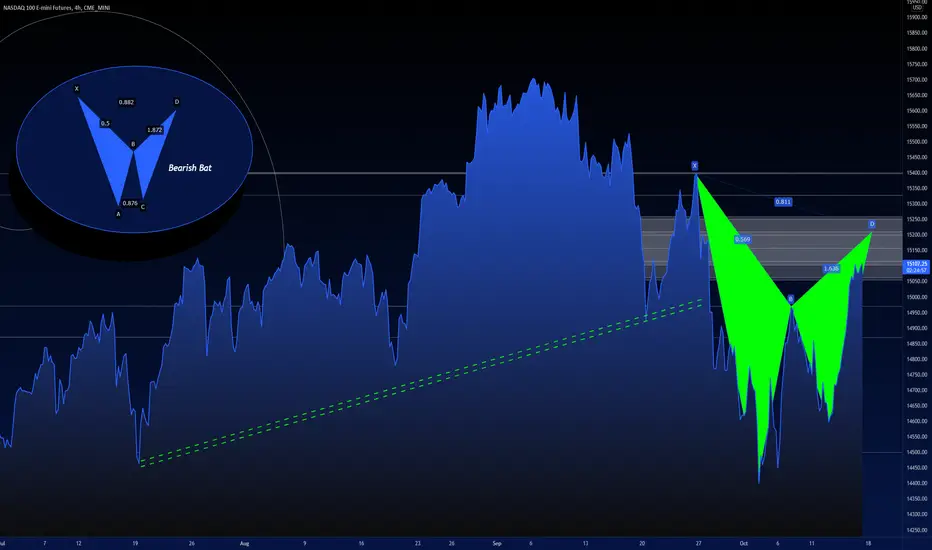
NAS - Bullish Day - Bearish BatKeeping this pattern on the back burner in case options expiry day is met with 'unexpected' sell pressure. My bias is looking up with the recent run and the 10 year retracing to the downside.

AUDUSD - Bearish BatBearish Bat Pattern on AUDUSD will set this pair into a counter-trend trade.
Having the candle bash through and close above point D, I will need to see a pin-bar or known as a long shadow before engaging the trade.

Potential Bat Forming GBPUSD - Potential bat pattern forming, I caught a nice-short today from the break of the EQL highs, now this level is broken ill be aiming for the next OB to scalp and then looking for price to hit the D point and see how it reacts!
Whats your thoughts?

BTC possible bearish Bat patternBTC has been drawing lower highs and lower lows for the past few days suggesting the presence of a bear market. Furthermore, the coin appears to be drawing a large bearish bat pattern. The RSI is also largely overbought.
In my opinion, the coin has just pumped to take out stop-loss from short traders.
I expect a continuation from the downward weekly momentum and suggest we could be close to a local high.
Short between 47k- 48k
Stoploss: 49.2k
Take Profit: 44k, 41k and 38k

FCEL pt 5.75Looks like FCEL is trying to fill the gap. LOOKS very weak. Hopefully soon il be bullish on it.
But for now I am still bearish.
PT should be near $5.75.LOOKS LIKE IT IS TRYING TO FILL THE GAP AND AGAIN DON'T WAIT FOR 5.75. BUT DON'T RISK AFTER 5.75.JUST GET OUT OF IT
