Trade Ideas Position: NZDUSD BatType 2 Bat Pattern is not the usual setup I'll trade especially the initial Bat Pattern Setup has hit Target1. In this case, there is a Consolidation pattern, a symmetrical triangle or better known as pennant having the 1st break to the downside.
That signal a higher probability of downward movement. More important it gives a great reward:risk.
Bearish Bat


Trade Ideas Educator: AUDUSD BatA bearish bat setup that requires further confirmation, ie a break of support retraces to form a lower-high to engage the trade for a shorting opportunity. Target may extend further as I believe AUDUSD may have a depreciation that will catch many traders unexpected.

BTCUSD: Further decline imminent, Accumulation phase.Please leave feedback and opinions if you disagree I'm open to criticism.
like or follow if you agree. And I'll return the favor.
The above chart is based on the line break technical analysis.
I have drawn out the forcasting Bollinger band path of movement.
1 day chart we have bounced off the 20 day moving average, we are now below both the 20 and 50 day moving average, if Bitcoin attempts a recovery we won't see $10,000 again. 10k is gone. The 20 day moving average has become strong resistance and we are heading down further for accumulation prior to halving in May.

USDJPY potential bearish bat patternUSDJPY potential bearish bat pattern
around 108.300 will be a good area to short
SL : 108.520
TP : Follow arrow

Weekly Bearish Bat to retest $300 on LitecoinSo i have already posted a chart of my Bullish outlook on the BTc pair for LTC so far so good. Now i think it's about time i do the USD comparative.
As you can see in the chart we are in a major area right now and we seem to be trying to get above and out of it and at the same time we seem to be forming a harmonic pattern.
it's a bearish one but one can go long on the swings especially considering how much of a move up this last wave potentially has for us.
The PCZ of the pattern happens to line up with the ATH So if we can break out of this critical area i see no reason why LTC wont continue it's ascent back to the 300s.

GBPCHF ShortIve already made plenty of money shorting from the D point. GBPCHF still has yet to hit my 618 take profit. This short aligns not only with my technical analysis, but is right below my 200 ema and thus is ready to head down. My analysis on bxy is bearish as well, and with this economic uncertainty in the air and pound weakness, this will be the move to take massive profits.

Trade Ideas Educator: GBPJPY BatHaving Point C touches Point A, this isn't my favourite bat pattern, hence, I didn't place a pending order nor engage the trade right after.
Having an uptrend channel with an RSI Divergence does give me some temptation in engaging the trade but not as enough as the channel was broken.
I will then wait for a retracement for a shorting opportunity.

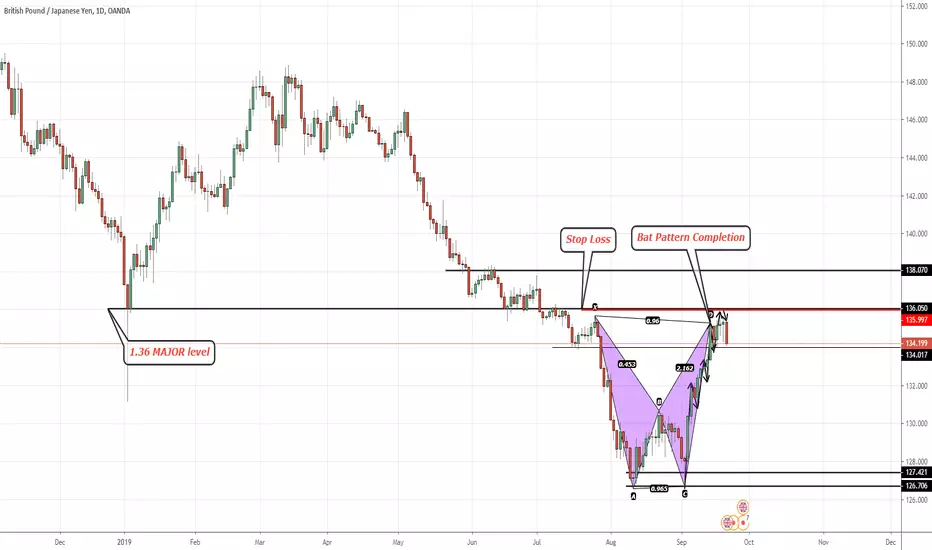
GBPJPY - #Forex #ForexTrader #ForexTrading #ForexChartBat pattern completion
At major resistance @1.36
if you didn't take the bat pattern then look for an entry on the lower TF's
Any questions? happy to help
#PipGainFX

4 Hour Bearish BatBearish Bat formation on 4 hour Chart and very little expected news on the economic calendar next week just the (CBI) Industrial Trends. 3:1 play trading withthe current trend

ETHUSD Possible Short OpportunityBearish Bat Pattern on the H4
As Harmonics Pattern mostly seemed like counter-trend trading with Completion Point D (the place you enter your trade order), a price stretched from Point C, where after passing Point B some traders may have the impression that a change in trend is underway. How I like to determine trend is based on a higher time frame than the one I am trading on.
In this example, I am placing my order on the H4 and this time frame gives me a nice looking Bat Pattern (visually the pattern does look skewed), therefore I consider trend using the the H12 or daily, sometimes I go even higher just to see the "Big Picture" that most people will miss because they are so fixated at the time frame they are trading at. It is important to go to various time frame so you know exactly where the trend is that will help you with managing your trade after entry. It is common to see traders getting solid entries but not sure what to do after that, not knowing how to exit the trade for profits or for loss.
I also look for trade that satisfy at least 3 of my strategies/methods to enhance the odds of the trade working out. Be very picky with your trades and dont fall victim into FOMO. Remember, skills and knowledge only accounts for 40%, the other 60% depends on your psychology and emotions.
Trade Setup:
Entry - Within the Sell Area (at Point D if you are more conservative)
SL - 206.5
TP1 - before 192
TP2 - before 184
TP3 - before 172
Do like and share this post. I use a combination of trading strategies such as Supply & Demand ( SND ), Harmonics Patterns, Multiple Time Frame Analysis , Candlestick Analysis to name a few. Follow me if my trading style suits you as I will be posting new trade ideas and analysis regularly.

Trade Ideas Educator: GBPJPY BatA bearish bat setup for a trend trading trade, not quite sure at this moment if you would love to short it right away when market open or wait for further confirmation(that's more for me) as I have spotted all GBP related pair has a relatively strong bullish candle before market closes on Saturday(Singapore Time).
More read up on Brexit related topic on Bloomberg and make your decision o just simply wait for further confirmation or simply stay out of the trade.
Do note that pt C touches pt A too, typically not my favourite set and forget trade.

GBPJPY, BEARISH BAT #RRR 1:7 (Autolines Test1 Harmonic Pattern)HI BIG PLAYERS,
today I am very glade to present you about my new wave indicator.
Attached to the programming code of my Wolfe Waves indicator, yet I have also created harmonic patterns indicator with auto lines functions. Unfortunately I achieve the limits of TradingView's Pinescript - this is why I code for every harmonic pattern an own indicator.
Here I post an example of the Bat pattern. It shows a bearish pattern and allow you to take part on a trade with two possible take profits.
The take profits are aimed on the fibonacci extensions 1.382 and 1.618
Attention: I starting already my own business.
Actually, I have no premium account (coming soon). For that reason TradingView don't allow to present a link out off this platform. For every interesting user, you can also write me directly. I give you my site, where I talk about me and show my indicator shop. But please be noted, that in the moment I cannot sell any indicator. For my start-up I need already some documents from the financial authority - I come from Germany... here this is normal to wait. :)
All pattern indicators will coming soon in this shop. Please be patient and follow me as well you can.
King regards
NXT2017

GBPNZD #Forex #ForexTrader #ForexTrading #ForexChartBat complete and Cypher nearly at the buying zone .. possible long coming

Trade Ideas Position: USDCAD BatHaving the current candle movement, the market does suggest a potential breakout and close above the resistance.
My EA pattern recognition software I've been testing for 1-year plus picked this up as you can see it spotted a bigger picture that can't even fit the entire bat in the chart.
Definitely a countertrend setup on this.
If you had read the previous analysis the head and shoulders formation has formed up, hits its target area and move rebound from the target.

EUR NZD - Hourly ChartEUR NZD - The pair is within a Bearish BAT Pattern on Hourly Charts. Waiting for price to reach the PRZ which is marked. Will see the price action when price reaches PRZ and then can take a call on going Short

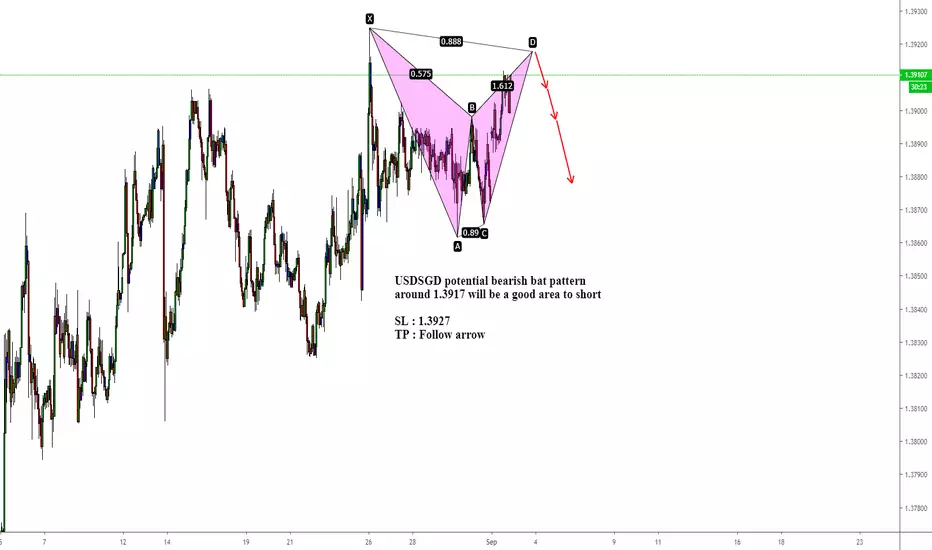
USDSGD potential bearish bat pattern USDSGD potential bearish bat pattern
around 1.3917 will be a good area to short
SL : 1.3927
TP : Follow arrow

Trade Ideas Educator: USDCAD BatA bearish bat pattern waited for weeks. Right now, there is an ascending triangle setup. Having a long shadow candle after a bullish candle is troubling, though all is good as no trade has been engaged in this setup.
If the market is well-supported on the bullish trendline, it will be a good consideration for me to engage the trade.
What's your trade plan? Comment down below.

Trade Ideas Educator : GBPAUD BatA bearish bat pattern traded on the type2 setup within the profit trend line. The 1st extended target of the bearish bat has already hit the target with 80pips of profit.
When to extend and when not you may think? I could help, all you need is to ask and I'll head you to the direction you are looking for. Profit of course.
With the final profit hit for the bearish bat, it will bring forward the opportunity of the bullish bat setup for a trend trading opportunity.
Refer to my previous post to see how the trade had formed.

Trade Ideas Educator: AUDCAD SharkA bearish shark on the 1-hourly chart will be the 1st level of resistance for a shorting opportunity.
On the 4-hourly chart a bearish bat setup for another trend trading opportunity. Let's see how the market reverse and head towards the trading opportunity.
If all do well, the bearish shark should hit by Wednesday this week.

GBPUSD-Weekly Market Analysis-Sep19,Wk1I do see a likelihood of GBPUSD head lower towards the butterfly pattern before heading up to the bat pattern. That, of course, is the best-case scenario for the trade.
Whichever form up should give a great trading opportunity. Bullish Butterfly acts as a countertrend trade and Bearish Bat as a trend trading opportunity.
You can see how the trade develop from last week weekly market analysis.
