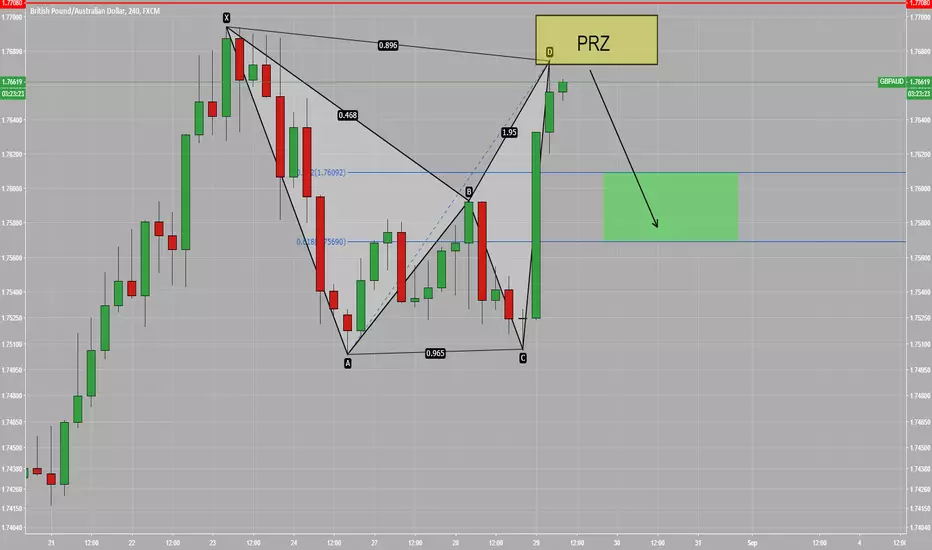
Trade Ideas Position: GBPAUD D1 Bearish BatBearish Bat Pattern formed up.
If the candle close as pin-bar as shown, when market open a new candle(D1 chart), I will short the market immediately.
Alternatively, traders can head to your lower timeframe and wait for trading setup.
Bearish Bat

BEarish BatLet's see if today this pattern be completed to enter in the market !! This Bearish Bat in a Downtrend makes this trade a nice one. RSI Overbought / Downtrend/Bearish Bat

EURNZD BEARISH BAT TRADE IDEAA bearish Bat completed but price spiked a bit above the reversal zone. I have a pending sell order at 1.7425 with stop loss at 1.7455 (30 Pips) and targeting 1.7335 (60 Pips). I will delete this order if price rallies above 1.7465 before the short trigger.


Trade Ideas Position: EURJPY H4 Bear BatWas staring this for days, initially was waiting for double top with RSI divergence, guess I'm good even with Falling Wedge with RSI Div.
You have to know your plan and of which is the mode of engagement.
Follow your plan

CHF/JPY Technical analysisThe CHF/JPY pair has made a bearish cypher and bearish bat pattern.
Both the patterns are strong reversal patterns and the pair is currently in overbought zone.
Hence we expect a make a pullback from the highs.

Trade Ideas Position: USDJPY Bear Butterfly over Bear Bat H1Shorted this trade, using SL base on Butterfly as the stop is still above the X leg of Bear Bat.
Taking conventional target based on Butterfly but Target2 I'm watching closely for the completion of Bull Shark.
This is what I call Pattern over Pattern

EUR/AUD Technical analysisThe EUR/AUD pair witnessed a steep bullish price action from the lows.
The RSI indicator is currently in an overbought zone.
The MACD histogram is also over-stretched.
Adding to that, the pair has bearish bat formation.
Hence we assume that the pair has made an over run and there is a good chance of throwback upto the support levels of 1.57270.

(Episode #168) EURJPY - Trade Ideas Educator (22AUG2018)Bear Bat setup and Pt D completes at previous support, turns resistance. I would need to see additional supporting reason like double top or falling wedge or at lease a pin bar at Pt D completion.
Reason being Pt C completion is a double top completion.

6) GBPJPY bearish bat on 1hr chartFollow me and check the related ideas below to learn more details.

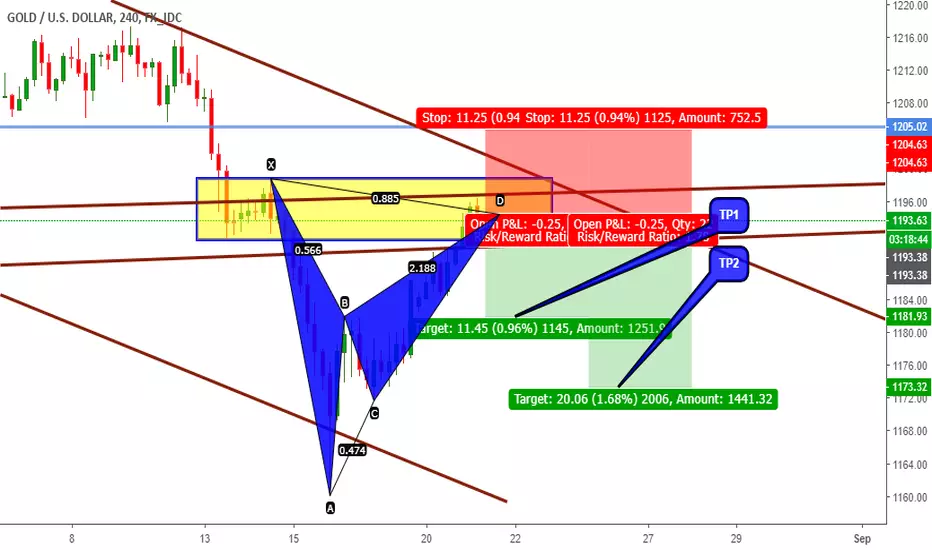
Gold 4H TF bearish bat pattern I think this zone on the chart has a potential for continue long-term downtrend.
also, the zone can occur nice bearish bat pattern.
CHF/JPY Technical analysisThe 30-min chart of CHF/JPY has formed a bearish bat pattern.
The pair is currently in a steep upwards move and is likely to face resistance at 111.67 zone.
We expect the bearish momentum to return to the market at that price zone.


Trade Ideas Position: EURJPY H1 EclipseWhen pattern overlap pattern overlap pattern and they are all valid, I call it the Eclipsed.
Yeah!
We have 5-0, the infamous Double Top with Div and Bear Bat all still valid. What will you do?


Trade Ideas Position: EURUSD H1 Bear BatLooking to short Alt Bat, and the setup is below the reisistance.

USDJPY SHORT - SYMMETRICAL TRIANGLE AND BEARISH BAT PATTERNHello guys,
As you see in my chart above there is a symmetrical triangle and bearish bat pattern on USD/JPY. I'm not used to harmonic patterns and not so sure about the bearish bat; but, its obivious that there is a symmetrical triangle happening. I would like to hear your opinions.
SL - is at breakout on top of the pattern
TP - 102


Bearish BatSell US Index as we notice a bearish bat pattern targeting the lower limit of the ascending channel.

Out of bullish energy- EURAUDAfter a bullish correction, pair has been on a weekly consolidation to see if the price could go further. After that, price broke down and now MA200 and MA50 has been broken. We can expect a bearish scenario for the pair on the upcoming weeks.

Dollar Index - Bearish Bat at weekly resistanceBearish bat has formed and has quickly rejected the PRZ which is a good sign the pattern is valid.
MACD histogram divergence and huge weekly resistance is still in play. It could possibly be broken given its been tested so much
This is the first time using harmonics on the dollar index so I am not taking a large position. Most likely this is a necessary retracement of the dollar before we can make one final leg to finish 2018 as we begin to see signs we are at the end of the current business cycle
