Ethereum - Harmonic OutlookTraders, I advise you to read this entire post to gain a better understanding of what I'm looking at.
It's been a while since my last trading position on ETH, back in August price completed a valid bearish bat pattern (shown on the chart) which was followed by a decline of almost 50% in two weeks.
Taking the time to reflect on Ethereum's situation from a technical standpoint the future direction is now becoming far clearer.
It has been struggling to break the $300 range for sometime now but a move above $400 is on the horizon.
Today I'm going to break down every aspect of the chart and explain in detail what I feel is happening from a technical perspective.
We're on the 4h chart with ETH/USD.
1. Bearish bat
The measurements for a valid bat pattern are detailed below.
B: 0.382 - 0.50
C: 0.382 - 0.886
D: 1.618 - 2.618
Final X to D: 0.886
A closer look on the 4h chart at my previous pattern, take profit levels 1 & 2 were achieved in a relatively short time period.
2. Daily price structure
Right now price is trading within a small zone, between a minor resistance and newly formed support trenldine, which aligns with levels A & C of the bearish butterfly.
3. Bearish Butterfly
The measurements for a valid butterfly pattern are detailed below.
B: 0.786
C: 0.382 - 0.886
D: 1.618 - 2.24
X to D: 1.272
It's not uncommon for harmonic patterns to occur one after another, especially with the previous pattern securing a nice return.
Currently price is completing the C to D leg of this structure and I estimate the pattern will complete on the 30th of November based on my measurement rules shown below.
The amount of time it takes price to form X to B is the projection for B to D.
Now remember, this is not certain... There will be many times when patterns take 2x longer to complete and still result in a profit.
I am only using my common principles to accurately determine the completion of the pattern.
4. Current price action
I would focus on the basics as of right now, I'm looking for a break of minor resistance and the support trendline to hold in order for the bearish butterfly to complete.
In the near future I will update this idea with my thoughts on Ethereum.
If we experienced a situation where the following happened.
It would still be a valid setup, as long as the C point does not exceed 0.886 and the lower trendline support is in tact.
If the bearish butterfly pattern completes I will let everyone know if it is a good area to short or close long positions, what we may find it the future is price pushes to around $520 at a 1.618 extension.
I hope this post has been helpful, feel free to leave a comment below.
Bearish Butterfly

GOING LONG ON BEARISH BUTTERLY -GOLDUSDYes, I know this is awkward but thats just how I do my thing :), it kind of works for me 65% of the time!

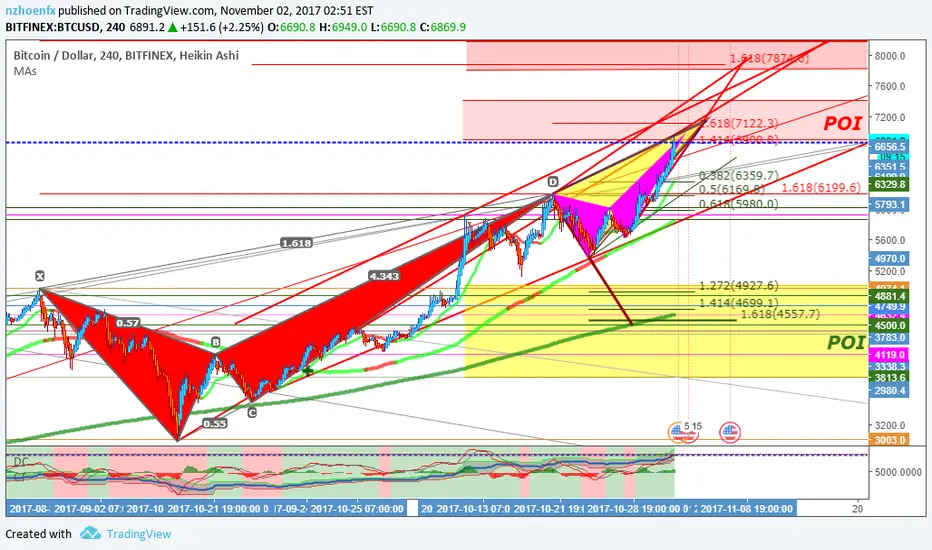
BTCUSD 11/02BTCUSD Monthly Update - November
POI 2 Zone Current
POI 3 Zone added
Previous analysis
The Hunt for Red October II - Valid
========================================================================================================
Caution, I only trade on a moderate trend basis on H4 D1 and sometimes W1 .. I am not chasing any small movement and I also dont easily change my point of view by giving a lot of charts just for recognition that show some weakness on my analysis. Only work smart and rest hard.
I am also not responsible if there is a loss due to follow my analysis. but you need to know my success rate in trading is very high.
Enjoy the Pips.. Dont forget to like and subscribe.

audjpy bearish butterflyThis pattern is on the 30 minute timeframe so it will move fast. My points were very slightly forced so I will not take a trade on this unless there is better confirmation on a higher timeframe. Lets see what happens......

EURAUD - Daily, Potential Bearish Butterfly PatternEURAUD - Daily, Potential Bearish Butterfly Pattern

LTCUSD Bearish ButterflyHere is a decent trade set up with litecoin. My methods for charting in Forex carry over to Crypto. If you want to learn dm me now!

AUDJPY Small trade on 1hrI gave a buy signal earlier on audjpy that correlates exactly with this short. All the details you need are in the picture

AUDCAD BEARISH BUTTERFLYAnother chart ahead of its time but lets watch it anyway!!! I like it paired with the current trend. Not a lot to add to this but lets wait and see what happens

EURCHF BEARISH BUTTERFLY As you can see I found this a little late but if it pulls back close to entry I will likely jump in.

Potential Bearish butterfly SYSBTCThis is way early on this pattern but I will be watching how it plays out. I will update if the pattern remains and we near the d leg

EURCHF - Potential Butterfly PatternThe bearish butterfly pattern may be completing in a few days.
Good R:R at 2.8 (TP1) and 4.6 (TP2).
RSI is reaching overbought level soon.
I will update if pattern completes.

EURAUD - Potential Butterfly Pattern on H1 ChartGBPAUD seems to be ranging, looking to short at the top of the range where a butterfly pattern will complete.
R:R at 2.2 (TP1) and 3.7 (TP2).
I will update if pattern completes.

NZDUSD Bearish ButterflyHallo traders.
Here we have the NZDUSD on the 4h chart.
A potential bearish butterfly pattern is shaping.
If the D-leg hit previous resistance level 0.73378 in the PRZ, I will be looking for candles that signals a reversal.
Risk/reward more than 1:3

NZDUSD - Potential Butterfly Pattern on H4 ChartA bearish butterfly pattern seems to be completing soon.
RSI not at overbought level yet.
Good R:R at 2.2 (TP1) and 3.8 (TP2).
I will update if pattern completes.

EURJPY Bearish ButterflyHere we have FX:EURJPY with a potential bearish butterfly on the daily chart.
Valid butterfly pattern:
X-A: 0.786
A-B: 0.386 - 0.886
B-C: 1.618 - 2.24
X-C: 1.272
Risk to reward 1:3
I will be looking for further confirmation before taking the trade.

Bearish Butterfly / Trend Channel / EURGBP / 60 MINSHi,
Bearish Butterfly spotted on hourly chart of EURGBP.
Trade levels highlighted on chart - Stop should be placed above channel .
Trade with care
Gulz

AUDUSD - Potential Butterfly PatternPosted a butterfly pattern for AUDUSD last week and about to hit TP2, do refer to the link of related ideas below.
If it does, another butterfly pattern will then transpire.
PRZ area at 0.79839 to 0.79878.
Good R:R at 1.9 (TP1) and 3.2 (TP2).
I will update if pattern completes.


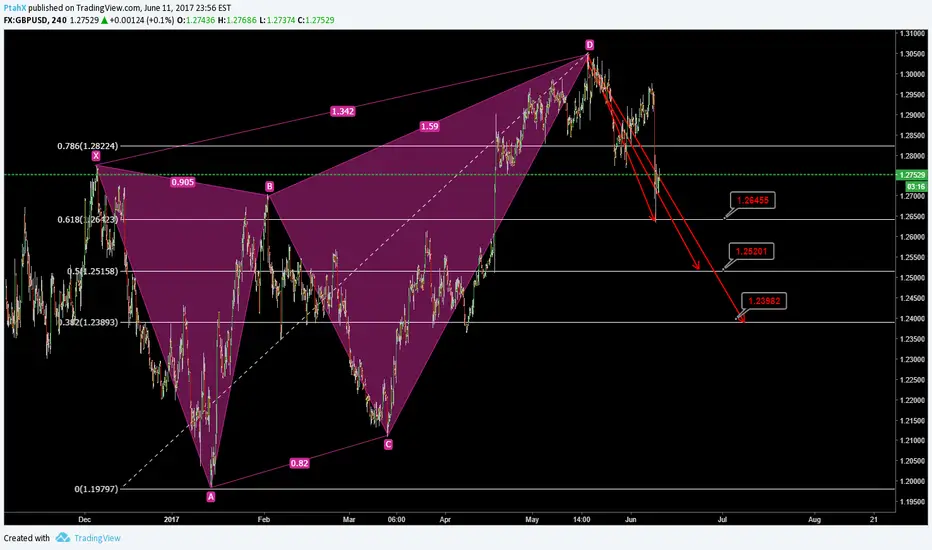
GBPUSD Bearish Butterfly ContinuationI'm expecting a continuing downtrend on GPBUSD over the next few weks -- I expect we will see at least the 1.25 level before this drop really ends. Potentially 1.24

AUD/USD What a rally?What about a rest?Record expansion in Australlia continues after data showed that australian economy grew by 0,3% the first quarter.Meanwhile AUD/USD is trading at 0,7550.
Although it's rally,we can see that the australian dollar is ready for a ''digestive'' pull back after that rally forming a bearish advance pattern and goinh towards a resistance area.
As we see at the chart we have two formations,an inverse head and shoulders and a bearish Butterfly pattern.
The inverse head and shoulders pattern(red lines) is about to be broken as price is fighting it's neck line,if not we have a continuation of the downtrend.
If price break the neck line then we are watching for the 1.27% Fibonacci Extension of XA leg of the bearish butterfly pattern and previous resistances to take a short trade.
Short trade is favoring as the 200EMA is slightly bearish.
We can also notice the downward red trendline which is broken and it propably going to act as a support in an upcoming pullback as it coincides with the 61.8% Fibonacci retracement of CD leg of the advanced pattern formation.
Stochastics are in overbought area.
POSSIBLE SHORT TRADE:
FIRST TARGET T1 AT 0,7520 WITH 2.5 P/L
SECOND TARGET AT 0,7460 WITH 4.5 P/L
BUY STOP AT 0,7650
THANK YOU FOR SUPPORT!
HAPPY TRADING!

AUDUSD Deep Crab BearishLegs A,B have completed.
Leg C is in process but has verified a Fib retracement .382 Leg A-B (.75245)
Leg C still has potential to operate downwards towards Fib retracement .886 Leg A-B (.72274)
Current targets are now Leg B-C 2.618 (.83196) if we do not retrace down to .72274.
Otherwise the target changes to a much higher price point.
Enjoy and GLTU
