ALGO Overwhelming Bullish Indicators on the BTC PairThis is a position I took at wave C of the Bearish Butterfly at 2631 sats and ended up taking profit at the top of the Ascending Triangle at 3237 sats for about a 21-22%ish gain. I am looking for a potential reentry between the bottom of the Ascending Triangle or the PCZ of the potential Bullish Bat. That being said, the Bearish Butterfly PCZ takes us slightly below the common retrace zone. Buuut, the newly found Ascending Triangle takes us right in the zone for the measured move. Potential gains here are insane. You have broken out of a downtrend we've been in for the longest time on both the Linear and Log scale. This is something I have posted a little while ago too! <3
Bearish Butterfly

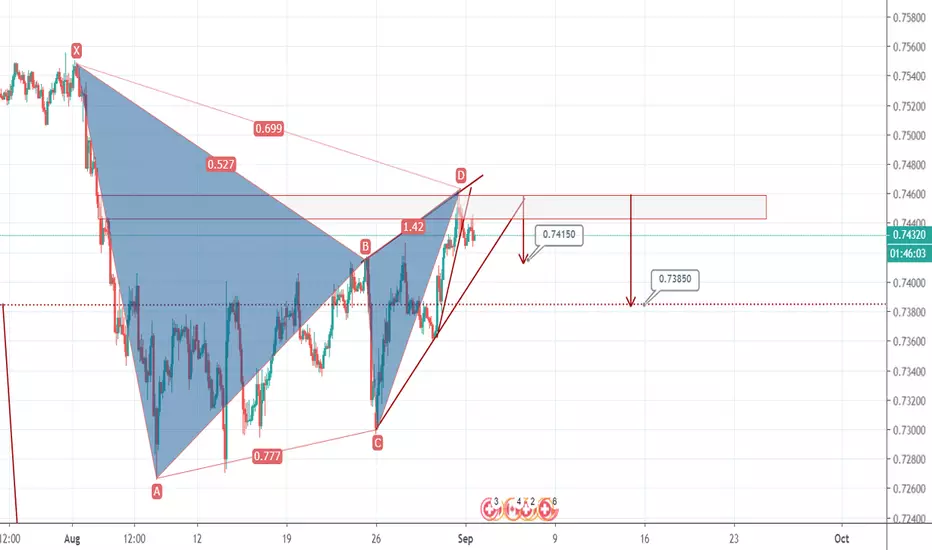
GBPUSD-Weekly Market Analysis-Oct19,Wk3Nothing much for me to look for on the smaller timeframe, for countertrend trader you may have to wait for a retracement on the smaller timeframe for a buying opportunity.
On the daily chart, a bearish butterfly pattern forming up within the sell zone. I'm definitely interested to see the development of this setup and might just participate in it.

EURCHF bearish butterfly&double bottomFor sell TP1 1.9780, TP2 1.09380, TP3 1.09150
For buy TP1 1.1120, TP2 1.1180

EURJPY Bearish ButterflyEURCHF Sideway
JPYCHF up
So looking for opportunity of SELL EURJPY
SELL NOW Bearish Butterfly completed near down trend line


is this butterfly bearish?is this butterfly bearish if the AC fib not 0.382 or 0.886?
0.608 = between 0.382 - 0.886


Trade Ideas Educator: GBPAUD ButterflyA trend trading opportunity setup once again on GBPAUD chart. The bearish Gartley has already in a valid state for a selling opportunity but I'm just not comfortable for such a strong bullish candle close before market close on Saturday. I would need more confirmation for this.
This trade decision will definitely be an epic 1 for me as it either is a great call for the "Great Escape" and walk out of the market unscathed or it will be the greatest miss in trading of my life.
Alternatively, I can always wait for the bearish Butterfly Pattern setup at a much higher price with a better reward:risk.
What's your call? Comment down below.