EURNZD Short Term Sell IdeaH4 - Price is bouncing lower from a key resistance zone.
Bearish divergence.
Until the key resistance zone holds my short term view remains bearish here.
A valid breakout below the uptrend line would be the validation for this short term bearish view.
Bearishdivergence


Solana Bearishly Consolidating at the HighsSolana has shown some Bearish Divergence on the RSI as it's Bearishly traded within an Upward Sloping Channel unable to crack above previous support; if this continues on into tomorrow we could see it crack below the channel and begin a move back down towards the level of $9.81 and if it bounces there it could easily make another lower high before then crashing down to $4.16

BTCUSDT BEARISH DIVERGENCEHere we can see that BTCUSDT in 1 day time frame is forming a bearish divergence and if the MACD line cuts the signal line we can get a confirmation for the divergence. So we can take SHORT TRADES in any alt coin also the price has a major resistance zone at the current price.

EURUSD Short Trade Setup📉💸📊👀The EURUSD pair has shown a bearish divergence on the 4-hour chart, and it looks like it's ready for a potential reversal. I am taking a short trade at 1.0636 with a stop loss at 1.0734 and a take profit target of 1.0553. Keep an eye on the price action and adjust your positions accordingly.
#EURUSD #ForexTrading #ShortTrade #BearishDivergence #TechnicalAnalysis

BTCUSD: Bearish Divergence at Potential Future NecklineBTC has been forming what looks to be a big Inverted Head and Shoulders pattern at the 0.786 PCZ of a Macro Bullish Cypher and today it tried to make a higher high but failed to maintain relative strength. Now we are in a scenario where it is quite likely that BTC will retrace from here and form what would be a Potential Right Shoulder to test $20k-$16k one last time before ripping to the upside.

ACHUSD: Pullback To Form Potential Inverse Head and ShouldersACHUSD has some Bearish Divergence on th RSI at the list price and the 200SMA and looks like it could be setting up for a Pullback. If it pulls back we should look at the potential for it to form a Right Shoulder that could lead to a bullish breakout on a later date.

AUDNZD Short Term Sell IdeaD1 - Price has reached a key resistance zone.
Bearish hidden divergence followed by continuing bearish divergence.
H4 - False break with bearish divergence.
If the price breaks below the last low at 1.09283 with momentum I may then expect short term bearish moves to happen here.
Alternatively if the price moves higher breaks and holds above the key resistance zone then this bearish view will be invalidated.

GMXUSD: Bearish Gartley with 4HR MACD Bearish DivergenceThere is a Bearish Gartley visible on the 4 Hour with MACD Bearish Divergence; if it reaches the full target it should see a pullback to around the 200 SMA again.

LDOUSD Bearish Shark: Likely to Crash Down With EthereumLDO is at the PCZ of a Bearish Shark at the sametime ETH is at the PCZ of Bearish Bat and Both a reacting negatively to the PCZ and showing Bearish Divergence, ETH is also the most bearish looking coin on the market as can be seen in the related Ideas tab below. I think that ETH and LDO will be losing most of their value very soon while the rest of the non DeFi Centralized coins like BTC and Doge, and LTC will only take a minor hit by comparison.

AUDUSD - Looking To Sell Pullbacks In The Short TermH4 - Bearish convergence.
Currently it looks like a correction is happening.
H1 - Bearish trend pattern followed by double wave correction.
Bearish divergence.
Until the two strong resistance zone holds my short term view remains bearish here.

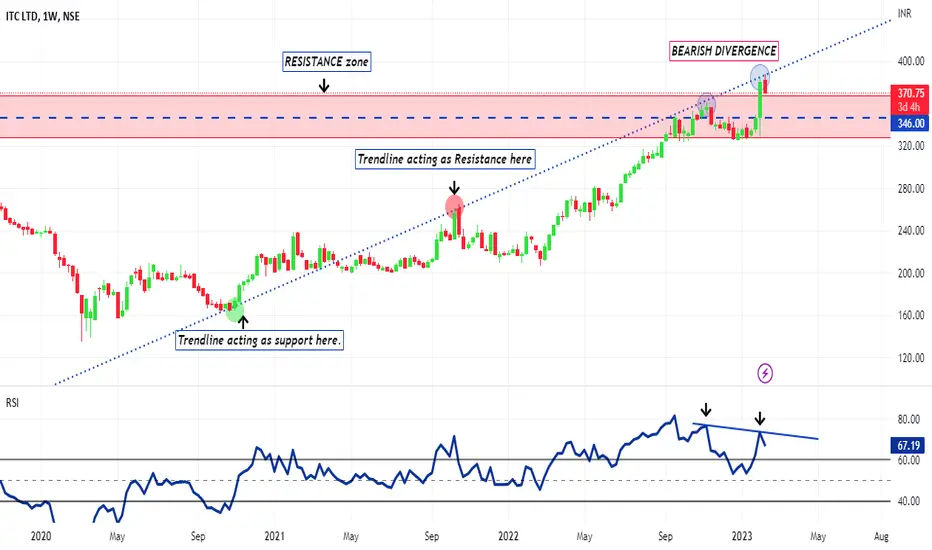
#ITC Bearish Divergence.#ITC Weekly chart showing BEARISH DIVERGENCE beween it's PRICE & RSI. Upward tredline firstly acting as support for the price & now acting as resistsnce for the price. If price holds itself below the resistance of trendline than peice can come toward downside in coming days.
AUDCAD - Looking To Sell Pullbacks In The Short TermD1 - Bearish divergence.
Currently it looks like a correction is happening.
Expecting short term bearish move towards the key support zone .
H1 - Bearish trend pattern.
Currently it looks like a pullback is happening.
Until the two strong resistance zones hold my short term view remains bearish here.

EURCAD Short Term Sell IdeaH4 - Bearish convergence.
Uptrend line breakout.
Currently it looks like a correction is happening.
H1 - Bearish trend pattern.
Until the two strong resistance zones hold my short term view remains bearish here.
A valid breakout below the most recent uptrend line would be the validation for this bearish view.

BULLISH into BEARISH ScenarioTSLA has momentum to move to 180 area. (This needs to happen before FOMC meeting)
I thought Tesla was finished here, but momentum is strong and puts are piling in, I think we may see a continued rally to 169,if we close above 167.55 on daily or weekly, Tesla could hit 180 by Tuesday, before selling off
Technical Bullish Patterns:
15min- Bullish pennant breakout - measured move to 170-175 (close below 154.5) invalidates (false break-out)
Daily: H&S Pattern measured move to 175-181 (close below )
Technical Bearishness:
1 hr - Bearish Divergence on RSI, MACD, STOCH
200 WMA: 167
currently oversold on BB bands
Bearish Catalysts:
-1/27 PCE Prices higher than expected
-1/31 employment cost index higher than expected
-1/31 Bad Tech earnings
-2/1-Fed Drops Market on Feb 1st (FOMC decision) **** I think Fed will tank the market

GOLDUSD: 4 Hour Bearish Divergence; Trendline BreakdownGold off of 4 Hour Bearish Divergence has Broken Below a Trendline and seems to be Attempting to confirm the breakdown and continue the downwards move.

GBPUSD - Looking To Sell Pullbacks In The Short TermD1 - Price has reached a strong resistance zone.
Bearish divergence.
H1 - Bearish divergence.
Lower lows.
Until the strong resistance zone holds my short term view remains bearish here.

USOIL: Remaining Stubborn within the RangeUSOIL has managed to stay slightly above the PCZ of a Bearish Butterfly as well as to not break down any trendlines and avoid the bottom of the Range; However, Despite how strong it may look it still has dailed to break structure and it has been showing lots of Bearish Divergence. So long as the range holds i suspect that we will trade back below the 1.618 and eventually go for the Bearish Break Down Targets that could lead to a Bearish 5-0 to take us down to Atleast $56.27.

RIOT Blockchain: Bearish Divergence Double TopRIOT has Hidden Bearish Divergence ont e MACD and Classic Bearish Divergence on the RSI and I will be playing this via the March Puts at the strike of $5.5.

GBPCHF - Short Term Bearish And Mid Term Bullish IdeaH4 - Bullish trend pattern.
Price reached a key resistance zone.
Bearish divergence.
Basically my short term view is bearish and my mid term view is bullish here.

ALGOUSD: RSI Head and Shoulders After Amazing Bat PerformanceAlgo has a Bearish Head and Shoulders and the RSI and is Bearishly Diverging on the MACD after giving us a some great performance off the Bullish Bat and 61.8% area. Now i will be looking for this to come back down to settle within range.

Bitcoin Cash: Bearish Divergence Price ProjectionBitcoin Cash is showing both MACD and RSI Bearish Divergence on the 4 Hour Timeframe at the Hi-ADR and this could result in BCH forming a Bearish BAMM to take it back down to the 0.886 Fibonacci Retrace at $99.67 if my projection is correct.

MANAUSD: Potential Double Top ProjectionWe have Bearish Divergence oin the RSI and some choppy Bearish Divergence on the MACD if that Divergence plays out at these levels that could begin to put us in anM structure that would take us back down to 30 Cents
