AUD/CAD: Bearish momentum to downAustralian dollsr formed a bearish divergence in H4 and break out co firmee with that pull back. So. I WILK SHORT AUDCAD now
The i dicationits here in this display.
Morr later I will update this par
Bearishdivergence

SLP bounceBearish divergence in 15m TF. We might dip below to 0.0201 and most likely bounce from there back to retest the resistance. From there we will know if we will go beyond 0.0211. If we dip from the current level, it will form a bullish butterfly pattern.

WAVES short One of the biggest gainers in the past month. 320% in 25 days.
Inside a rising wedge 5 waves should be followed by ABC. Daily RSI in overbought and in bearish divergence.
TP1: ~24.5$
TP2: ~21.4$
TP3: ~19$
SL: 35$
It could go higher and touch the upper resistance of the wedge. That will result in a 4H bearish divergence.
Very good risk reward ration.

SPY Continued Downside - Hidden DivergenceChart Even t: Bearish Divergences on multiple timeframes. Rising wedge pattern on 65m and lower timeframes.
Confluence : Bearish Divergence on 65m timeframe. Hidden Bearish Divergence on daily timeframe. Rising Wedge pattern (bearish) on 65m and lower timeframes. MACD very wide. Volume decreasing. Death Cross moving average event occurred a few days ago. Price action is nearing old resistance levels along with the 61.8% Fibonacci Retracement level. RSI overbought on 65m timeframe.
Trade Idea : Put Swings
Contract Suggestions (depending on Monday's open) :
Best: 4/8/22 450P
Riskier 4/6/22 450P
Riskiest 4/1/22 450P
I will likely buy both the 4/8 and the 4/1 contracts, heavily weighted to the 4/8 contracts to allow this time for this move to play out.

TLM/USDT - SHORTHello everyone,
There is a bearish divergence in this chart. Can open 2 orders. 0.1165 and 0.1200. Your entry'll be 0.11825. Can use your stop loss to 0.1235

Watch Ya Dolla Dolla Bills YallLooking at the idea of a head and shoulders forming here for the dollar. Larger timeframes such as the two week timeframe are beginning to form hidden bearish divergence and will eventually need to come back down and reset

GBPCHF Short Term Sell IdeaH4 - Bearish trend pattern followed by a correction.
Price is bouncing lower from a key resistance zone.
Bearish divergence.
Expecting short term bearish moves to happen here.

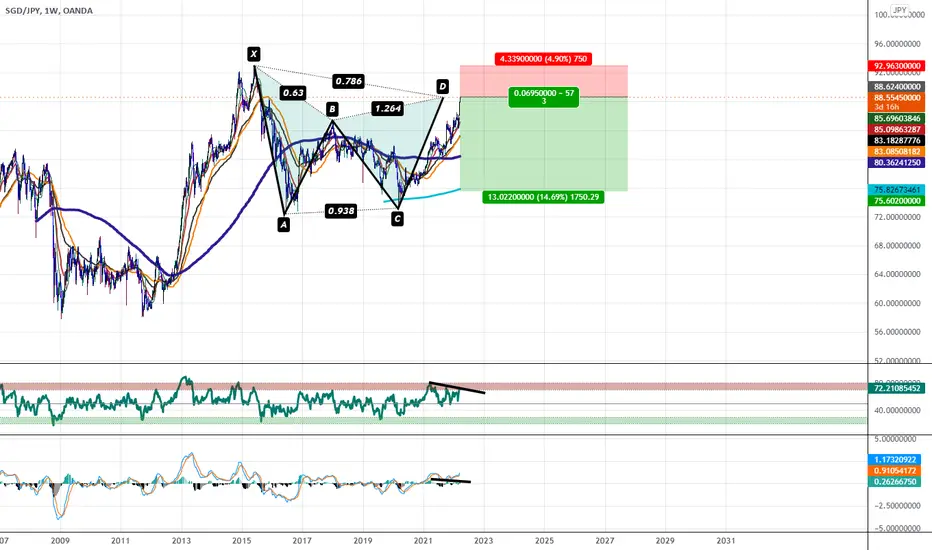
SGDJPY at PCZ of Bearish Gartley with Bearish DivergenceGoing to be looking for this to reverse and give us about a 70% retrace in the coming weeks i also believe we will see similar action on the USDJPY pair.
Ascending Broadening Wedge Visible on Weekly Time FrameWe gave Double Bearish Divergence on the RSI and are at the Supply Line of this Weekly Ascending Broadening Wedge. We are however very near 100 an di wouldn't be surprised if it just came to visit the area's of 100 before coming down but at this point in the chart would be a nice place to take profit or take a shot a being Bearish.
As of right now the put options are very expensive for this stock most of the puts are trading at about 3-5 times the price of the calls for the same strike so we will have to wait for those puts premiums to go down but if they ever do it will be a nice entry.

Bearish divergence on BTC dominance chart. ALT season soon?Although it depends on capital flowing into crypto in the following months, a bearish divergence has historically proven to be a good catalyst for Altcoin markets.
We wait and see...
Good luck!

Bearish Divergence at PCZ of Bearish Gartley and Double TopWe have Bearish Divergence at the PCZ of a Bearish Gartley with somewhat of a double top and from the looks of it our major target will be $3.43 once it breaks the neckline.

LUNAUSDT - BEARISH DIVERGENCELUNA had a great run within the last 24 hours.
However, there is a bearish divergence on the daily time frame. Expect some pull back. Support levels are as shown on the chart.
Thank you for your time and support.

Waves/usdt - ShortWAVES/USDT - SHORT
Hello everyone, there is a bearish divergence in this chart.
The first target is 24.5$ the second target is 21.5$

T-Mobile | TMUS | Short to Fill the Gap BelowT-Mobile ( NASDAQ:TMUS ) popped after its most recent earnings release. The gap below looms before the March 2022 Fed meeting and OpEx week. Based on its inability to break through resistance, the slight bearish divergence, and the weakening momentum, I expect the gap below ($110.50 = $116.91) to be filled in the coming days/weeks.

Double top at PCZ of Bearish Shark with Bearish DivergenceWe have a potential double top here at the PCZ of a Bearish Shark i will be risking some puts here.

Be carful with your long positions !!!!Massive bearish divergence across the market since yesterday that BITCOIN rallied towards the $45k.
(RSI and VOLUME DIVERGENCE)
Volume is not supporting this move up anymore, and you don't want to hold your position on the weak side.
Meanwhile, we have 2 FVGs below, which we may fill them soon.
I am looking at H4 demand for any long setup to develop.
* shorting this into the demand with the invalidation above the yearly open has a decent R/R
stay tuned and follow my om tradingview if you want to get notified whenever I open a long position

$GBPJPY Looking for sell $GBPJPY looking for sell both in perspective of elliot wave and to weekly bearish divergence lets see .DYOR

Bearish Shark Visible on Monthly on Philip MorrisI expect this to go down near to list prices from here off the bearish divergence and the hardcore rejection of the highs.

TKN | possible breakout but upside limited bearish divergencePrice Action and chart pattern trading - possible breakout but upside limited
> Testing the upper limit of uptrend parallel channel and key resistance of volume profile
Indicator
> Bearish divergence signal: Fundflow, BBD, and KDJ Stochastic
> Strong volume support with smart money and banker chip of this wave

USDJPY Short Term Sell ideaD1 - Bearish Divergence.
Expecting short term corrections to happen here.
H4 - Price is bouncing lower from a key resistance zone.
Bearish trend pattern.
Until the key resistance zone holds I expect the price to move lower further after pullbacks.

US Oil Looking to Get Rekt at The PCZ of a Bearish Alt BatWe have a Bullish 3 Line Strike at the PCZ of a Bearish Alt-Bat on this Bullish ETF for US Crude Oil and are showing Bearish Divergence after taking out the Price-Action of more than 3 of the previous Bullish Days with one Bearish Day this signals to me that the major Bearish reversal is about to begin.
On a side note the MACD has crossed Bearishly.

Bearish Dragon with Bearish DivergenceWe have bearish Divergence on both the MACD and RSI and are Back Testing a Trendline as new Resistance this looks like it will lead new lows.

Gold Short Term Sell IdeaD1 - Price is currently holding in a key resistance zone.
Potential bearish divergence.
H1 - Bearish divergence.
Until the invalidation level holds my short term view remains bearish here.
If we get a valid breakout below 1850 level we may then consider it as a validation for this short term bearish view.
