Rising Wedge with Bearish Divergence on the MACDLooks like we may get a pullback from the highs here off the Bearish Divergence on the MACD and the impending overbought condition on the RSI at the top of this Rising Wedge Pattern.
Bearishdivergence

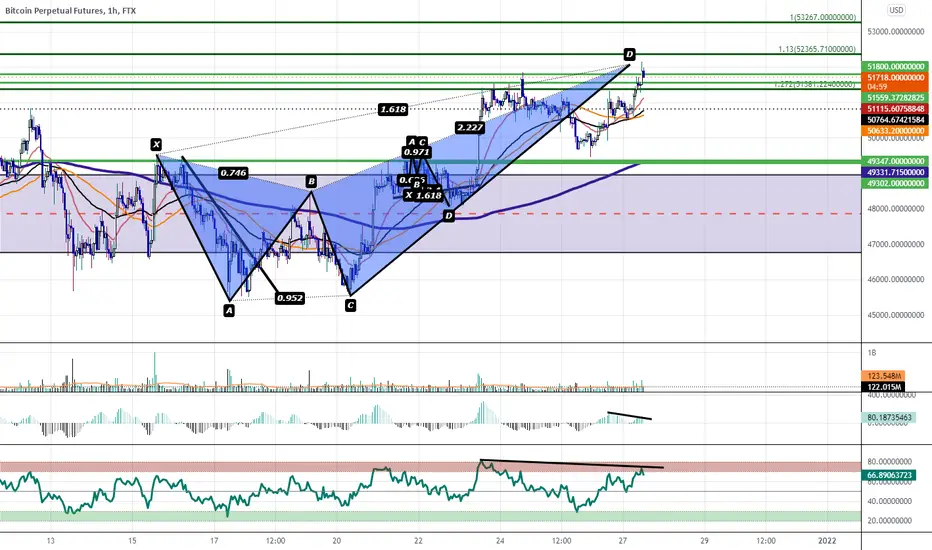
S&P500 Fall Time (Over Bought)Hi
as we ca see we have a Bearish Divergence between Price and MACD which is a sign of trend reversal and retracement .
we have Price Action analysis with FIbots and Divergences which is having Confluences with each other and it can be used as some certain levels and Targeting areas
we have specified some levels as our targets and a time speculation indicator and it can be even earlier to the specified time in the time forecasted.
there are lots of fundamental reasoning behind this market correction too
we can point at some USA's political havocs and Biden's Impeachment and probably China's market war on US...
please comment you ideas

EURUSD Bearish Divergence and Shorting Chance Hi
as we can see this pair had shown a Bearish Divergence with MACD which is a sign of reversal and bearish trend to start and fall of Euro which i have specified it with Blue Arrows on MACD and Price
i have used Fibonacci Retracement Tool to forecast its fall and Specified the Fall Depth with a Green TP zone
i have also specified a SL line around 1.25 which is a good enough renege zone and free play space for the upcoming Fluctuations if any
please comment your ideas and opinions


GBPUSD Bearish Divergence, Shorting Chance for Swing Traders Hi
as we can see in this Daily chart that we have reached a consolidation area in GBP where we are now reneging in a monthly resistance Zone and there are total of two Bearish Divergences forming with MACD, where MACD is making Lower Highs and Market is Making Higher High which is a sign of trend reversal and end of the GBP bullish Rally and start of a retracement or even a trend reversal.
both Divergences are specified with Blue and Red Arrows on MACD and Market for better comprehension
I have used Fibonacci retracement tool to find out the areas where it can retrace to.
there are total of two divergences and two Fibonacci bullish waves
I have specified two targets to achieve or two points to retrace the wave
you can also see a Stop Loss level has been set on the chart so we can have some good Risk to Reward ratios (RR) Minimum of 3.5:1 up to our 1st TP zone and we can manage the positions by trilling our stop as the positions progresses
First TP can give you 400 Pips
Second TP can give you up to 1000 Pips
enjoy.
please comment me your opinions

4 Hour Bearish ABCD On The DowWe have one of those super short ABCDs on the Dow. Similar to the ones we got on BAT and ENJ before their major reversals based of that im just gonna go for the full reversal here on the Dow.

Dax Short Term Sell Idea From Key Resistance ZoneH4 - Price is bouncing lower from a key resistance zone.
Bearish divergence.
H1 - Bearish convergence.
Currently it looks like a pullback is happening.
Until the key resistance zone holds my short term view remains bearish here.

NEARUSD Price Action Looking StinkyWe got a Pseudo Bullish 3-Line-Strike with Bearish Divergences on the RSI and a bit of Tweezer Top action NEAR the PCZ of some AB=CD Patterns. I expect to see this go down towards the 10 dollars area in the NEAR future.
Here's a Close up on the 4 Hour 3-line-strike/tweezer top price action:

Polygon / Matic 4H timeframe projectionHello folks Happy New Year 2022.
As you can see MATIC chart has printed an HEAD and SHOULDERS patters. Which is talking shape right now.
So i am expecting to retest the 2.09 price which is support. Then getting ready for NATH. Which will be at least 3.30$
So right now is potentially DANGEROUS to jump into LONG position.
Just wait.
Love you all And happy tranding folks ❤❤📈📈

GBPJPY Weekly Long-Term Jan 2ndWeekly Bearish Divergence.
Head & Shoulder Sell Pattern in confluence with Weekly Bearish Divergence.
Currently at top of right shoulder.
30m and 1H Bearish Divergence.
Waiting for structure to break on 1H & 4H.
Expecting right shoulder to play out back to neckline for sells.

GBPJPY Jan 2nd Analysis 30m & 1H Bearish Divergence.
Price currently at weekly major rejection zone.
Waiting for structure break and for price to fall under 100 EMA .
View related idea for weekly bigger picture analysis.

SUSHI LTF 4h correction?Seems like the bearish divergence on 4h chart is playing out.
The EMA 21 support did not hold.
Overall SUSHI did 100% with little to no correction so I think 30% corrective move is healthy with making HL and continuing with the uptrend.
If we do not make HL and make LL instead or lose $7.5-$8 support, there is a high chance we are gonna revisit the HTF range low (around $6) --> Check out my related idea on why was sushi currently pumping from the HTF pov.


US100 Bearish Divergence 30MBearish Divergence on the 30 Minute on US100, Look for a pullback and a dipbuy upon return of momentum
DONT TAKE A TRADE ON ONE PATTERN OR INDICATOR ALONE, NOR BECAUSE YOU SEE A COMPELLING ANALYSIS. DO YOUR OWN ANALYSIS, MAKE YOUR OWN CHOICES>
Thank You. If you like daily analysis on US100, Gold, and Majors in forex, then follow my page, I'd greatly appreciate it.

SBUX Running out of SteamWe have a nice Head $ Shoulders pattern which is ready to break .
On Weekly time frame a bearish divergence occurred.
We are targeting the 96 price level.
SL just above 110.
Entry when the support breaks.
If you like the idea, do not forget to support with a like and follow.
* 𝗧𝗵𝗲 𝗶𝗻𝗳𝗼𝗿𝗺𝗮𝘁𝗶𝗼𝗻 𝗮𝗻𝗱 𝗮𝗻𝗮𝗹𝘆𝘀𝗶𝘀 𝘀𝗵𝗮𝗿𝗲𝗱 𝗶𝗻 𝘁𝗵𝗶𝘀 𝗽𝗼𝘀𝘁 𝗶𝘀 𝗻𝗼𝘁 𝗳𝗶𝗻𝗮𝗻𝗰𝗶𝗮𝗹 𝗮𝗱𝘃𝗶𝗰𝗲 𝗮𝗻𝗱 𝗶𝘀 𝗳𝗼𝗿 𝗲𝗱𝘂𝗰𝗮𝘁𝗶𝗼𝗻𝗮𝗹 𝗽𝘂𝗿𝗽𝗼𝘀𝗲 𝗼𝗻𝗹𝘆! 𝗔𝗹𝘄𝗮𝘆𝘀 𝗰𝗼𝗻𝗱𝘂𝗰𝘁 𝘆𝗼𝘂𝗿 𝗼𝘄𝗻 𝗮𝗻𝗮𝗹𝘆𝘀𝗶𝘀 𝗮𝗻𝗱 𝗿𝗲𝘀𝗲𝗮𝗿𝗰𝗵.

$SPY Careful Kings Bearish DivergenceWhat's interesting is IWM looks bullish, while SPY appears bearish to me in the short term.
They never make it easy, and with big numbers coming out (GDP, Jobless Claims, Oil/NG inventories, etc.) tomorrow we could see a pop then a drop. Bearish divergence leads me to be bias towards 456 zone in the next 1-5 trading days similar to May 4/5 price action.
I'm hedged short with SPY puts, with other longs in the longer term (DEC and 2022 Opex) looking to go Net long after indicators show bullish confluence.

#GBPNZD ShortWatching GBPNZD short as it reached to a resistance level and a bearish divergence 1:5 RR a strong resistance can help it to reach to previous support level


Update on Bitcoin's Log Harmonic XABCD ButterflyBackground
On May 1 Bitcoin had shot up to the 1.618 extension of XA and stalled there for a while and I posted my first log butterfly idea, which will be in the lined idea below. I was one of the first and few people warning that this price action was at a major target and we should be expecting a retrace. As part of my disaster scenario and personal development I checked the price action for harmonic patterns and I found that the fib levels matched a harmonic butterfly, but only on the log scale.
Since then we can see strong profit taking above the 1.618 level with only a hint of a monthly candle body above the level. Now the price action stalling at $69,000 is mildly amusing, much like the SPX bottoming out in 2008 at $666, making you wonder just how juvenile the financial whales really are. Still, since there was a slightly higher high I have moved point D appropriately and therefor point E is a tad higher than in my original post.
Technical Analysis
As it seems we have a double top the log Harmonic Butterfly appears to remain valid. We remain part way through the month of December but I don't see much changing with the bearishness I see in the chart, or globally with the financial system.
The image below shows your standard indicator set up for the MACD and RSI with some basic charting. I remember in 2018 we had a descending triangle and all the bulls saying we would get a cup and handle or a saucer formation. I was new to trading and got caught up in the hype myself. Those bullish formations? Didn't happen. Now we have an apparent double top at this major fib target. When we look for the indicators for some clarity we see a lot of bearishness to back up the bearish chart formation. I wrote down the full divergence primer just for the sake of being thorough, but we only really need the normal bearish divergence.
Normal Divergence (Trend Reversal)
Bearish: Higher Highs on the price action but lower lows on a indicator
Bullish: Lower lows on price action but higher lows on the indicator
Hidden Divergence (Trend Continuation)
Bearish: Lower high on the price action but a higher high on the indicator
Bullish: Higher High on the price action but a lower high on the indicator
The RSI and On Balance Volume both have normal divergence, with a higher high on the price action but a lower high on the indicator. With an asset like bitcoin which has been continually printing new coins for its whole existence the fact that we have lower OBV now is curious. The RSI divergence shown in purple from peak to peak suggest that we are more than likely going to see more downside leading to a MACD cross. I have been watching for that for a while. I remember when I was calling for a weekly MACD cross and people told me that wasn't going to happen. But guess what, it did. The OBV slipping the 10 is a very serious sign that buying has dropped off. It seems that we will have a very high chance the OBV will slip the 20 EMA as well. Historically when the OBV has been below the 20 on the mouthy it has been a great place to invest in crypto.
Fundamental Analysis
Two main driving assumptions behind this post is the idea that interest rates are going to go up at the same time DXY is going up as well. Why? The Federal Funds rate is in a massive long term falling wedge. If you don't view it on the monthly time frame or higher you can get some weird quirks in the data. What does this mean? It means that the rate that banks charge one another for overnight loans is going to go up. That means that broadly, all interest rates on dollar denominated debt is going to go up as well. Bitcoin by itself doesn't have any yield. It isn't going to be as relatively attractive in that environment as something giving you a coupon or a dividend or an interest payment. How the de-fi space will adapt to these increasing rates will be interesting. How people will assess risk with interest rates moving vis-a-vis bitcoin and crypto in general will also be very interesting.
Likewise the Dollar is in a massive long term falling wedge. I found this wedge by putting the data on log scale, and now I see a few key analysis doing the same (after I twitted at them a couple of times). The Dollar is going to pump along with interest rates, the same way that can see happened in the late 70s and early 80s. I haven't shown it, but going into the peak of DXY and the Federal funds silver had just done a blow off top and entered a historic bear market. Equities were broadly flat until the Federal Funds rate began to decline and then things began to pump. Perhaps crypto is topping prior to the dxy and fed funds rate just like silver did. Another thing to watch is the velocity of money. The money supply is at an all time high and any small movements upward in the velocity of money is going to make anything you need very expensive, which probably isn't a good thing for intangible assets like crypto.
A quick look at my alternative bearish scenario
Quite Simply, the Monthly Keltner channel will provide support for monthly candle bodies it has done so far. The 200 week SMA has also done a very good job at providing support till now. Investing when the Stoch is so low has historically also been a great decision. If the monthly Keltner and 200w continue to hold then of course my idea is negated.


SPY Bearish Divergences w/ Potential Triple Top$SPY S&P500 ETF. SPY is currently hesitating near all-time highs which has led to a potential bearish triple top formation(upper red arrows) on the daily chart. As price has stayed relatively the same since early November, the lower indicators have all been declining(lower red arrows) which has created a bearish divergence. The lower indicators all show that the internals behind the recent rally in price from October to November have weakened, but have not flipped bearish yet.
The PPO indicator shows the green PPO line trending below the purple signal line. This indicates a short-term loss of upward momentum in price. This indicator isn’t considered bearish until both the green and purple lines are below the 0 level. What we would need to see going forward in order for price to continue moving higher is for the green line to cross back above the purple and for both to continue moving higher.
The ADX indicator shows the green DI and purple DI lines overlapping which means that the short-term trend in price has flatlined. When the green line is above the purple line the short-term trend in price is up, and when the purple line is above the green line the short-term trend is down. The histogram behind the DI lines is declining which indicates weakening trend strength. What we want to see here is for the green DI line to cross back above the purple DI line, and then for the histogram to begin rising which would indicate a short-term bull trend with increasing strength.
The TDI indicator shows the green RSI line rolling over after finding resistance at the horizontal 60 level and the middle of the RSI Bollinger Bands. The intermediate momentum behind price can be considered bullish based on the fact that the RSI is above the horizontal 50 level and so is the center of the BBands. When both are below the 50 level the short and intermediate momentum in price can be considered bearish. What we want to see in this indicator is for the green RSI line to cross above the center of the BBands and then rise above the 60 level to give us a strong indication that the short-term and intermediate-term momentum behind price is bullish.
Worth noting is that as price rose this week, volume declined. This indicates that less traders were in the market moving price back up to test the all-time high near $470 after the previous double top.
Should price continue to hesitate and rollover over from here, local lows can be looked at for potential levels of support. The two most recent local lows to watch are at $450 and $425, those were the last two levels of demand prior to new all-time highs being made. If the market is still mostly bullish, those two levels will hold, with $425 being the critical level.
#sp500 #spy #spx #stocks #equities #trading #investing #chart #analysis #technical #indicators #candlestickchart #pricepercentoscillator #ppo #averagedirectionalindex #adx #tdi #tradersdynamicindex #rsi #relativestrengthindex #trend #momentum #tradingview #price #etf #divergence #bearish #bearishdivergence


#ALGO Algorand 1D - Bearish Divergence in sightI am looking at the 1D chart for Algorand. I show the top and bottom multi-year trendlines and it seems that we may have some downside to go possibly based on historical trends. I showed a possible fractal from the past that may play out again.
Lastly and most important, on the daily chart there is bearish divergence. This may be a good indicator of what's to come in the future.
What are your opinions on this? Comment below, hit the like and follow me. Thank you!
Check out more below for recent Altcoin, Bitcoin and Stock Ideas.
Disclosure: This is just my opinion and not any type of financial advice. I enjoy charting and discussing technical analysis . Don't trade based on my advice. Do your own research! #cryptopickk #bitcoin #altcoins
