Potential Hidden Bearish Divergence USDCHF?Potential Hidden Bearish Divergence? Maybe, but for shortly time period i assume market will prior go to upside movement. I predict market will
reach at point 0.92267. Because there's is cluster area between Exponential Moving Average 21, and Fibonacci 61.8 golden ratio. After the price touch the area, let me see if stochastic make a divergence momentum or not.
Bearishdivergence

GBPNZD Inraday Sell ideaD1 - Price is bouncing lower from a strong resistance zone.
Bearish hidden divergence.
H1 - Bearish divergence.
Lower lows.
Expecting the price to continue lower further in the short term until the strong resistance zone holds.

EURAUD Short Term Sell IdeaD1 - Price has reached a key resistance zone.
Bearish hidden divergence.
H1 - Bearish divergence.
Until the key resistance zone holds I expect short term bearish moves to happen here.

Bearish Gartley with Bearish Divergence on the BLOK ETFThis ETF holds a lot of crypto related stocks that i am not very optimistic on and it's at the PCZ of a Bearish Gartley i'd say it's perfect for buying some monthly EOY expiry puts on tomorrow.

BEARISH DIVERGENCE ON THE SOLUSDT CHART 1DBearish divergence on the SOL chart in a one-day time frame, could fall to a price of 217 and then continue its bullish rally.

AUDNZD Short Term Bearish ideaH1 - Price is nearing a strong resistance zone.
Bearish divergence.
Until this strong resistance zone holds I expect short term bearish moves to happen here.

GOLD pt. 3.1Looks like we might have a double bottom. Price needs break past green zone for further move up.
On 4h there is bearish divergence, another signal for buy order and 1d chart ther doji morning star.
Good luck.

Dow Jones Hidden Bearish DivergenceI saw a Hidden Bearish Divergence on the DJ30 movement. This moment shows the price has potential to continue the bearish movement. there is
small support at point 35539.2. So I will assume the price will reach the support area.

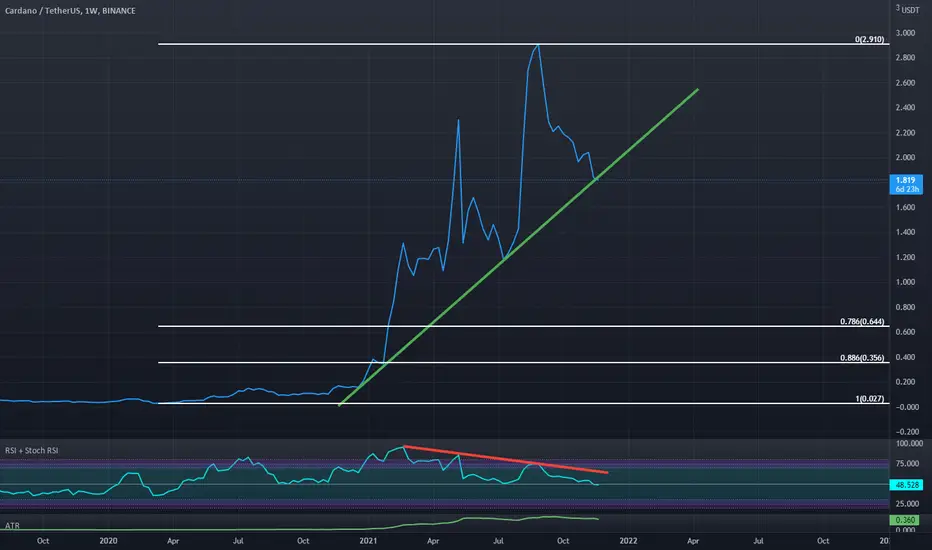
Weekly Bearish Continuation on Cardona Seems To Be Confirmed I posted some setups on lower timeframes awhile back near 3 dollars and over that time period ADA has pulled back and closed below this weekly trendline and now it seems that we will be going for much deeper targets Potentially down below 80 cents.
Bearish Evening Star at PCZ of ABCD Visible on the Weekly in ETHThis reversal from the D point of our ABCD has great potential of taking ETH back down to a minimum target of $2,500 and as low as a maximum target of $600

The only divergences guide you needHello, everyone!
There are a lot of traders and many of them use divergence in their own way. Most of these ways lead to the deposit losses in the long run, because generate the late entries. I like to trade with Alexander Elder’s approach to the divergence. It has the clear entry condition and the small stop-losses in case of mistake. Divergences allows to enter the market exactly before the actual trend reverse, thus you always buy the dip and sell the rip, which produces the best risk to reward ratio. Foe divergence defining we will use MACD indicator, but you can choose any oscillator with zero-lne. After reading this guide you will be able to define divergences on every appropriate oscillator.
Let’s consider this approach!
Bearish Divergence
What is bearish divergence? For the true bearish divergence we should see four obligatory signs.
(1) Point C on the price chart should be higher than point A.
(2) Point C on the MACD is below than point A.
(3) The MACD histogram have to cross the zero-line to the downside to form the point B
(4) The MACD histogram have to cross the zero-lne to the upside after the (3).
Now it’s time to find the entry point. Point C is formed when the decreasing column appeared on the MACD. (5) It is the time to execute short position . Stop loss we should take above the point’s C high. As you can see we have the very small stop loss with the huge profit potential.
Next condition enhances the short signal:
(6′) Decreasing MACD lines while the price increases.
Bullish Divergence
Bullish divergence is the opposite to the bearish. We have to see the following conditions.
(1) Point C is below the point A on the price chart.
(2) Point C is above the point A on the MACD histogram.
(3) We have to see first MACD histogram crossover with zero-line to the upside to form the point B.
(4) Than we have to see the opposite crossover to the downside.
Now it’s time to wait the first increasing column on MACD histogram to spot the point C and (5) execute the long positions . Stop loss should be set below the point C low.
We can often see the price decrease continuation to the point D, this point is (6) also forms divergence, which enhances long signal, like the (7) divergence with MACD lines.
In this particular case the stop loss was not hit, but it could be the case. In this case we should re-enter position when the divergence conditions was met again.
DISCLAMER: Information is provided only for educational purposes. Do your own study before taking any actions or decisions at the real market.

BTC Bearish Divergence - pull back to log uptrend line - $53K PTBTC is showing bearish divergence with low volume on the daily chart. Each time this has happened during the 2020-21 bull run we see a pullback to the long-term log uptrend line. Implied short-term PT is at $53K support zone, assuming that holds we will then resume the move upwards.

Attempting a Descending Triangle Breakdown on LRCUSDThis coin has been going crazy recently but we finally have gotten to see is slow down a little as it's breaking below a potential ascending triangle and below the 50 line on the RSI for the first time since the rally began so i'm expecting a decent pullback from here.

GBPAUD Technical AnalysisWe can see its strong downtrend then it's pullback twice and become a double top.
Also, we can see bearish divergence. But we know the market behavior could be anything if we can surely do trading everybody should be a billionaire.
So try as much as a possible confirmation.
And if it goes down and breaks the neckline then wait for the pullback for re-entry the position.
Good luck 🙂

Regular bearish divergence with price hitting resistance on goldBearish divergence shown between price and the money flow index indicator shown with price hitting resistance look to go short and target 1/3 risk to reward

DJI STILL MAKING HH BUT LL INCOMING!DJI on the weekly still making Higher Highs.
RSI is showing Bearish Divergence as it is printing HL even though price action is making Higher Highs ;-)
Expect Lower Lows at some point on the Daily TF and Weekly TF.
Major STOCK MARKET correction incoming due to inflation.
Only short a downtrend as this is in a uptrend lol.
NOT FINANCIAL ADVICE.

Ethereum #ETH Weekly - Is $10K possible?From past history, when Ethereum goes into oversold territory RSI at 70+ on the weekly chart, the price seems to show a nice pump. See the chart to understand more.
There are a few issues to consider as well:
1) We are potentially forming bearish divergence
2) Almost 6 weeks of upside weekly candles
3) If BTC has a correction, ETH will follow
Lastly, I drew a few fib levels to watch if a pump occurs, where would we be able to get to. With just about 120% gain from current price levels, we could be seeing almost a $10K ETH.
This is all exciting but we do have a few hurdles ahead.
What are your thoughts? Comment below, hit the like and follow me. Thank you!
Disclosure: This is just my opinion and not any type of financial advice. I enjoy charting and discussing technical analysis . Don't trade based on my advice. Do your own research! #cryptopickk #bitcoin #altcoins

BTC Bearish Divergence ?If we look at the monthly and weekly RSI we can see that BTC is forming a bearish divergence... but what does this mean?
1) Bitcoin managed every time to reach 97 level on the monthly RSI at its ATH of every cycle. Even in the double top ATH cycles of 2013, both reached 97 level.
2) Bitcoin reached 97 level in May 2021 before crashing in May down to 30k.
3) So either Bitcoin is forming a bearish divergence on the monthly and weekly RSI and will fall this cycle without making double top ATH on the RSI. If this scenario plays out it'd be a first for bitcoin and will take many traders by surprise, or...
4) Bitcoin may have a lot of room to pump so high from here... yet. And this cycle will be lengthened and extended to more months into 2022.

#AXS Axie Infinity 1D - Brewing ActionAXS on a daily chart.
A few things to note:
1) Rising wedge pattern in play.
2) Bearish divergence on 1D chart
3) Bollinger Bands tightening but similar structure forming since last tightening as circled in the chart.
Something interesting is surely brewing here.
What are your thoughts? Comment below and hit the like please. Thank you!
Disclosure: This is just my opinion and not any type of financial advice. I enjoy charting and discussing technical analysis . Don't trade based on my advice. Do your own research! #cryptopickk #bitcoin #altcoins

AXSUSDT | short opportunityOn the 1-hour timeframe, we see the bearish divergence formation.
On the 2-hour timeframe, we see a confirmed reversal pattern represented by a shooting star candle "A" with a bearish engulfing candle "B" confirmation.
4-hour timeframe, also represented by shooting star.
We can expect a downward movement with a take-profit target near the "B" support area of $120, but we still need to break through the "A" support area near $140.

Rising wedge and bearish divergence.Non technical indicators that might support this idea;
- ETH gas prices continues to be unreasonably high and ETH 2.0 won't be rolled out until 2022
- Shiba Inu might be a sign of the market overheating (We all remember what happened the last time a memecoin entered the top 10...right?)

Bearish setup for QQQBearish divergence on $QQQ daily. With decreasing volume as we hit new highs, look for a breakdown from the rising wedge. Tech is due for another pullback imo.

Ethereum Short Term Sell IdeaD1 - Price has reached a strong resistance zone.
Potential bearish divergence.
H1 - Bearish divergence.
Lower lows.
Price has broken below the bottom of the range.
Currently it looks like a pullback is happening.
Until the strong resistance zone holds I expect short term bearish moves to happen here.
