Bearishdivergence

CADJPY Sell Idea Inside A RangeH4 - Price is bouncing lower from the top of the range.
Bearish divergence, uptrend line breakout.
Until the top of this range holds my view remains bearish here.


Multiple bearish signalsYou see 3 different signals from MACD and RSI
What do you think will happen?

Tesla Bearish 3 drives. Sell off Incoming?Potential 3 bearish 3 Drive pattern with massive amounts of bearish divergence.

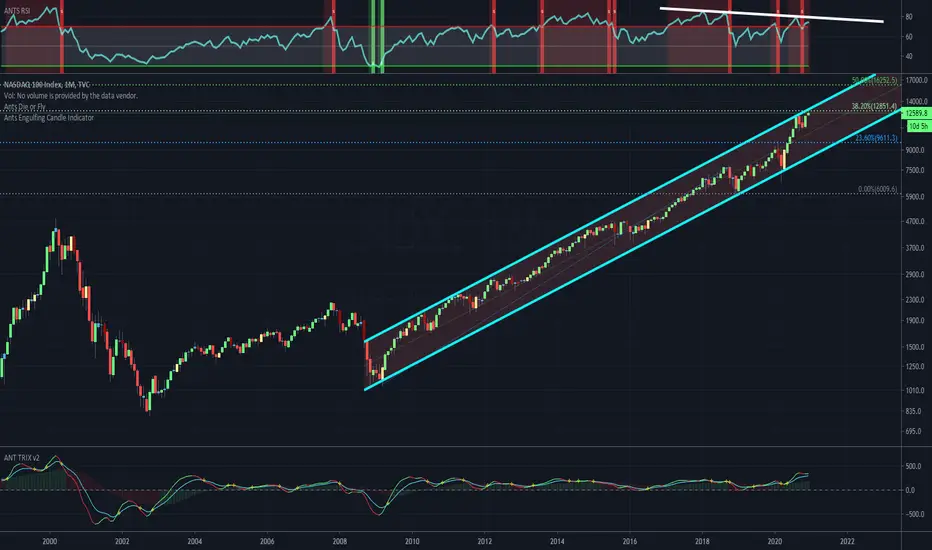
Analysis on Nifty (Distribution Phase)Wait and watch
guys check in chat Indian market bse, nse group I given buy signal
13880 - 14080 solid up move with just 40 pts SL
sell above 14050 keep strict SL 50 pts
target 13800 (250pts)

SHORT ETHExaggerated bearish divergence on the hourly for Ethereum. Also a double top, thinking about taking profits at 700$.
Quick scalp.
Not investment advice.

Double Bearish Divergence for Bitcoin?Notice how the price of Bitcoin has created higher highs but the KST & RSI are displaying lower lows, despite the deviation on the RSI there's always a rejection back into what is forming into a descending triangle
The pattern could always play out bullishly, only time will tell.

Btc/usdYESSSS... I know I’ve been talking about these bearish divergence’s for last few days, but I still believe it’s in our short term future. I re-evaluated what I was seeing on a smaller time frame (4 hour) and I think this is the most logical BTD scenario. With BTC this thing could continue up to $30K easy though so I wouldn’t recommend shorting. I would Just look to add more spot near these levels. Good luck ya’ll!

To $617 - Short after earnings (Weekly chart)BLK has moved nicely in the FIB channel since 2008. It is now over-extended and filling in the triangle on the weekly chart.
I expect the stock to consolidate for few more weeks until earnings, and we see the decline right after earnings in Jan.
Side note: A Bearish divergence is forming on daily chart view as well.
Price target: $617-653 (by March 2021)

Btc/usd Alright so before you get excited and go all in, please look at the indicators. Bearish divergence (potential) on the daily, volume steadily dropping, rsi looks cooked. I think the chances of that drop to 20k are higher then ever. Be careful y’all and as always, good luck!

S&P500 has been bearish divergent for a monthIn the last one month, the ES1! (S&P500 futures) have been obviously divergent and continues to be so.
We have seen this before in recent times, particularly before COVID-19 struck the markets.
Although divergent, the market does what the market wants, and this can hold out for a very long time. It just leaves us with a warning that at some point, a trigger could, and would, set the ball rolling down into an avalanche.
With the seasonally thin trading volumes this week or so, perhaps expect the first week of 2021 to see some proper resolution of this bearish divergence.


$NDX -- Still within long term channelLong term channel + bearish RSI divergence still intact. $QQQ $NDX $NQ_F
CADCHF Short Term Sell Idea Inside A Bearish ChannelH4 - Price has bounced from the top of a bearish channel. Bearish divergence.
Price still has room lower towards the bottom of this channel.
H1 - Bearish trend pattern.
Currently it looks like a pullback is happening.
Until the strong resistance zone holds I expect the price to continue lower further in the short term.

BTC is going to retraceWe have had a great bull run from the last bullish divergence around 19650 (blue arrows). Now we have a lot of confirmed bearish divergences (violet arrows) as well as descending volume. Therefore I closed my long since 23600 and expect a retrace to 0.382 fibonacci level around 20K which is also the last ATH.
I'm also watching some alts right now, BTC dumping would be a sign for a up coming alt season.
Note : if you like this content, don't forget to give it a like and follow me for upcoming analysis.

Btc/usd bearish short termAs I mentioned before, there is a huge bearish divergence forming on the 4H and we are overdue for a pullback.. This thing may have some more upside (up to 25K or so), but eventually the pull back will happen. Basing this off of our last pull back, I’d expect something like this to happen. Maybe a more extreme second bounce where we can form a bullish divergence. Either way, every dip is a buying opportunity right now. So take advantage of it! I’m currently taking it easy on trades until this happens. Good luck y’all!

TSLA BEARISH HANGING MAN WITH VOLUMEI see a potential reversal coming. A few factors. Hangman candle stick with bearish volume, also is consolidating at the 1.618 extension plus bearish divergence on the rsi.

Btc bearish divergence Unpopular opinion of the day. Bitcoin is forming (unconfirmed) a pretty monster bear div on the 4 hour. Wouldn’t be surprised to see a drop back to previous support near high 19s low 20s... in my opinion a drop there followed by accumulation would lead to a nice alt pop. Good luck y’all!

BTC bearish divergence ?Hi, I'm just starting to understand technical analysis so note that I'm just an enthusiast.
What do you think about this bearish divergence? (pink lines)
Price makes higer highs while the oscilator (macd) shows volume going down.
I interpret this as an bearish divergence. (let me know if I'm wrong please)
I know evryone wants to go to the moon but I think it might be better for the rest of the bullrun
if we saw a solid retracement. I think the move up or down would happen 13 or 14 nov.
Cheers!

NZDCAD Sell Idea Based On Multi-timeframe AnalysisW1 - Price is bouncing lower from the strong resistance zone formed by the 61.8% fibonacci expansion level of the first wave.
Bearish divergence.
H4 - After the first move down currently it looks like a correction is happening in the form of a range.
Until the key resistance zone formed the top of the range and the 0.91 psychological level holds my view remains bearish here.

KEY - Head and Shoulders Potential Move -ve 38% I own this stock, and I'd prefer not to sell, I have to accept that price can move on technicals if there is a catalyst. Could be some tax-loss harvesting, vaccine troubles, insert reason here. RSI showing bearish divergence. Would prefer that the neckline is tested in the next month or so, at 20, which presents a good buy price to add, of course with the yield climbing as the stock goes down and if it goes down, anywhere between 18-22 is a sweet spot for my account as long as price does not collapse and the fundamentals remain decent. If the neckline fails to protect this stock can go all the way down to 15 and change which would represent a measured move to complete the head and shoulders pattern, and something bad happening (excuse). Also earnings report in February can potentially cause some volatility here.
I will have to look at other midstream companies to determine if this is an outside case for the industry. If it is systemic, then I might be seeing something similar with other names, ENB and PPL. Oil and Gas have done quite well in the last month and a half, so if the trend continues this will only be a pattern that does not manifest most likely.

Possible Trend Continuation for USDCHFBearish hidden divergence spotted and the price didn't crossed the resistance area (green rectangle), by which in my prediction are signs of a possible price movement downwards. Just wait for the price to reverse before having long positions.
