Is Bitcoin trading in a giant Ascending Triangle?Notice a previous example of an ascending triangle that happened recently with Bitcoin in Green.
On the KST there is a bearish divergence & a noticeable descending triangle pattern forming.
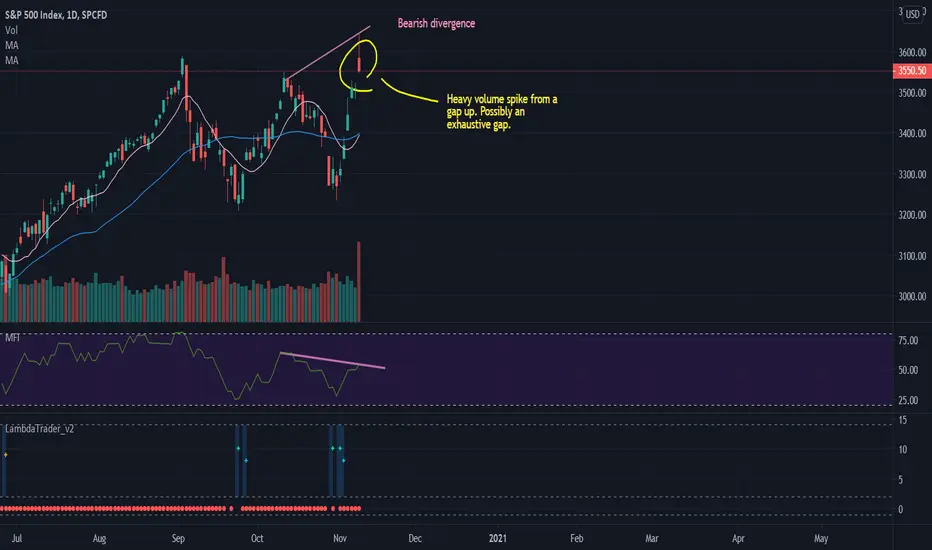
Bearishdivergence

$FVRR -- SHORTVery clearly a megaphone top with a sizeable bearish divergence on the RSI supporting the megaphone pattern, looks like a short to me!

BTCUSD: A Potential FadeReasons to consider getting out of short risk exposure if the highlighted area fails:
Bearish Divergence
Break of Structural Gap
Overextended state
These reasons might trigger some traders to short or sell this pair; however, in terms of probability, the market still favours bullish bias, evidenced by the context to the left.
The break of the highlighted bullish structural gap area can serve as a warning for short risk exposure. If that happens and higher timeframes close below that area, that can be considered as a decent indication towards further downside for short risk exposure.
Constructive discussions are always welcome, just drop a line in the comments section.

Bull Flag breakout for TSLA.On the KST there has been a bearish cross where I've placed the blue finger icon.
On the RSI there has not been a higher high creation, possibly a bearish divergence happening here.
Notice how on the RSI it's a similar bullish flag or descending triangle to the price, but on the RSI there hasn't been a break outside the pattern.
Time will tell, see my previous post on TSLA below.

GBPUSD Short Term Sell Idea After Trend Line BreakoutH4 - Currently it looks like the bullish trend pattern has completed itself and a correction is happening.
Double top with bearish divergence.
Price still has room lower towards the key support zone.
H1 - Bearish divergence. Most recent uptrend line breakout.
Expecting the price to continue lower further after pullbacks.

Bitcoin has consolidated into descending triangle or bull flag?I will post a 5-day chart at the bottom so it's more apparent.
A bearish divergence is noticeable on the RSI, and on the KST, we have seen old resistance hold as support, but there's some weakness becoming apparent.

AUDCHF SHORTThe price is currently at a key level on the daily. I have also spotted a hidden bearish divergence on the daily + double top bearish divergence on the 4hr chart. I have taken a short position at 0.66639, looking for a continuation short after this pullback.

Ascending Triangle fake-out?It appears as though Bitcoin has broken out of an Ascending Triangle to the upside, but was quickly rejected back into the pattern forming support on the upward blue sloping line of the Ascending Triangle.
Maybe a fake-out before moving higher, however, at the moment the blue horizontal line of the pattern is acting as resistance instead of turning into support when being back-tested.
On the RSI there's a descending triangle pattern that I mentioned in my previous post linked to this chart, the blue downward sloping line of resistance has been very consistent, the only divergence outside of the pattern coincides with the price of BTC breaking out of the ascending triangle.
On the KST there's a similar pattern, if we see Bitcoin continue to rise & there's another rejection on the RSI & KST at the blue downward sloping line it could get fugly, time will tell.

Darth Maul IncomingGood day Traders!
Once we lose the current weekly support, expecting some type of darth maul.
Bearish divergence on the 12H. Targeting monthly support, 0.382 retracement and 12H OB on the next drop (13.7k - 14k) and then a final push to possibly retest the same current area of resistance once wave 4 is completed.
Volume has also been decreasing on these last couple of legs up.

EURUSD SHORTLooking for a continuation short. I believe a hidden bearish divergence has formed on the hourly. The price has pulled back to the 38% level after the recent decline. I will take a short position here-ish.
Good luck !!

EURUSD: More downward movement expectedHello all,
Analysis earlier this week proved successful with two solid shorts. To be honest, there's lots of lines, patterns etc but the majority of my decisions rely on divergence, bullish and bearish. I use these to determine when to close a trade and when to enter. I really like using the 4hr chart to enter trades. Using divergence on the 30min or smaller time frames doesn't always prove as powerful or successful. Wait until you confirm divergence on a 4hr candle before entering.
Use the daily and weekly to help confirm your view and also determine how long you should stay in the trade. For example: you can find 30min bullish divergence but if there is no indication on the 4 hr, you might expect a quick correction to scalp on but the overall longer term still has more downward movement. In this case you would look for a quick exit. Apply this to all time frames and you'll see how important divergence is.

SPX Back To 3300Thats right, we are in a range. I called the range entry and now I am saying we are heading back down to 3300 details on the chart. :)
Warning TIPS ... max sus!The TIPS ETF, is the ETF for Treasury Inflation-Protected Securities (TIPS) has had a good correlation to the market indices as shown here in Orange (S&P500) and Cyan (NASDAQ).
However, in the last few weeks, particularly the last week... market indices have been on a massive bull run, with parabola. Today, the icing on the cake was the announcement of a viable vaccine by Pfizer.
Note the bearish divergence of the TIPS price in recent weeks. The last three days the divergence got ridiculously large and today is at an extreme.
What does this tell us... that either TIPSis going to rally hard, or market indices will fall hard.
No prizes for intelligent postulations based on this observations...
Caveat emptor!

bearish divergence, oversoldhas had a nice run, should slow down a bit. expecting a gap down.
keeping an eye on the trendline.

EURJPY Sell Idea After Trend Line BreakoutD1 - Potential double wave down.
Price still has room lower towards the 61.8%(122.479) Fibonacci expansion level of the first wave.
Currently, there are no signs of trend change.
H4 - Bearish trend pattern followed by double wave correction.
Bearish divergence, most recent uptrend line breakout.
Expecting further continuation lower in the short term.

Regular Bearish Divergence AND Hidden Bullish DivergenceThis is an interesting situation.
There is BOTH a Regular Bearish Divergence AND Hidden Bullish Divergence AT THE SAME TIME at the 14k mark. Since this is coming from an uptrend I suppose the bias would be the bearish scenario.
Good luck!
Peace, Love, & Crypto,
B166ER

Bitcoin short comingHey everyone, I think we are seeing a bitcoin short opportunity. Stop loss is the 137500 and the target is 12800

Bull Flag for GBR?In blue it appears as though GBR is trading in a bullish flag, but looking at the RSI there's a noticeable bearish divergence, meaning, the price continues to rise but the RSI is declining.
On the KST there's been a bearish cross where I have the blue finger icon pointing down.

Bitcoin make a fake movement!!! It's bearish movement???In this analysis, we see that Bitccoin yesterday make a up when we formed an Head Shoulder Head inverted in H1 timeframe, but that is another end becuase Bitcoin reach approximately at $13,339 USD and then, make a bg red candlestick, that mean a bearish movement, and then, we could see a possible bearish continue of the trend.
That explain in H4 timeframe in this analysis. But, that was a fake movement and Daily timeframe suggested that Bitcoin want to go back to the $12,300 USD. Also, as in H4 we see a pretty bearish divergence + price action confirmed that Bitcoin it's leading with the bearish sentiment right now before to continue up!!!
Very important is to watch the Daily timeframe, this kind of candlestick show a weakness of the bulls. So, I reccomend to right now to be with the perspective bearish. For that reason, I'm do not trade in long position yesterday and I hope a bought of the $13,200 USD with confirmation, that is my strategy what I trade. So, I'm going in favour o the bearish sentiment. I put a short order limit at $13,100 USD towards the $!2,300 USD as my take proit and my SL is $12,424 USD.
I hope that you like this analysis for you!!!
I kow that it's not easy to trade cryptocurrency by volatile and manipulation by whales. But, if you have a knowledge and a strong psycology on the supply and demand, you're have successful.

(WAVE STRATEGY) weekly htf ~ BUY LOW SELL HIGH-Yurlo
Please tap that like button if you like the chart I've posted for the trading community today. (macro bearish distribution) 👍
No this is not financial advice, just a trading idea that may or may not play out.
Strategy: wave x - wave e (wave 1 - 5) ~ macro weekly time frame (htf) ~ sell signal / bearish divergence signal
0-2 = 66 bars (weekly candles)
2-4 = 66 bars (weekly candles)
Wave x, wave a, wave b, wave c, wave d, wave d
1,2,3,4,5
Wave d (4) - wave d (5) = $8800 (189%)
Road to ATH's & price discovery 2021/2022?

WEAK FUNDAMENTALS ABOVE $13,000 (whales filling shorts) $BTC-Yurlo
First of all, please SMASH that like button 👍
Above $13,000 is a demand zone for whales filling shorts (wicks pushing price back down, lower highs)
The fundamentals/structural integrity above $13,000 is weak, a correction is overdue.
EMA's untouched:
20 / almost tapped ~ $12750
50 / untapped ~ $12264
100 / untapped ~ $11819
200 / untapped ~ $11426
(possible s/r flip zone and fibonacci level 0.5)
2 wick validation points on the downtrend
(3 makes a trend)
(s/r flip zone) / $13,500 / fibonacci level 0.618
(s/r flip zone) / $11,500 / fibonacci level 0.5
IMO (In my opinion, and no this is not financial advice. just my thoughts made into TA on my views towards Bitcoin)

Link taking a break?Link showing a bearish divergence signal on our new D+ v2.
This could mean
1) trend turns downwards
2) trend flattens
...either way, the bull trend might be over...for now.
Only time will tell to see what happens next.

Short Position: Price Action + Bearish divergence in RSIIn this analysis, we see that the price action show a bearihs reversal with the RSI bearish divergene in H1 and H4 timeframe. So, We could have this short posiiton. But the only that we would need to pending is this broken line, becuase if this bearish divergnece don't make a Bicoin go back to the $12,400 USD, we could see that Bitocin could to form a possible little-re-accumulation forming an simetric triangle. That could be a possible scenario that we would need to be prepare.
In H4 timeframe we see this situation that Bitcoin it's goes to down.
So, in the past analysis we see a fake signal, we see a bearhs divergence when Bitocin it's around of $11,700 USD, but the price action was not confirmed, but these is an example. Look: if we see a bearish divergence, that is the first, but the second point and the most important is to see a bearihs candlestick group as libelula doji, envolving bearish candlestick, bearihs hammer, or some kind of bearihs candlestick. That is important, the price action is the market languages. Don't recalll it. But, we see in h1 that Bitcoin turn bearish bcuase in the past days we see this big bearish candlestick in H1timeframe, and then, we see the confirmation to entry in short with two perspective. Bearish to the $12,400 USD for this support key of $12,400 USD or any formation of chartist pattern as I show it.
So, I entry in short!!!
