Bearishdivergence

EURUSD - TRADE PLANDAILY:
✅ MAJOR DIVERGENCE
✅ AT SUPPLY (1.185-1.19)
🔴 SWING HIGH (pivot not confirmed)
(NO SHORT TRADE YET)
🟠 TREND: UP
4HR:
✅ LOWER HIGH / DOUBLE TOP
✅ SWING: DOWN
🟠 TREND: Indecision, lower highs,
but no lower low yet.
1HR:
🤚🏻 Wait for impulsive break
and close below 1.818 and
sell on pullback

GBPJPY ShortGBPJPY is showing large amounts of bearish divergence at historical resistances looking to come and test some supports

Descending Channel for GBR?GBR has seen a parabolic 3000% gain & more since 2018, very odd considering Gold is only up approximately 70% in a similar time frame. I guess gold miners & gold don't necessarily correlate 100%.
GBR appears to be trading in a descending channel, and on the RSI there's a noticeable double top / Head & Shoulders, where I have placed the blue human icon represents the head of the H&S. The red arrow on the RSI is possibly a double top.
On a long term chart it appears as though the RSI has topped multiple times but the price has continued to rise, thus creating a bearish divergence.

EURJPY ForecastD1 - Price has reached a key resistance zone formed by the 61.8% (125.475) fibonacci expansion level of the first wave and the 125 psychological area. Bearish divergence.
H4 - Price is currently moving inside a wedge pattern. Bearish divergence.
Expecting further continuation lower after a valid breakout below this wedge pattern.

GBP HKD Short term trade opportunityHi everyone, I am way too tired to make a full blog post, but I see some opportunities in this pair. Right now I think it is going down, but I can see that in the longterm it is heading back up, and I will make the full post once I feel well enough to give you all an accurate reading, but for now take this small setup.
Macd on the 15 minute has crossed and appears to be moving towards the negative.
15 minute RSI is bearishly diverging.
Target 1: 10.11016
Stop loss:10.14427
TLDR, we have finished a wave one of a greater move upwards, and I am expecting a deep wave 2 retracement. Around the golden pocket, which is 0.618-0.65, but maybe even to the 0.8. 0.8 is too aggressive for myself, but aim for it if you want. Another target is the base channel of the larger cycle, but I'll talk about it when I make a full post.
Anyway, I'll hopefully talk to you guys sometime tomorrow.

Oil ForecastD1 - Price reached a key resistance zone formed by the 161.8% (38.16) fibonacci expansion level of the first wave and the 61.8% (45.28) fibonacci expansion level of the second wave. Bearish divergence.
Expecting corrections to happen now.
H4 - Bearish trend pattern followed by a double wave correction.
Expecting the price to continue lower further.

Bitcoin BTC formed an ascending broadening wedge (bearish)Bitcoin formed an ascending broadening wedge ( bearish reversal pattern). I've noticed the bearish divergence on the 4hour timeframe but also a bullish divergence right after. The bullish divergence could indicate that BTC could make the last push to 11100-11200-11250 levels to test. I'm curious if $BTC could manage to make a Higher Low. If not this could change the trend (short-term) which is healthy. Testing previous resistances as support and to create stronger support.
Breaking 10850 will make me more confident in a short position. Have to keep in mind we have a gap below at 9645 too.
Bitcoin Trading Club is created to share valuable trading ideas, charts and to support each other with our trades (NFA).

Gas future recovery lost all momentum, 200 SMA resistance?Hello Traders!
The price of Gasoline Futures has recently returned to its normal range but the momentum of its recovery seems to be completely used up. The 50 SMA may have recently crossed over the 100 SMA, but both the MACD as well as the RSI look rather pessimistic, both indicating bearish divergence. I would be very surprised if the price crossed over the 200 SMA, which has acted as resistance in the past, but let's better wait for the next few candles before we trade on weak signals.
VF Investment cannot be held responsible for any financial damages suffered from following our well-funded but personal opinions and trading ideas.
Please, maintain proper position sizing and risk management!

Classic Bearish Divergence on Ethereum?Wow, do I need to say anything else?
The bullish price action in Ethereum is warranted given the Macro environment, but if you remove emotion from the chart there is clearly a bearish divergence noticeable on this log scale chart.
There's merit for an Ascending Channel which is outlined in GREEN, time will tell.

NZDCAD ForecastD1 - The price which is moving higher has reached a key resistance zone formed by the 100% fibonacci expansion level of the first wave at 0.89197 and 0.89 psychological level, bearish divergence.
H4 - Bearish divergence.
H1 - Bearish divergence followed by a bearish trend pattern in the form of three lower highs, lower lows.
Expecting further continuation lower after pullbacks.


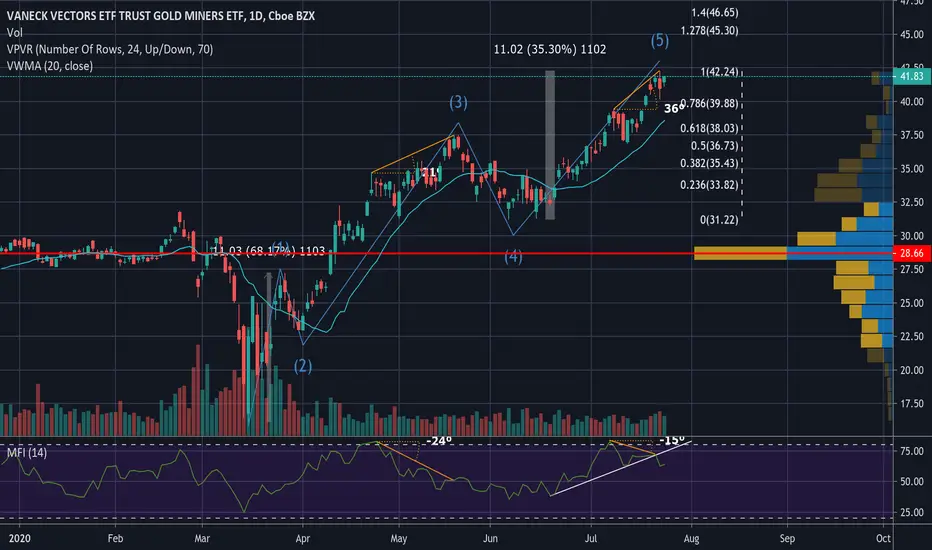
GDX needs to pullback and resetGDX has been on a good run and is showing signs of topping out. Specifically bearish divergence is clear on MFI (money flow index and we see a clear 5 wave pattern in the context of Elliot Wave analysis with wave 5 almost exactly equal to wave 1 which is a component of wave analysis. For those who want to short you must establish your own stop loss and a reasonable first target is the low 38 regions based on a .618 retracement of the 5th wave and this also correlates to where the volume weighted moving average is. I would also not be surprised to see a corrective ABC pattern play out.
EUR/NZD Short 300 pips?Good day, snipers. Here in EUR/NZD , I am looking for Swing Short since price is in a descending channel and also at a minor area of resistance . Price also seems to be on overbought levels on RSI and a bearish divergence . Big SL but greater TP level at structure. Signal with Entry, adjusted SL and TP will be sent to students.
Follow me on tradingview for more ideas and sniper entries. If you liked this idea please click that thumb's up.
Ideas posted are not financial advise, but merely just to give insights and education for traders.
Past performances do not determine future gains.
As sniper traders, we tread carefully, then we take shots immediately.
Join the discussion down below.

Verizon Communications VZ bearish outlookEarnings were reported today and beat the estimates so keep that in mind. The technicals though look bearish IMO. We have hit a major trend line which so far hasn't been broken and looking at the size of the wick we hit a lot of selling pressure. Also we have created a Bearish Bat pattern which was completed when we touched the trend line. Would have been the perfect entry but still see plenty of downside potential. Also worth noting we have some bearish divergence on the 4hr RSI.
Playing the Bearish Bat my prices targets are:
Target 1 - $55.73
Target 2 - $55.17
Target 3 - $54.60
Good luck traders

Sterling Pound is weakness agains the US DollarThe influenced by Sterling Pound it's moving for US Dollar, this par is so negotiate, so we ha a bearish Gartley that we could see a possible correction of the price in some days.
Now, looking in Daily timeframe we see a formation of bearish rising wedge, I can't updated my technical analysis yesterday at night because I am sleeping so early, but now, we have this situation and the probability to see a Sterling Pound is so look bearish.
And in H1 timeframe, we see the same sitaution that Sterling is so weakness!!!
***And also, using MACD and RSI show a bearish divergence in both timeframe in H1 and H4 timeframe.

GBPJPY Short|Bearish Divergence|Range Support|.618 FibonacciEvening Traders,
Today’s Analysis – GBPJPY- at a pivot point on the chart, price is likely to impulse down if dynamic resistance is respected.
Points to consider,
- Macro trend bearish
- Resistance confluence
- Oscillators diverging
- Volume below average
- Range support target
GBPJPY’s macro trend has been putting in consecutive lower highs – this gives us a bearish bias on the overall market.
Price is currently testing dynamic resistance; this area has multiple technical confluences, the .618 Fibonacci and market structure – putting more significance on the level.
Oscillators are both diverging from price validating a bearish divergence. Price respecting the .618 Fibonacci will keep the divergences at play.
volume profile overall is below average, a respect or break of the dynamic resistance will lead to a notable volume influx.
Overall, in my opinion, range support is the immediate target if technical levels are respected. A short is valid with defined risk.
Price breaking above dynamic resistance will negate the trade.
What are your thoughts?
Please leave a like and comment,
And remember,
“If you can’t take a small loss, sooner or later you will take the mother of all losses.” – Ed Seykota
