Dax ForecastW1 - Bearish divergence, uptrend line breakout.
D1 - Bearish convergence, uptrend line breakout, In addition to this, based on the Heikin Ashi candles we can see that currently we have strong bearish bodies in downward moving market conditions so it basically reflects a bearish environment.
H4 - On the H4 chart too based on the Heikin Ashi candles we can see that currently we have strong bearish bodies in downward moving market conditions so it basically reflects a bearish environment here as well.
We also have two sell zones that has formed and the price has currently reached the first sell zone. Until these two sell zones hold my view remains bearish here.
Bearishdivergence


EURAUD EA over extended and showing bearish divergence. Watching for break out. AUD interest rate news this evening could accelerate the move!

#Gold Short Setup#Gold printing bearish diversion on weekly, I was waiting on this weekly close but the price is already moving way too fast, this is the short setup i will be entering in if i get the entry
my original idea for GOLD -

Litecoin Short Term ForecastD1 - Price reached a very strong resistance zone formed by the 100% fibonacci expansion level of the first wave we have and an important resistance level. Bearish divergence.
H4 - Price is moving inside a bearish channel, The top of this channel coincides with the daily resistance zone and also we have the 80 psychological area around the same zone. Price has bounced from this important resistance zone and is moving lower.
H1 - Double wave up, the 100% fibonacci expansion of the first wave we have coincides with the important resistance zone. We had a bearish divergence and an uptrend line breakout.
Until this resistance zone holds my short term view remains bearish here.

AUDCHF Short Term ForecastH4 - Bearish divergence, triangle pattern breakout.
M15 - Bearish divergence, uptrend line breakout.
Until the H4 triangle pattern breakout holds, my short term view remains bearish here.

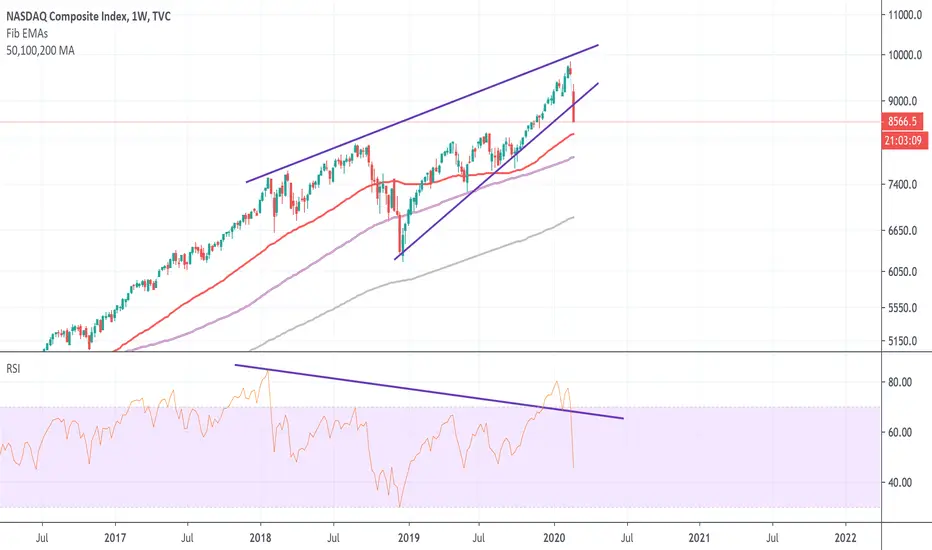
Nasdaq Rising WedgeRising wedge w bearish divergence, this can be attributed to the drop that has occurred in the past weeks. Fear may be intimidating when looking for an entry into a market like this but history has shown consistent returns for the nasdaq composite and price will most likely produce a reversal at one of this MA's, EMA's. Unless the dip can be associated with the RISE of cryptocurrency which is my personal bias opinion.
One DAY one BURST : Good bye Vuitton.Hello guys, as you can see since Yesterday CaC 40 is my new victim.
What is MC ?
MC/LVMH : is a French multinational luxury goods conglomerate headquartered in Paris. The company was formed in 1987 under the merger of fashion house Louis Vuitton with Moët Hennessy, a company formed after the 1971 merger between the champagne producer Moët & Chandon and Hennessy, the cognac manufacturer.
LVMH has take the lead of the luxury market and is showing huge returns.
My view :
Much actions on the CaC 40 and more generally in Global Stock market are showing signs of parabolic growth. Everyday i select an action where i see sign of weakness in the parabolic structure. This type of trade is highly speculative but offers huge returns.
Technicals :
The 5rd wave is extended to 4.618 of the 1, that's show over price territory.
RSI and MFI are both overbought and divergent.
In Hyperwave theory the parabolic structure looks complete.
Type of Market : Irrational (Bubble).
Type of trade : Reversal.
Stop loss : 416.
I hope you are enjoying this post, please like, share and comment to show me your support.
Let me know in the comment section which chart (Stock/Forex/Crypto) you would see me to analyse.
DISCLAIMER : I'm not a financial advisor. You trade at your own risk. I can't be responsible for your losses.

Gold needs to dip and resetCongrats to anyone who has been long gold and if you have now is the time to take profit. Overall I am bullish on the metal but its plain to see it needs to dip a bit and reset a base from which to continue up further. Three arrows on this chart point to a pair of highs and a low in b/w them that combined we can project Fibonacci timing points from that have served relatively well thus far as far as trend reversals are concerned and we can see that we are upon a 2.382 extension that will probably mark a dip that is already potentially happening. I would like to see pullback hold the upper 140s from which we can go long again.

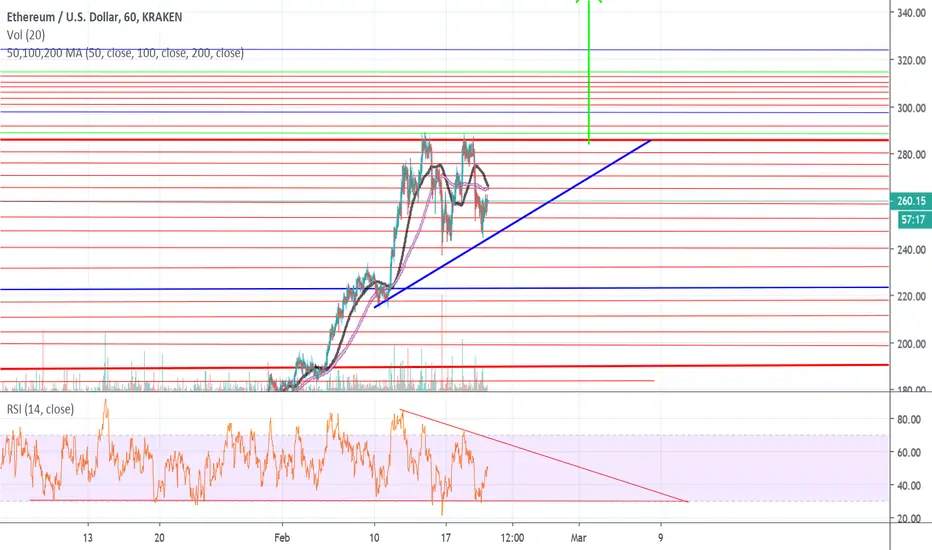
Is Ethereum trading in a Ascending Triangle?Key Takeaways
The trendlines of a triangle need to run along at least two swing highs and two swing lows.
Ascending triangles are considered a continuation pattern, as the price will typically breakout of the triangle in the price direction prevailing before the triangle. Although, this won't always occur. A breakout in any direction is noteworthy.
A long trade is taken if the price breaks above the top of the pattern.
A short trade is taken if the price breaks below the lower trendline.
A stop loss is typically placed just outside the pattern on the opposite side from the breakout.
A profit target is calculated by taking the height of the triangle, at its thickest point, and adding or subtracting that to/from the breakout point.
The RSI is showing either a descending triangle or a bull flag, it could be a divergence & play out bearishly, only time will tell.
Bearish divergences signify potential downtrends when prices rally to a new high while the oscillator refuses to reach a new peak. In this situation, bulls are losing their grip on the market, prices are rising only as a result of inertia, and the bears are ready to take control again.
EURJPY Short Term ForecastH4 - Downtrend line breakout, bullish convergence.
M15 - Bullish trend pattern, potential bearish divergence.
We may now look for pullbacks and then possible continuation higher.

ES / S&P500 to Retrace from virus effects...Technically, the S&P500 (and its corresponding /ES futures) are bearishly divergent iin the MACD in fractal time frames of 1h, 4h, and evenn Daily charts. Shown here is the 4h chart of /ES and it gapped down in Asian opening hours after a lond weekend holiday. This appears to be a Gap and Run scenario, at least at this point of time.
This move appears to have been triggered by Apple's warning of missing sales.
The retracement is firmed upon breaking down of 3370, a bounce off 3350, and looking for support bout 3290.
The DJI and NASDAQ should similarly follow.
Heads up...

ZCASH in a rising wedge with heavy bearish divergenceZcash has a lot, and i mean A LOT of confluence right now. I feel very weird about shorting an altcoin right now but when the TA gods speak, i listen.
Reasons to short:
- Rising wedge pattern
- Quadruple bearish divergence on the rsi
- Quadruple bearish divergence on macd
- Bearish divergence on the daily
- Bearish divergence on the 1 hour
- Strong weekly resistance
This is not financial advice, please do your own research before opening a position
HEY EVERYONE! if you liked the idea please give me a like :)
if you want to see more ideas, chuck me a follow, a lot more ideas to come :)
THANKS FOR YOUR SUPPORT

Gold Short Term AnalysisD1 - Bearish divergence.
H4 - Bearish hidden divergence.
H1 - Bearish convergence, until the invalidation level at 1577 holds my short term view remains bearish here.
If the price moves higher, breaks and holds above this invalidation level then this bearish view will be invalidated.

Time for a Crypto Pullback- LTC and othersFor those of you who don't know the cup and handle pattern (C&H) I hope this post changes that. With LTC and several other cryptos I've noticed this pattern in past weeks. In order to from a valid C&H we need to see a rounded bottom to the cup (no V bottoms or excessive chop in the base) followed by a handle that retraces roughly 30-70% of the cup to be valid. In this case we made a nearly 50% retracement. The projected price target is taken by measuring the depth of the cup and projecting that delta from the bottom of the handle (this is done with the shaded vertical rectangles in my chart). We can see that the expected bullish price movement has basically played out and Fibonacci based pivots (Resistance 2) has played out near perfectly.
Its entirely plausible that we move up a little more but a pullback at this point would be healthy and set us up for very bullish price action going forward based on Elliot Wave projections beyond the scope of this post. Also note we are seeing stark bearish MFI divergence shown by orange trendlines. As far as retracement from a current level ideally we may dip below the volume weighted moving average in blue while holding above the pivot point (hard to see in graph) in the low 60s. As always anything can happen, use this post as input, and make your own decisions. Thanks for reading. Hit me up w/ any questions and comments you have.

ETH/BTC - short term pullbackETH/BTC has broken out of it's long term downtrend and made an impressive move over the last days but now it looks like a great place to take some profit and buy back in lower.
The reason for that is:
1. ETH/BTC shot right through the daily 200 MA and hasn't had a proper correction since. Now it's very close to the daily 314 MA and will likely bounce off it and retest prior levels.
2. It's at the top of the current channel
3. Daily StochRSI is very high and likely to cycle down soon
4. Significant bearish divergence on the hourly timeframe which is also visible on the ETH/USD pair (see comment below for chart)
Long term it looks bullish to me so consider this a short term setup.
