Is the WDFC earnings pop sustainable?WDFC, the manufacturer of WD-40 ( sprayable graphite) had a great earnings beat and
a celebratory pop of 5%. My question is whether it can continue? On the 15 minute chart
I have added four indicators and what they might indicate:
(1) the Lorentzian Machine Learning Alert System with default settings with a few removed which shows the initial buy signal of July 6th. No sell signal has been printed since earnings.
(2) the MTF RSI indicator of Chris Moody showing the RSIs one hour in black and 15-minutes
in blue presently topped out and the lower TF in blue decreasing showing a bearish divergence.
(3) The MACD shows K / D lines rising in parallel but very extended above the zero-line showing
very high amplitude.
(4) The volume indicator showing that volume did not get a relative spike with the post-earnings
price pop.
Overall, with heavy consideration of lack of volume with the price pop and the bearish
divergence on the RSI, I will not take a long trade on this post-earnings WDFC. In fact, if
I can find a good entry on a 3 or 5-minute chart, I will take a short trade. I price rise
with a good volume spike might potentially convince me otherwise.
Bearishdivergence

GBP/JPY BEARISH PRICE ACTIONIf you like, you can take this swing short trade to the 4H Demand zone shown in the chart. the price is showing LL and MACD is showing bearish divergence.
Have a safe trade to all!

NZDCAD | Hidden Bearish Divergence | BearishAccording to my analysis, the New Zealand dollar against the Canadian dollar (NZDCAD) is expected to experience a bearish trend. This assessment is based on the presence of a Hidden Bearish Divergence on the 1-hour timeframe, which indicates a potential reversal zone.
A Hidden Bearish Divergence occurs when the price of an asset forms higher highs, but the corresponding indicator, in this case, NZDCAD, shows lower highs. This discrepancy suggests a potential shift in momentum and often signals an upcoming reversal to the downside.
Therefore, considering the presence of Hidden Bearish Divergence on the 1-hour chart of NZDCAD, it suggests that the NZD may weaken against the CAD, indicating a bearish outlook for NZDCAD. However, it's important to remember that technical analysis is not infallible, and other factors such as fundamental analysis and market conditions should also be considered before making any trading decisions.

EURUSD, stuck in the middle In this video I go over EURUSD from the Monthly, down to the 4hr.
Monthly is Bearish
Weekly is Bullish but with my favorite Bearish Div Setup.
Daily has seen a HH-LL-LH-LL ABCD type formation, all this after my fav setup (Div w/Kijun break) on the weekly... So cautiously Bearish.
4hr shows some downside targets using Ichi Wave Theory, should this divergence play out.
As always, good luck, have fun, practice solid risk managment.
PS... Last 4hr target is 1.067... not the 1.076 my lysdexic ass stated :wink:

BTC Bearish ABCD Setting up to Drop Down Towards $16,741Recently, BTC has been showing promise to begin a macro breakout and run up to over $100,000, but even more recently on the lower timeframes, it's been giving off some bearish signs at a Bearish ABCD PCZ that we could actually go back down to around $16.75k from here before actually beginning the true run up towards the 6 digits.
We have made three Consecutive Lower Highs on the RSI and are likely setting up for a Double Bearish Divergence on the MACD; if we come back down to test the levels of 16.7k, that would be the secondary test of the 1.618 Butterfly PCZ to which we could then more confidentially rise from.

Commonwealth Bank of Australia is Setting Up to Decline Over 77%CBA, Australia's Biggest Bank, is currently breaking down below a trend line after previously confirming Bearish Divergence on the monthly MACD and RSI, and the nearest strong support level is all the way down at around the levels of $40–$22.
This may be the ultimate sign that we are about to see a significant greater move down of the global financial sectors sooner rather than later.

NVDA: Bearish Divergence at PCZ of Bearish Shark: Selling CallsWe have some Bearish Divergence on NVDA after reaching the PCZ of a 4 Hour Bearish Shark; if we get some serious followthrough I could see it going down to $400 or even all the way down to about $350
I will be selling multi-week calls around the strike of $425 and $435

GBPJPYGBPJPY along with all xxxjpy pair is been on huge bullish trend. But currently GBPJPY has created mature bearish divergence. Will the bearish divergence play its role and divert the bullish trajectory to some corrective structure.

A reverse Adam-Eve idea PLTR has risen with the earnings and AI mania. It is time for a correction for further upside. The price action has started to develop a reverse Adam-Eve pattern. RSI and OBV show some bearish divergence as well. We may see a correction to 0.236 or 0.382 fib retracement levels.
Disclaimer – WhaleGambit. Please be reminded – you alone are responsible for your trading – both gains and losses. There is a very high degree of risk involved in trading. The technical analysis , like all indicators, strategies, columns, articles and other features accessible on/though this site is for informational purposes only and should not be construed as investment advice by you. Your use of the technical analysis , as would also your use of all mentioned indicators, strategies, columns, articles and all other features, is entirely at your own risk and it is your sole responsibility to evaluate the accuracy, completeness and usefulness (including suitability) of the information. You should assess the risk of any trade with your financial adviser and make your own independent decision(s) regarding any tradable products which may be the subject matter of the technical analysis or any of the said indicators, strategies, columns, articles and all other features.

AUDCAD Short Term Sell IdeaH4 - Bearish convergence.
No opposite signs.
H1 - Bearish trend pattern.
Until the two strong resistance zones hold I expect the price to move lower further after pullbacks.

CADJPY Resistance Breakout SetupCADJPY currency pair breakout trade on resistance side, You can also place Sell stop below resistance line or wait for breakout.

EURJPYEURJPY is been on huge bullish run and now is due for some deep correction. As the pair has created bearish divergence in 4H which is signaling for some deeper correction.

fuboTV: Double Top at the 0.382 Retrace and 200 Day SMAfuboTV right now has gapped up and hit a 38.2% Fibonacci Retrace and is now Double Topping and Bearishly Diverging on both the MACD and RSI at this level. As things currently are, I would expect the gap to eventually be filled, but overall, fundamentally looking at their financials, I think the stock goes down to the 1.272 Fibonacci extension, which would take it all the way down to around 6.18 cents.

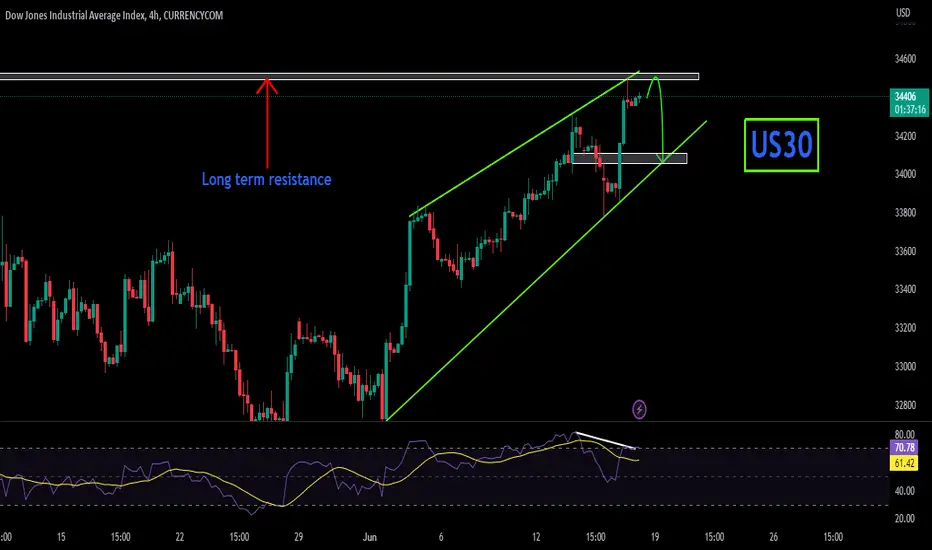
US30US30 is trading in bullish momentum and facing long term resistance and also created bearish divergence. Will the bearish divergence play its role along with resistance and push the price to downside?
ETHUSDT ASCENDING TRIANGLEI'm sorry but the target does not fit in to the chart.
As you can see, the overall situation in the crypto market is not looking very healthy,
We have here a very simple setup, we combine:
- RSI Bearish divergence.
- Uptrend with decreasing volume.
- Failure to break major resistance of 2000$.
- Bitcoin selling at less than 25000$.
And for the previous reasons, I would consider opening a short here with targets 1370$ 890$ and 285$ (high before 2020 market crash).
For entering, there is various options, you can enter now or wait for a confirmation like for example, the breakdown of the trend-line and a retest.
This trend-line is acting as a strong support so It might take a few days to see a breakout, however, this setup can be wrong, nothing is infallible, no trader wins 100% of the time so please, remember that the first thing is to protect your capital.
It's recommended to set a stop loss at 1790$.

BITCOIN MAKES CLASSIC DEAD CAT BOUNCEAs you can see in the chart, this is a very simple setup:
When we look at the big picture, we have a dead cat bounce breakout retest pattern.
As confirmation, we have a clear RSI bearish divergence and a descending triangle, which can be a good entry point.
As targets we have the clear support levels and we set an stop loss at the last swing high, so in case the price goes against the position, we protect our capital.
Sticking to ideas when proved wrong can be a very expensive mistake. Always be ready to change your mind.

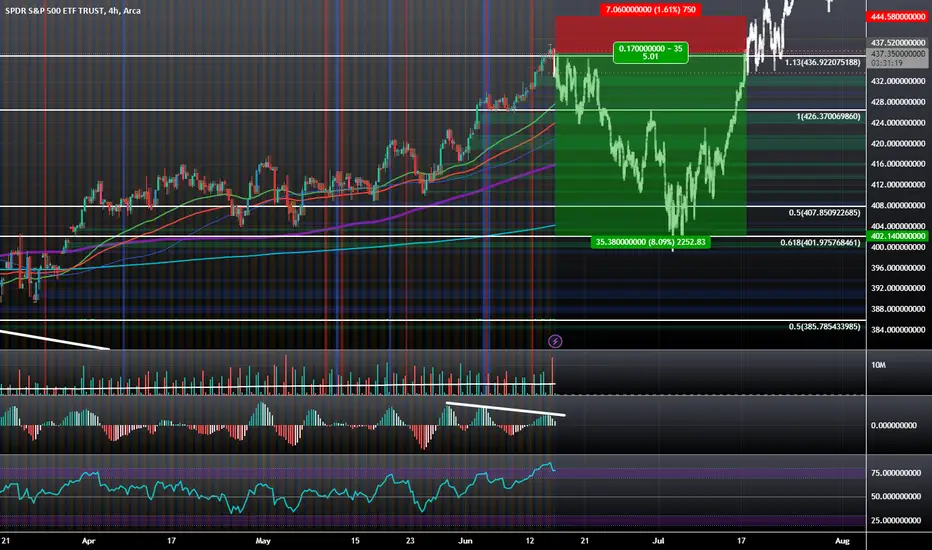
$SPY: 50%-61.8% Retrace Seems Likely Before Continuation HigherThe SPY seems likely to pull back to the levels of $420 to $400 before it can later decide whether it wants to continue the overall Bullish Trend to all-time highs. In the meantime, we are dealing with Double Bearish Divergence on the MACD, Overbought Conditions on the RSI, and a Bearish Engulfing Candle on the 4 Hour all while trading at the 1.13 Retrace of the local range it just broke out of.
AUD NZD Short Setup in 4 Hr TFOANDA:AUDNZD Price try to attempt break the 1.10339 level. but rejected every time.
Bearish Divergence occurred last 4 days that shows price lose it's momentum to move further upside.
Short Setup is good opportunity
Entry and SL is mentioned in charts.

General Motors to ChargePoint Trading at Bearish Shark PCZI think that these two stock will trade in opposite directions to each other, so I am tracking the ratio between the two stocks, and it looks like General Motors has just about hit the limit to the amount of ChargePoint shares it will be able to buy, and so I expect a decline in GM price and a Rise in ChargePoint's price from here.

Coca-Cola: Bearish Inverted Roof Top with Bearish DivergenceCoca-Cola has formed an Inverted Roof Topping Pattern and is Currently Breaking Down after Bearishly Diverging on the weekly and Bearishly Engulfing on the monthly; if things go as expected then Coca-Cola will come down to make at least a 61.8% Retrace, but I think it could go all the wa down to as low as the 0.886 as all the Defensive Plays begin to deflate.

AmerisourceBergen Corporation: Bearish AB=CD & 3 Drives PatternABC currently is Bearishly Diverging on the MACD and RSI around the 2.414-2.618 PCZ of a Bearish AB=CD where it has also developed a Bearish 3 Drives Pattern and a Bearish Shark. If we get the action I'm expecting to see from here, it will come down and break through the trend line and then continue down to the 0.886 retrace at $77 in a dramatic way.

CHFJPY Short Term Sell IdeaH4 - Bearish divergence.
Lower lows.
No opposite signs.
H1 - Bearish trend pattern.
Until the two strong resistance zones hold my short term view remains bearish here.

UK100 UK100 recently make a nice bullish impulse and seems like fail to maintain it. Currently the instrument is looking for Right shoulder. If it successfully form HnS then we are looking for 7550 followed by 7500 to downside.
