BTCUSDT Complex C - Multi Wave in an Ending DiagonalBTCUSDT made a beautiful corrective C-multi-wave pattern, which surprise terminus finished with an 5th wave leg-up that surpass the trend-line, after an ABCDE triangle. In the Wyckoff Method narrative we can call it an upthrust movement in phase c of a distribution. About the wave count, the entire triangle is an contracting ending diagonal of a corrective wave C, in which we can see a multiple pattern that confused the prediction. After the "thrust" the price action should return to the break point, characterizing a "false break". It's common in C-legs, when the triangle occurs, that it's exceed the break-point. In this case, price reached the weekly supply, interacting with AVWAP from ATH. Now the bears are slowly take control. I'm expecting 18% drawdown of a downtrend till the wave 3 of a potential impulsive downward.
Bearishdivergence

NASDAQ - Looking To Sell Pullbacks In The Short TermH4 - Price is bouncing lower from a key resistance zone.
Bearish divergence.
Most recent uptrend line breakout.
H1 - Bearish convergence.
Currently it looks like a pullback is happening.
Until the key resistance zone holds I expect the price to move lower further after pullbacks.

BTC develop 3 month bearish divergence Hello Birdies,
Long time no see busy in daily life. Hope you guys are printing money.
BTC has developed a 3 month bearish RSI divergence and Price Action is also not looking good.
If the lower RSI boundary break we will see a very sharp crash IMO to somewhere 21k to 21.8k

Silver Short Term Sell IdeaH4 - Price has reached a key resistance zone.
Bearish divergence.
No opposite signs.
H1 - Bearish divergence.
Until the key resistance zone holds my short term view remains bearish here.
If the price breaks below the low at 23.561 we may then consider it as a validation for this bearish view.

BTCUSD: 0.618 Retrace Likely Before Continuation HigherBitcoin has Formed a Peak during after a 5th wave while trading at the top of a Broadening Consolidation Structure and showing Bearish Divergences. If things were to go as one would expect, I would think BTC should have around a 20% pullback to about 23k which would take us back to the POC and would be a 61.8% Retrace of the Local Low to High. If we can then begin a rally from the 61.8% retrace, it will then be a Potential Partial Decline which would almost guarantee that BTC Bullishly Breaks out of the Broadening Pattern upon making contact with the upper trend line. If this were to happen I would say BTC could very easily see 40k but I also think that it's very likely that this will be the pivotal point that begins Bitcoin's greater rally up to $60,000 then $146,387 as can be projected via the volatility trends that can be seen in this chart below:

USOIL: Bearish Divergence at Bearish AB=CD and Gartley PCZThere is Bearish Divergence on USOIL at the PCZ of a Bearish AB=CD and Bearish Gartley as it potentially backtests previous support as resistance

GBPNZD Short Term Sell IdeaH4 - Price has reached a strong resistance zone.
Bearish divergence.
H1 - Bearish hidden divergence followed by continuing bearish divergence.
Until the strong resistance zone holds my short term view remains bearish here.

GBP/USD Rising Wedge with RSI Bearish Divergence on 4HGBP/USD Rising Wedge with RSI Bearish Divergence on 4H Time Frame

Bearish divergence on the daily. I hate to p*ss on the parade, but look at the bearish divergence forming on the RSI and the low volume! This looks like a fake out of the descending trending line and i expect this to be back to the lows very soon.

AUDCHF Short Term Sell IdeaH4 - Price is bouncing lower from a strong resistance zone.
Bearish hidden divergence followed by continuing divergence.
H1 - Bearish divergence.
No opposite signs.
Until the strong resistance zone holds my short term view remains bearish here.

BTC/USD 3-Day Chart - Bitcoin could surprise everyone. BTCUSD INDEX 3-Day chart the first key level resistance is $ 25.3k, was Bitcoin's first test. Our breakthrough candle was on March 17, we are trying to print our confirmation candle. We have not confirmed that we have passed our first test, still 2 days left for confirmation candle to close.
We have a bigger test and more important key level which is around $ 28.4k, this is very strong resistance, stronger then our previous test. Confirmation of $28.4k as a support will officially be start of a bull run.
We can also see a bearish divergence forming on RSI as BTC headed to the most important resistance level, indicates we might get rejected from this level and come back to conquer later some time eventually.

BTC/USD- Rising Wedge with Bearish RSI Divergence on 4H Chart.BTC/USD is making Higher Highs on 4H chart but RSI is making Lower high. Bearish Divergence with Rising Wedge.

Time for a correctionHello community, I would see some bearish divergence here + this run would need a little accumulation and pullback for a healthy growth market. Of course we all like a rising price, but that seems dangerous at this rate. I'd like to see a correction to resistance or into the 25K levels.

CHFJPY Short Term Sell IdeaD1 - Price respected a strong resistance zone and is bouncing lower.
Bearish hidden divergence followed by continuing divergence.
H4 - Bearish divergence.
Most recent uptrend line breakout.
Until the strong resistance zone holds my short term view remains bearish here.


EURNZD - Looking To Sell Pullbacks In The Short TermH1 - Bearish Convergence.
Most recent uptrend line breakout.
Currently it looks like a correction is happening.
Until the strong resistance zone holds I expect the price to move lower further after pullbacks.

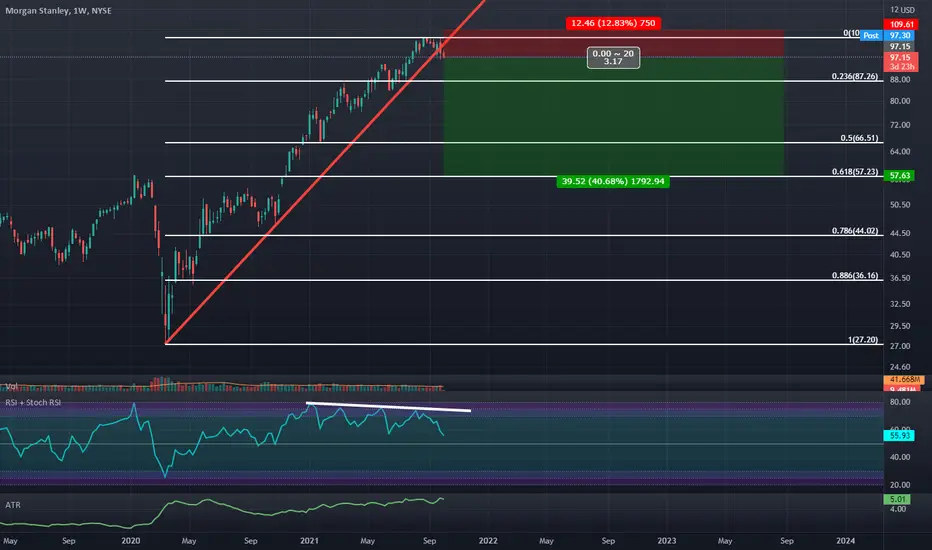
Dark Cloud Cover Visible on Weekly in Morgan StanleyWe have a confirmed Weekly Dark Cloud Cover with 4 instances of Weekly Bearish Divergence and we are breaking down an up trending line I think it wouldn't be so crazy to bearishly target a 50-61.8% retracement from here.
CADJPY Short Term Sell IdeaH4 - Price is bouncing lower from a strong resistance zone.
Bearish convergence.
Uptrend line breakout.
Until the strong resistance zone holds my short term view remains bearish here.

EURNOK: Bearish Deep Gartley with MACD Bearish DivergenceEURNOK is showing a notable amount of Bearish Divergences across many timesframe at the PCZ of this Potential Bearish Deep Gartley.

"Swing Trading COIN: Bearish Divergence and Golden Pocket Setup"Confirm bearish divergence on RSI: Wait for a clear bearish divergence on the daily RSI chart for COIN .
Watch for a break below the 50 EMA: Keep an eye on the price action and volume to confirm a break below the 50 EMA. Volume increasing as it breaks 53.66 could signal a stronger bearish move.
Enter short position: Once the break below the 50 EMA is confirmed, consider entering a short position at a price level slightly below the 50 EMA. Set a stop-loss order at 58.10 to minimize losses if the price moves against the trade.
Set take-profit level: Set a take-profit level at 44.62, but consider taking into account the whole golden pocket between 52.78 and 43.78. The golden pocket is a Fibonacci retracement level and could act as a significant support level.
Monitor the trade: Monitor the trade closely and consider moving the stop-loss order to a trailing 5% once the trade is 15%+ in profit. This can help protect profits in case of sell exhaustion. Also, consider oversold levels as the price approaches the profit target.
Note: This trade setup strategy is based solely on technical analysis and does not take into account any fundamental factors that may affect the price of COIN. It is important to conduct further research and analysis before making any trading decisions, and to only risk an amount you are comfortable with losing.

Bitcoin Short Term Sell IdeaD1 - Price respected a strong resistance zone and is bouncing lower.
Bearish divergence.
Price still has room lower towards the key support zone.
H1 - Bearish trend pattern.
Currently it looks like a correction is happening.
Until the two strong resistance zones hold my short term view remains bearish here.

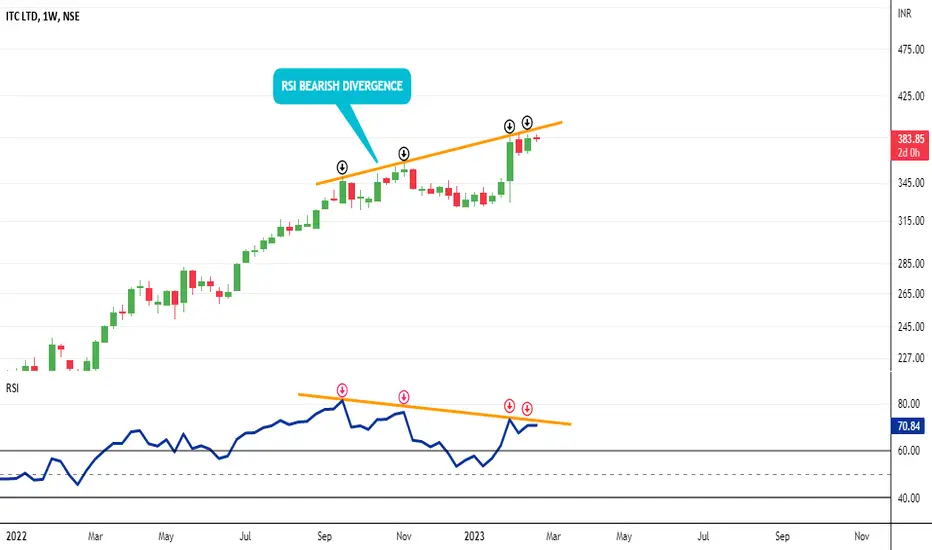
RSI BEARISH DIVERGENCE ON WEEKLY & DAILY CHART. Hello to everyone,
As we can see there is a bearish divergence in RSI & PRICE on weekly & daily timeframe. This is indicating that price has not much momentum to go upside. We can expect a trend reversal in stock price but only RSI divergence does not confirms the trend reversal. If any bearish candle or bearish pattern forms than only we can go for the short position.
Traders, if you liked this thread , write in the comments. I will be glad.
Attaching previous idea of ITC
EURNZD Short Term Sell IdeaH4 - Price is bouncing lower from a key resistance zone.
Bearish divergence.
Until the key resistance zone holds my short term view remains bearish here.
A valid breakout below the uptrend line would be the validation for this short term bearish view.
