SHORT ON GOLD - SUPPLY & DEMANDGOLD is currently at a key supply zone, marked out on the 30M timeframe. Previously, GOLD has rejected this zone with strong momentum, and we can already see strong selling pressure at this zone.
We've just seen a huge bearish engulfing candle formed the 30M timeframe, creating a new lower low. I am now looking for GOLD to come up to supply once more to complete the head & shoulder pattern making that lower high which so happens to line up with the 61.8 Fibonacci level.
I personally believe GOLD is heading higher into the 1800 (Golden zone) where we have another supply zone, however GOLD has started to reject the 30M supply zone instead but please do trade with caution!
Long-term- I believe GOLD is going to break out of this range and head up to the mid-1800 area in the next few weeks/months. This idea is fuelled by the high inflation rate around the world, specifically the US where they are at a 38 year high of 6.8%. GOLD is seen as a hedge against inflation and with concerns over the new Covid variant, investors may start moving their money into safer assets such as GOLD / US Dollar / Japanese Yen.
This is merely a possibility and a trading idea so please do trade with caution and ensure correct risk management is implemented.
Good luck and let me know your thoughts!
Bearish Engulfing

GBPCAD SELLDOJI Candle for last 3 days, Price stuck at the daily resistance level. The daily candle is bearish engulfing. Signal for sell.

WMT shortEntry price: 150-152$
Target price: 135-137$
Stop loss: 153-155$
Chart pattern: double top - the price formed the second top, thus the price reversal is very likely
Candlestick pattern: bearish engulfing
RSI: approaching 70 level, therefore, the price is almost overbought
Conclusions: the chart pattern, candlestick pattern and RSI suggest the trend reversal in the near future. Thus, the short position is recommended with the stop loss above the resistance level.
No financial advice

AXSUSDT | short opportunityOn the 1-hour timeframe, we see the bearish divergence formation.
On the 2-hour timeframe, we see a confirmed reversal pattern represented by a shooting star candle "A" with a bearish engulfing candle "B" confirmation.
4-hour timeframe, also represented by shooting star.
We can expect a downward movement with a take-profit target near the "B" support area of $120, but we still need to break through the "A" support area near $140.

BTCUSD - H4/H1 - MAGICAL CLOUDS !H4 :
Once again the clouds acted perfectly well on both sid e, in rejecting, respectively
a downside breakout attempt around 60'000 and more recently an upside breakout
around 63'600.
In addition, price action on the top of the clouds, triggered a "BEARISH ENGULFING"
pattern.
Ongoing downtrend channel still in place and clouds area should be seen as a barometer
for further development.
Indeed, IMPLICATIONS a clear breakout of :
1) UPSIDE : 63'000/63'500 (former congestion top) would open the door for ---> a retest of ATH
2) DOWNSIDE : 61'500/61'000 (MBB & KS cluster and clouds support zone) would put the focus on ---> former
low @ 59'500 ahead of lower levels; 56'525 is the 38.2% Fib retracement of the 39'590-66'994 rally and 55'147 is
the Kijun-Sen or base line !
H1
Price action switched from an uptrend channel to an ongoing downtrend channe l and this change has been
triggered by a "doji" which has been confirmed straight away by a long black candle (bearish engulfing)
Currently below both MBB and TS and flirting with the KS important support level in this H1 time frame.
A failure to hold above 62'763 would directly put the focus on the 62'000 area, ahead 61'600 and 61'000 (the latter
level being the bottom of the H1 clouds support zone.
In order to neutralise this ongoing downside move price action, the BTCUSD should quickly recover above 63'000 and hold sustainably on a closing basis; this
would temporary neutralise the current ongoing selling pressure.
Do you like my analysis ?
If yes, please do not forget, to like it and to add me on your following list :-)
Many thanks in advance.
Have a nice trading day and all the best-
Take care
Ironman8848

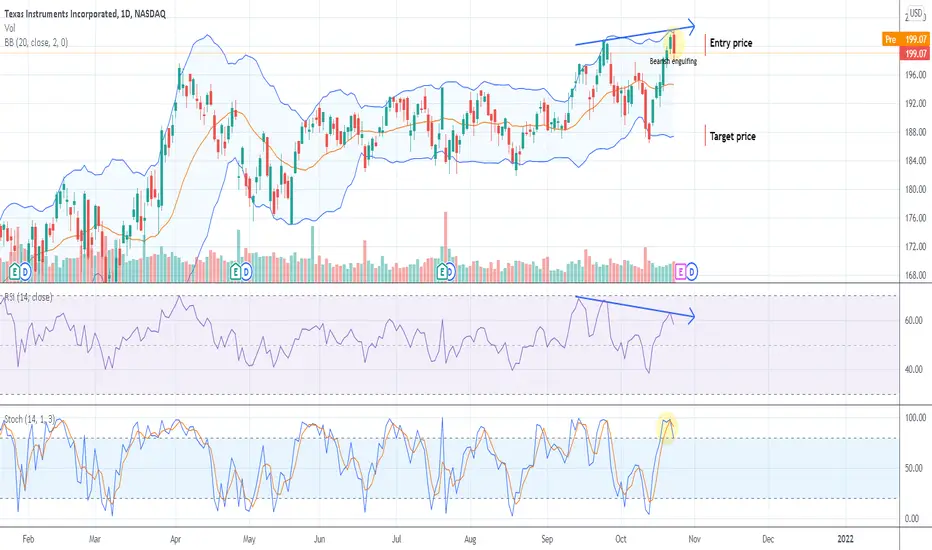
TXN shortEntry price: 199-201$
Target price: 186-189$
Bollinger bands: the price approached the upper boundary
RSI: bearish regular divergence, therefore, the price retracement is likely to occur
Stochastic: the asset is overbought
Candle pattern: bearish engulfing
Conclusions: All indicators suggest trend reversal in the near future. Thus, the short position is recommended.
No financial advice
NZDCHF - (D) IN TREND BEARISH ENGULFING SETUPNZDCHF has formed a significant bearish engulfing on the daily time frame
Entry at the 50% retracement level has been perfectly rejected 3 times.
The bearish engulfing candle engulfed 5 previous candles.
The daily time frame bearish engulfing candle closed Wednesday.
SL set above engulfing candle high. TP set at 3X risk.

USDJPY Idea 9/30/2021Hello traders, this is an idea for USDJPY. Nice double top on the 4 hour time frame. Two possible scenarios.
1. Price could retest and go long to form a nice head and shoulders and then retest neckline (111.200) and go short from there.
2. Price can breakthrough 111.200 and retest 111.000 and then go short from there.
If you agree, give this chart a like and follow for more
Trade responsibly.

XAUUSD Good sell opportunity!Hey guys,
Based on the chart price is in a good situation for opening sell positions on XAUUSD. But let's go deeper on our reasons and see what's on the chart:
1. Price is in a downtrend ( Bearish )
2. A correction have happened --> price reached to 0.618 Fibonacci and dropped ( Bearish )
3. Bearish Engulfing Candlestick ( Bearish )
4. Currently price is in an uptrend channel ( Bullish )
5. Hidden divergence on RSI(14) ( Bearish )
So based on our analysis the bearish movement is more possible than the bullish one. So it leads us to be seller which have more probability and makes good risk reward ratio.
One good trading scenario for this case is waiting for the price to reach to the top of the channel and opening sell positions regarding to considering risk management rules.
So it is our analysis about XAUUSD. But please let us know what do you think about it? Buy or Sell and why? Any idea would be welcome and valuable for us.
Good luck!

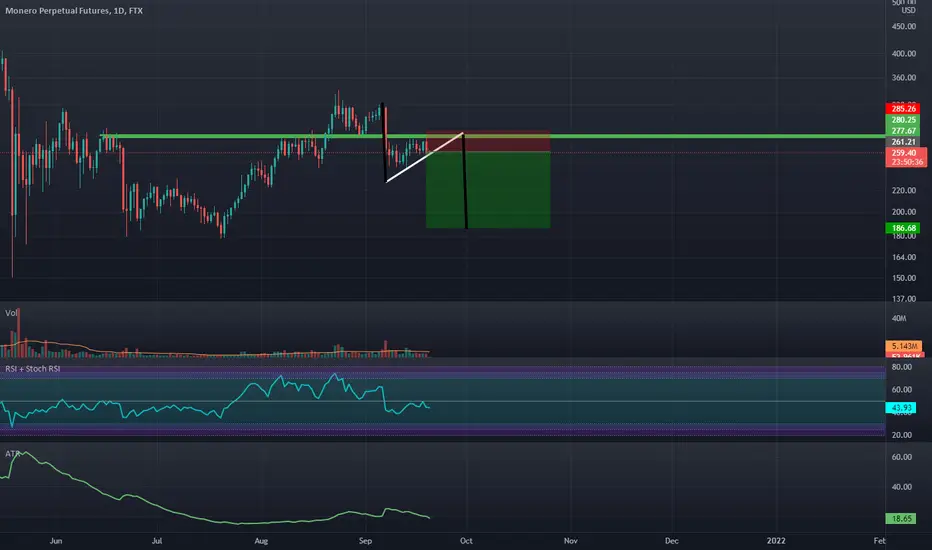
Early C Short Entry to the 1.618 Retrace BelowI think Shiba will bullishly reverse at the PCZ of Bullish ABCD but as of now i will like to try to enter before it potentially completes the rest of the wave. Stoploss above the bearish engulfing candle of this potential double top.

Bearish Engulfing On Daily Under An Important LevelWe are under support and the RSI is under 50 and looks to be ready to go down lower i think we will see $200-$180 again.
Weekly Bearish Engulfing On The Real Estate SectorThis Real estate ETF looks like it's ready to rollover on the weekly timeframe due to it bearishly engulfing, being at a 1.272 fib extension, and the RSI trendline being broken after reaching overbought.
I will either be looking to buy puts in VNQ tomorrow or i will be looking to purchase shares of the 3x Ultra Short Real Estate ETF $DRV

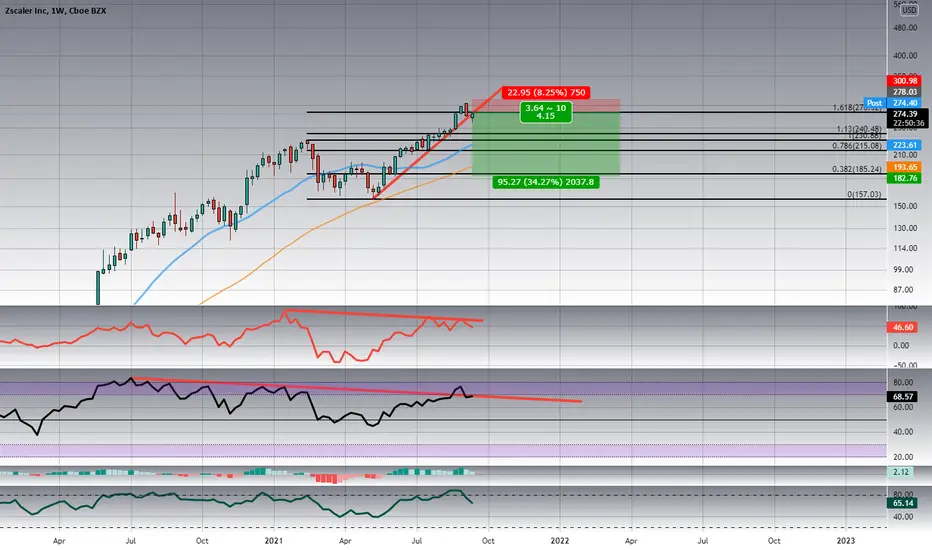
Weekly Bearish Engulfing at 1.618 Fib ExtensionWe have bearish divergence on momentum and rsi at an important fib lvl after breaking the trend and bearishly engulfing on the weekly
GRTUSDT At a key level!Hey guys,
As you asked about GRTUSDT, We can say that the price is currently on a support area(However it is not a major) and we have different scenarios for it:
1. Breaking the support area:
it would be possible for price to drop till 0.5
2. Rejection happening:
At this situation the next target would be 1.1
-----------------------------------------------------------
But let's see what we have on the chart right now:
1. Price made a new higher high and higher low ( Bullish )
2. RSI hidden divergence ( Bullish )
3. Support area ( Bullish )
4. Double top pattern ( Bearish )
5. Strong bearish engulfing candlesticks ( Bearish )
6. Breaking the trend line and a pull back is done ( Bearish )
------------------------------------------------------------
What's my idea?
Honestly speaking we don't have enough proofs to be seller or buyer at the moment.
But as the Bitcoin market is bearish and here we have strong bearish engulfing, so I have more bearish bias at this situation.
It was my opinion, but please let me know what do you think about this market? Bullish or Bearish and why?
Good Luck!

Weekly Bearish Engulfing Bearish 5-0 May Take Us Down to 12KIt's not completely hopeless for the bulls yet but from the looks of things on the charts it seems way more likely that BTC will see 12.5K again rather than it seeing all time highs anytime soon. The Weekly Bearish Engulfing makes the perfect rejection signal at this Pattern Completion Zone.
I think we just spotted the trend reversal.

Big short !Whales started dumping their bags, we know what it means. What is yesterdays 10000 dollar candle? Sell signal, of course!
For everything there is an appointed time, and an appropriate time for every activity on earth. A time to be buy, and a time to sell !
I give you three targets, are you ready for ~10k bitcoin again?


Payment Processors Are Setting Up To Get REKTMany of the payment processors and banks i look at seems to have some sort of indication that it will be going down soon Visa is just one of many. Today will be the closing of the month for VISA and many others and like many others Visa will be bearishly engulfing on the monthly and breaking down a rising wedge.

Daily shooting star reversal candle + bearish engulfing (BTC) Hello traders,
Daily timeframe analysis: bearish confluence ✓
1) shooting star reversal candle.
2) bearish engulfing candle on the following candle which confirms the initial reversal candle.
3) top of the rising wedge.
September is probably going to be red, as it aligns with the rising wedge and recent price action with the candle stick patterns.
Stay safe, and feel free to comment if you have any further questions or comments, also please like this post as it means a lot and shows support to my page.
👍

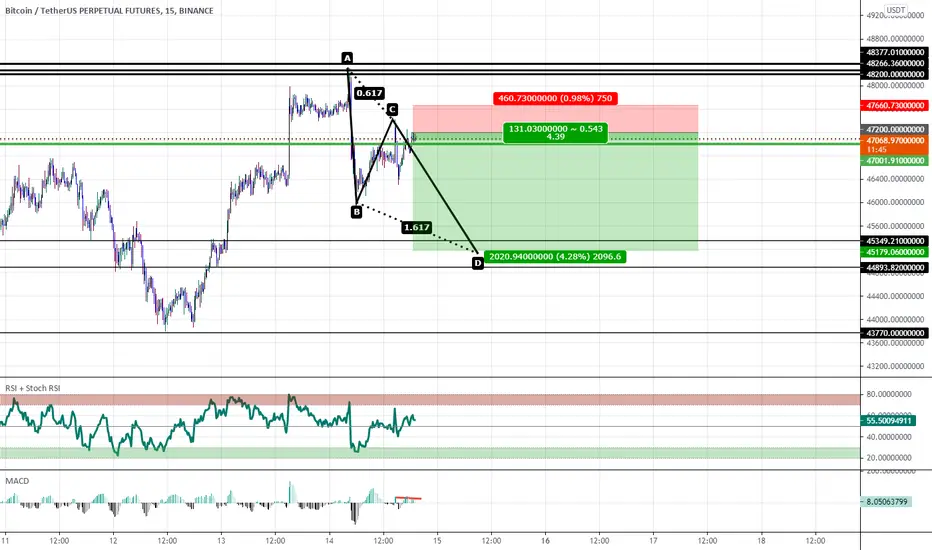
ABCD Correction incoming if support breaks at 47kIf 47k does not hold as support 45k will be the next target.
BEARISH ENGULFING CANDLE CONFIRMED (1+1=SELL) BTCHello traders,
Here's the fully developed technical analysis I've put together after the last 36 hours of going sideways in the overbought zone.
Stoch rsi (momentum oscillator) is finally starting to point down after confirming a bearish engulfing candle on the 3 hour timeframe.
3 doji's with the most recent candle looking ready to increase sell pressure at any given time.
Some time's you need to remain patient as price action develops and wait for the right things you'd like to see for conditions to be met.
Asia likely destroys the market tonight, wouldn't want to be in any leveraged longs as 25x longs will likely be targeted next.
Like previously stated in my last few technical analysis, the liquidity is now down.
Elon, Jack, and Cathie's discussion lured traders into buying higher and now big money's bags have been filled and liquidations will be coming for bulls soon.
36 hours in the overbought condition going sideways will be interesting to see how hard it comes back down.
Downtrend has 3 validation touches now and uptrend only has 2, bulls need to show strength around $30,888 or else we likely head back down to retest $30,000.
Stay safe fam.
Please show your support by leaving a like/comment! 👍


BTC/USDT buy signalthe bitcoin is in bearish price channel
and now is in the strong support zone
it also forms the head and shoulders pattern
we can take long position in it
and take loss limit below the support zone
and take profit in the top line of the channel
or save profit in it and move your stop loss
in previous ceiling.
