XAUUSD INTRADAY ANALYSIS 23.01XAUUSD ANALYSIS PREFERENCE SHORT
Long Target 1940/1950
Pivot 1935
Short Target 1917/1900
Bearish Flag

Sell AUDUSDBearish Flag pattern formed on 1H and came back to retest the zone that was previously broken.

Axie infinity heading towards top trendline of bearflagIf it were to break upwards from its bearflag like we have seen other cryptos in a similar pattern do recently such as solana its measured move breakout target is over 6x! No guarantee it will though and often times after several cryptos have already hit their break out targets the alt coins that are lagging behind don’t always hit their full targets. A correction is bound to happen in the near future after such a pump so must tread carefully on this one..I was dollar cost averaging and bought a decent amount the current low so I’m good no matter which way it heads. It is clearly mirroring the bearflag pattern seen on other game based alts like gala, sand, mana, and then also ones found on solana and qnt. *not financial advice*


$CAD - Patience $CAD - Interesting...
At this current moment of time we are in a range but - Pattern forming of Flag a break to downside of these ranges to confirm taking CAD towards 1.32/1.31 areas. Good R/R -However, if we break above the TL above 200 EMA would be your target.
Follow your own trade plan.
Trade Journal

USDJPY - Bearish continuationHi traders, welcome to a new trading week, on USDJPY 1D timeframe, we are looking for a break of the correction phase to complete the bearish flag pattern

BTC: BEAR FLAG! DUMP AHEAD!!Hello everyone, if you like the idea, do not forget to support it with a like and follow.
Welcome to this quick BTC update. BTC is pumped very well in the last few days. It touched the $19k level. Now, what's the possible scenario from here? Let's discuss it in this analysis.
As you see in the chart, BTC is forming a bear flag in the daily time frame and currently, at the upper trendline of the flag. I'm expecting a rejection from here.
$19k is a crucial resistance level for BTC. If we get a weekly close above $19k then this flag will be invalidated and then we might see another rally up to the $22k level. But as long as BTC is inside this flag, I'm expecting a dump from here.
What do you think about this? Let me know in the comment section.
If you like this idea then do support it with like and follow.
Thank You!

Bitcoin Bottom Possibly Soon!!!This is a possible path to a BTC Crypto bottom as it likely makes its finial decent to form a bottom. We are looking at a finial bear flag. Major resistance is about to be hit shortly. Lets see how this will play out.............

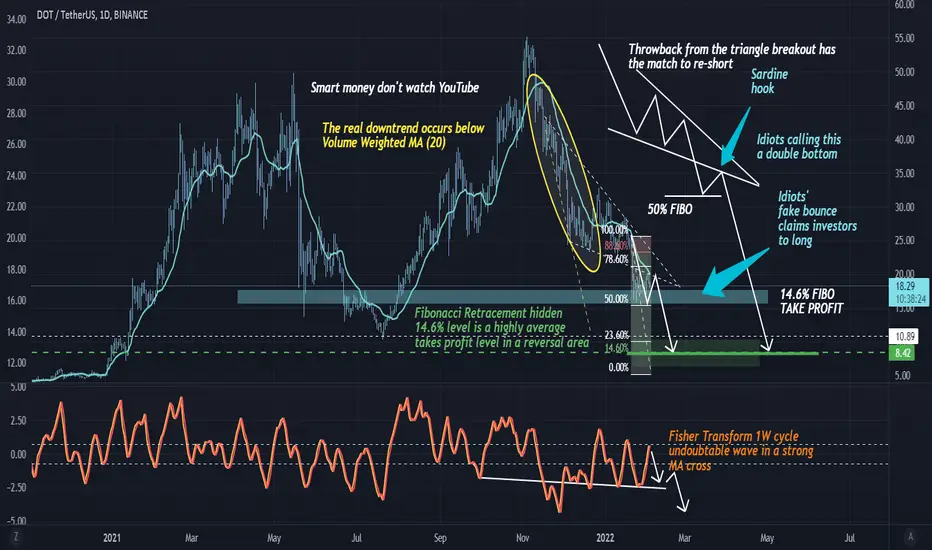
DOTUSDT $8.5 is a worthHi traders, I'm showing to you a more comprehensive daily chart after a weekly from yesterday w/ the Fisher Transform oscillator to approach one more undoubtable signal in confluence to the price action monitorized by the downtrend condition below 20 Volume Weighted Moving Average plus Fibonacci Retracement hidden strategy which uses the 14.6% golden ration subdivision level to a highly assertive target. 8.4USD is a worth and, during that trend volatility, a lot of desinformation will came with a potential dopamine explosion along propaganda content from YouTubers exchangers' employed guys. There's not pure predicting here but a highly concise technical analysis based on strong confluences correlating price and volume in a educative form - don't means that I predicted the future. And I'm not an identitarian fanboy, so I don't care about sentimentals.
NIO: The Most Important Support is Here! 👇• NIO is still in a long-term bear trend, however, it is doing an important reaction this week;
• It is confirming a bottom sign, just above the support at $9.40 (Support in Oct 2022, and Gap from Jul 2020);
• Only if it loses the $9.40 I see NIO seeking the purple line below the price, maybe even the $5.70 (Jan 2020 top level);
• However, the recent reaction might jeopardize a bearish sentiment, at least for now. It all depends on how it’ll react in the daily chart:
• Yes, NIO triggered a Bearish Flag, and as far as I know, it is just doing a pullback to the lower purple line again, before another drop;
• If NIO enters the Flag area again, and does a clear bullish structure, it’ll most likely frustrate this bearish pattern, and seek the next resistance in the weekly chart, which could be either the 21 ema or the upper trend line;
• Either way, NIO looks promising. I’ll keep you updated on this.
Remember to follow me to keep in touch with my daily analyses!

Bearish Bat On EthereumETH has had a Massive Surge in Futures Positions and that has thrown off the previous trade and sent it to the .886 Retrace if it gets above this level it will likely see an even bigger 886 retrace of the highs up to $1600 but for now im still betting against that and will be trading this much more local Bearish Bat with the hopes of it breaking below the trendline and ultimately trading towards $1000 and below within the coming days.

Bearish Flag on USD/JPY @ D1This bearish flag pattern has formed on the daily USD/JPY chart as a part of a wider long-term downtrend. The pole and the flag borders are shown with the yellow lines. The stop-loss level (the red line at 133.126) is set to the highest point of the flag area. The take-profit level (the green line at 126.221) is set to the pole's length subtracted from the stop-loss level. I will open this position only if the currency pair closes significantly below the flag's lower border.

$RBLX - Continuation of Stage 4?Dear all,
In a weak market, I look for stage 4 breakouts and continuation pattersn (based on the famous Stan Weinstein).
I try to look for bear flags that fall together with downsloping 50 day sma (or at least very close, a few %s).
Roblox had a gap down 15dec on big volume, price is now trying to fill the gap.
While it is trying to fill the gap it is forming a potential bearish flag.
If the gap is filled, price would coincide with the decling 50dma, AVWAP from recent high and the downtrending resistance line (since august).
When this point is reached (and only when), and price is resisted at the 50dma or breaks the flag, this could be a good entry for buyings some puts (3 months out).
Possible stoploss could be the long term downtrending resistance line or 50dma.
Things to consider for a stage 4:
- weak overall market :check
- declining 30 week Ma :check
- declining 10 week Ma :check
- 10 w underneath 30w :check
- Loss of trendline :TBA
Extra reasons for stage 4 decline:
- Big volume on down days
- Gap downs
- Resistance of AVWAP of important dates

UPS- Continuation of stage 4 decline?Dear all,
In a weak market, I look for stage 4 breakouts and continuation pattersn (based on the famous Stan Weinstein).
I try to look for bear flags that fall together with downsloping 50 day sma (or at least very close, a few %s).
This is the case for UPS.
After a last few good months for UPS, a possible bear flag is forming that coincides with a support/resisistance level and a downsloping 50d sma.
The AVWAP of the latest High and Low are also above the current price, giving extra pressure for a downturn (since the sellers are in control).
Things to consider for a stage 4:
- declining 30 week Ma :check
- declining 10 week Ma :check
- 10 w underneath 30w :check
- Loss of trendline :TBA
I will open some puts (3 months out) when the price breaks $173.3 or the striped support line.
Possible stop loss could be the 50d SMA or the AVWAP of the low.

BankNifty Preditiction Tomorrow 5th January 2023 | Expiry DayHey Guys,
Hope you have seen my yesterday video and im sure you must have made a good profit today. Everybody was buying CE but i was waiting for the move since last Friday and finally i made some very good profit out of this bear run.
Do see the important support and resistance level marked in the chart.
Note : This video is only for the education/ trend analysis purpose. Use your investment wisely and speak to your financial advisor.
Thanks

NIO: Triggered our Bearish Flag! 🐻 What to expect next?• NIO triggered our Bearish Flag chart pattern, indicating a continuation of the bearish sentiment;
• We studied this scenario in our previous public analysis on NIO – link below this post;
• In the daily chart, the 21 ema is working as a resistance, and it is pointing down, which reinforces the idea of a bearish sentiment;
• What’s the next technical support level for NIO? The purple trend line in the weekly chart. Below that point, the $5.70;
• Could NIO react from here? Yes, and if it is about to react, the timing couldn’t be better. NIO is near the weekly support at $9.40 (black line, weekly chart), and any bottom sign would indicate a possible bounce to the 21 ema again. However, there's not a single bullish sign on NIO yet;
• I’ll keep you updated on this.
Remember to follow me to keep in touch with my daily analyses!

Could $XLE be making a bear flag?A break and close below the ascending channel could mean that $XLE could be around $76.4 in the near future.
Some support areas to keep an eye on are $81.9 and $78.9.
One to keep an eye on!

ETH IS AT RESISTANCE! EXPECTING A REJECTION FROM HERE!!Hello everyone, if you like the idea, do not forget to support it with a like and follow.
Welcome to this quick ETH update.
ETH is forming a bear flag in 4hr, which is generally a bearish pattern. It is currently, near the upper boundary of the flag. I am expecting a rejection from here.
After the rejection, we have two supports one is at around the $1220 level and another one is at the $1190. Breaks and close below $1190 will be bad for the overall market and we might see a massive dump.
Invalidation:- If any 4hr candle breaks and closes above the flag's upper boundary ($1250), then this bearish scenario will invalidate.
What do you think about this?
Share your views in the comment section.
If you like this idea then do support it with like and follow.
Also, share your views in the comment section.
Thank You!

Usdjpy Bearish flag pattern Previously i publish this setup and share idea it is Bearish flag pattern finally our Target Don.

CADJPY I Headed for supportWelcome back! Let me know your thoughts in the comments!
**CADJPY Analysis - Listen to video!
We recommend that you keep this pair on your watchlist and enter when the entry criteria of your strategy is met.
Please support this idea with a LIKE and COMMENT if you find it useful and Click "Follow" on our profile if you'd like these trade ideas delivered straight to your email in the future.
Thanks for your continued support!

GOING SHORT IN GBPJPY BY TRADING STRATEGYBearish Indications (BIASED SHORT)
1. Bearish Flag Formation and it breaks its support line as well
2. BXY is in a Bearish/Sideways Trend
3. JXY is in Bullish Trend
4. Broken flag support trend line
Bullish Indications
1. Currently Price is at its major support level in Higher TFs
Neutral Indications
1. No divergence was found as RSI and the chart is in sync

Sellers in control of AppleAlmost seven bearish indications are seen in this stock; indicating that the bears are in full control of the rally

Bearish flag pattern in usdjpy Bearish pattern in usdjpy in h4 time frame maybe this is helpful for traders .
