Bear flag forming? (BTC) $38,888 area of interestHello traders,
I've spotted this bear flag , and if it decided to break down the target/measured move would be $38,888.
Stay safe, could be a messy week ahead.
Please like/comment to show your support. 👍
Bearish Flag

Bitcoin repeating, few more hours till dup timeSo looking back at the wicks i have redrawn the bear flag on 4hr TF, and this would then give us a similar fractal of what occured on ATH, plus three touches to top trend line and three to the bottom, also shakes out any shorts with tight stop losses, a nice spot to look for a entry to a short if not already in one NFA trade safe

GBPUSD, 4hr tf, sell the retest of trendlineTrade ideas for GBPUSD by Hardi
After break below the descending trendline, we finally have a retest today.
Price go towards our desired price at 61.8 fibonacci retracement of recent breakout which could offer us a good 3R trade setup.
Overall if we follow it as bearish flag, the target should be around 1.35xx area but we will be satisfied if we could secure 3R.
Sell GBPUSD 1.3830
Stop loss 1.3900
Take profit 1.3620 (3R)
Use only 1-2% risk
Good luck

BTC Bear flag formationHello everyone.
the bear flag is forming, we might have another drop to 42k level
reasons for that is Rsi Rising while the price is falling, macd consolidating to green zone with out price rise. (yellow line)
see white line for direction
what i think it is consolidation before another drop.
dont trade its risky now, wait for confirmations on charts, and clear break outs.
for now i think its 80% probability we will see 42k soon
in a long run and in daily time frame, hidden bullish divergence is forming, btc need to go down more for it to play out
range of consolidation roughly was 47000 - 45500 and getting smaller, break out either way will give an idea where it can go
not financial advice and do your own research
trade safe good luck

next bitcoin drop-dump imminentlooking at a measured move down to occur in next 4hrs with a dump to around 36500k ish, then look for a slow trade back up to around 48k ish before the next big leg down to around 19k ish

Despite everything - bearish case is still active!Despite all the fundamental things - my technical look on silver keeps still being bearish.
IF the XAG/USD manages it to make daily close above 24.82 USD and overcomes the 50's SMA, the 38.2 % Fibonacci retracement, and the channel I would see more upside and this could be the end of the bearish case in silver.
Otherwise, it's IMO more likely that silver will resolve the bearish flag by breaking to the downside and will reach some price quotes around 22.40-23.00 USD.

GBPJPY, 4hr tf, break of trendlineAnother pair to trade is GBPJPY.
Setup is pretty much like my GBPCHF ideas which is bearish flag pattern.
Although this bearish flag is not as clean as GBPCHF, it is very possible GBPJPY also making a bearish flag.
Sell GBPJPY 152.00
Stop loss 152.70
Take profit 149.10 (5.5R)
Use only 1-2% risk
Good luck
Enter on your own risk

GBPCHF, 4hr tf, bearish flag patternHello guys,
It has been 2 weeks since my last post in tradingview.
I haven't found any interesting setup so I don't post anything.
Today i finally found an interesting trade to share with you all so i will share it.
As you can see, GBPCHF right now hovering at 61.8 fibonacci retracement of recent swing low. It looks like a bearish flag to me and we might get another swing to the downside.
For this pair, our position gonna be sell.
Sell GBPCHF 1.2670
Stop loss 1.2730
Take profit 1.2390 (4.67R)
Use only 1-2% risk
Good luck

USDJPY - Bearish GartleyA Bearish Gartley pattern forming 110.04 within the consolidation of the previous bearish flag pattern.
I'm waiting for candle confirmation for an entry opportunity. 3bar reversal should do.

Short-trend in CORNIt seems like a bearish flag pattern, which is building up in the Corn futures. So this could result in another short-term bearish impulse.
According to the seasonality charts we have at the end of Sep/Oct (depends on which charts you take into consideration) a seasonal low. According to the CME, it's not expected before Nov/Dec (New Crop months).
My personal long-term view on the agriculture commodities is of course very bullish - but we can go still one level lower over the next months ...

GBPAUD - Bullish Gartley @ XBullish Gartley Pattern form at X is 1 of the pattern that I will watch closely. I'm waiting for a counter-trend trade on this Gartley Pattern setup.
Trade has already engaged but stops is placed below the bearish flag completion with buffer.(you can check out the link at the bottom to access the training on my secret formula in placing stop-loss)

GBPAUD - Bearish FlagSometimes it could be hard for a trader to differentiate whether the market is going to have a Double Bottom setup with RSI Divergence of a Bearish Flag formation. It all voice down to your filter and experience in the market. If you are uncertain of any trading setup, then leave the trade alone until you have further confirmation.
While a small group of traders are aware of my thoughts on this bearish flag setup, I regretted not posting this trade, but if you believe me, then that doesn't matter.
At this moment I'm waiting for a double bottom set up at 1.8790, which is also the level that coincides with the retest of the broken trendline on the 4-hourly chart for a buying opportunity. And to your comfort, it is still within the buy zone of the 4-hourly chart and the daily chart as a trend trading setup, although from the recent market movement, the bearish move is much stronger than the bullish candle and that is why you need to have a strong filter that you have manual backtest for at least 100 times per timeframe, per currency pair.

Axie Infinity AXSUSDT - Warning to all hodlers! Elliott Wave- On the chart we can spot an ending diagonal Elliott Wave.
- The price is at the top of the channel, which acts now as a resistance.
- Is it now good time to sell? Due to technical probably yes.
- There is also a bearish divergence on the RSI indicator!
- For expected duration of the trade, probability, stop loss, profit target, entry price and risk to reward ratio (RRR) - please check my signature below ↓
- If you want to see more of these ideas, hit "Like" & "Follow"!
- Maybe it is a great time to sell this coin, take profits and buy something else.

ADAUSD Drop to 2.48 InboundWell we have a bear flag, the push failed. After two patterns failed, it is clear the market believes ADA needs consolidation. I expect ADA to go to 1.48-1.40 and consolidate. We will check the patterns again. 3.25 will come, it's just a matter of when.
Now lets talk about why ADA has so much strength. Cardano is about to release smart contract September 12 with the Alonzo release. This addition makes it a viable competitor to ETH as an open source platform. Right now, it is just a glorified ledger. As a person who plans to be a Cadano Developer once Alonzo is released, it makes me wonder how far ADA can go. I have heard people say it cannot go to 100 dollars because it will need around a 3T market cap. But considering in the past 2 weeks ADA has added 31B to its market cap, it's definitely not out of the realm of possibility. Also, considering Grayscale Investments has picked it up, I think it has a LOT more room to grow.
Tell me what you think?
This is not financial advice. DYODD.

EURCHF on a bear flag 🦐EURCHF on the 4h chart is moving inside a bear flag below a structure.
The price has tested the 0.382 Fibonacci level and according to Plancton's strategy if the price will break below we will set a nice short order.
–––––
Follow the Shrimp 🦐
Keep in mind.
• 🟣 Purple structure -> Monthly structure.
• 🔴 Red structure -> Weekly structure.
• 🔵 Blue structure -> Daily structure.
• 🟡 Yellow structure -> 4h structure.
• ⚫️ Black structure -> >4h structure.
Here is the Plancton0618 technical analysis , please comment below if you have any question.
The ENTRY in the market will be taken only if the condition of the Plancton0618 strategy will trigger

TSLA at a critical spot TSLA closed on Friday sitting right on its 200-day SMA. It previously broke below the bear flag to test a long-term uptrend line, while simultaneously forming what appears to be another bear flag / rising wedge (bearish) going into earnings on 7/26'. If this long-term uptrend line is broken, TSLA could see sub $600 especially if the broader markets continue pulling back. Will be keeping a close eye on TSLA here for potential long entries.

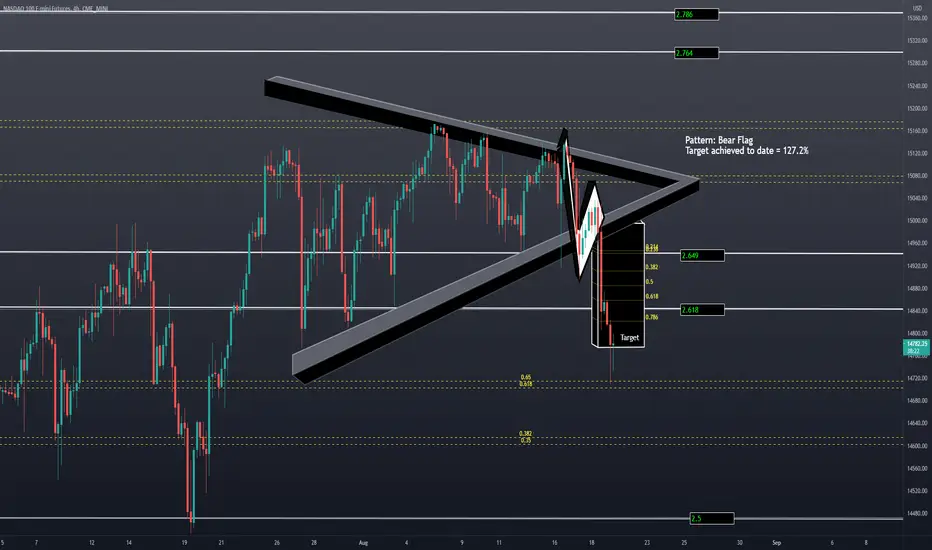
NAS - Achieved 127.2% of the Bear Flag Break Target1.272 is the square of the Golden Mean; 1.618 and often is a place to look for a reaction. Support was found overnight at the Daily 50 SMA, overtaking the Daily LBB on a mini-inverse break in the premarket.
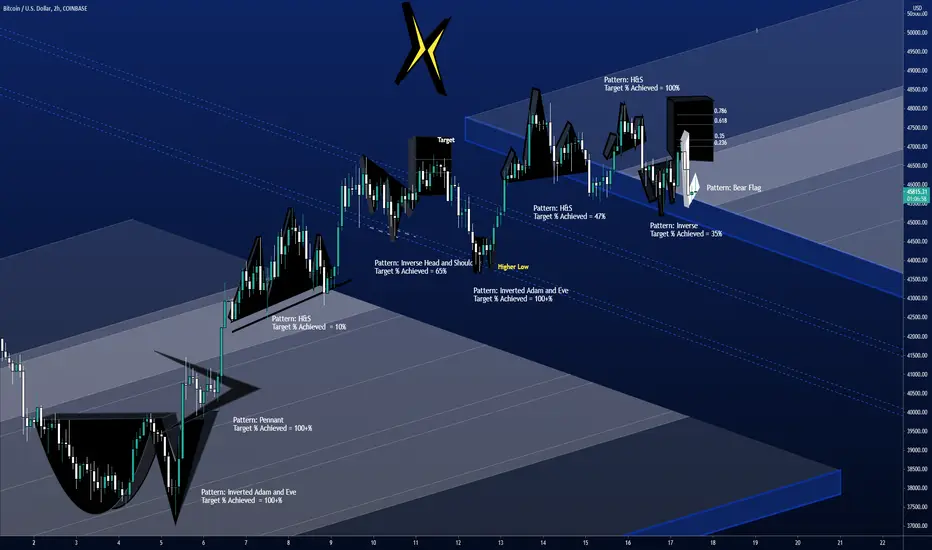
BTC - The Daily Higher LowBTC is above the daily Higher Low as the shorter frame Bear Flag confirms. Support was found above quickly at 15% of the Break Target.

UK100GBP SHORT UK100GBP is at a key resistance level, as well as being at the peak of a bear flag on pivot 5, RSI 2 & MFI 7 showing massively over-brought, I think there's only one way from here, down. expecting 65.98 eventually, but you can pencil in 71.50 as TP1.
good luck, see you at the bottom.

BTC - Bear Flag ConfirmedClean Break to the Break Target .786. Watching for the next pattern to form with 43750 being a key watch to find support. The middle of the range as price looks to work back over the 65-28.8K fifty percent retracement.

BTC - The Game of Patterns - Bear Flag - Point BreakA bit of a bear pattern forming on the 2 hour frame. Each pattern has a bull and bear thesis, I am searching for the Break Point, or Point Break if you happen to hang -10 with Keanu Reeves, Lori Petty, Patrick Swayze off the California Coast this week.
Micron Tech (MU) Bearish FlagMU has formed several bearish flags in the past month. It looks like there's another potential flag forming currently.

AUDUSDPattern: Bear flag
Confirmation: Overall trend down / Yes. Small upwards consolidation channel / Yes.
Entry: Waiting on the break and re-test of the structure.
Fundamentals: Inflation for the DXY is of course very high but is seen in a good position given the current world circumstances etc. A lot of DXY price will be driven from employment reports which should see this pair continue downwards given the USD strengthens.
