Still EXACTLY inside BEAR FLAG ! Watch for BIG breakout down !Buyers run out of breath! Be prepared for free fall below ~62.65 USD !
Bearish Flag

Still EXACTLY inside BEAR FLAG ! Watch for BIG breakout down !Buyers run out of breath! Free Fall can start below ~66.16 USD !


BEAR FLAG formed ! Will history repeat itself?On 30 July 2019 we've seen the same (similar) BEAR FLAG like now! Will history repeat itself?

Is this a BEAR flag ?! ;-)Like trader ScottBogatin already said, look at the chart, now we are trading in a wide range of about $4-5 per day. Today we opened 63.94 and closed 66.20, that's only $2,26, a fully normal average range. And we've closed the gap! But now we've formed a BEAR FLAG as from the textbook. Maybe it is "BULL TRAP"!? ;-)

Ranging Gold MarketHey guys, I trust you are in good health and enjoying your weekend with your loved ones.
An interesting week we had and more interesting weeks ahead, with volatility growing each day as we head into spring 2021. This spring season is extra important, as most developed countries have been vaccinating their people and the expectation is that these economies can get out of their lockdowns soon & governments can make up the balance of the damage. These events will have a major impact on markets - the equities and goldmarket in particular.
On the technical side, we have a nice inverse H&S pattern on the daily chart with targets 1785 (38.2 fibo retracement level from 1960) and 1805 (gap closure). Also the daily RSI is above 50 since months and the latest COT is superbullish with an increase in net long positions of +22k contracts.
The daily chart is currently in a bullchannel . Bears want this bullchannel to turn into a bearflag targeting 1680 and 1650 from the supply zone . If bears succeed to bring the price to 1650, they will have a break of the April 14th 2020 low and more downside is expected in the goldprice with potential bearish targets 1550 and 1450. Ofcourse before that, bulls will try to turn 1680 into a triple bottom , if they succeed they will have setup a major support zone which will function as a platform for a potential rocket to 2100.
For the coming week I am planning to buy the 1735-1740 zone with targets 1785 & 1805 and will start selling after the gap gets closed. We might go a bit higher around 1808. For the gaptraders it is important to know that the gap indicates a supply zone, so I am expecting strong bearish PA after the gap gets closed. I will be looking to rebuy the 1680 zone with targets 1820 & 1850 (50 & 61.8 retracement level from 1960). All too early for now, but one can dream right? :)
In short, a ranging market for the coming weeks and a lot of pips to scoop.
Keep the scooping blue 😏,
Cesaro

TWTR - shortNest wave correction
Nice rejection candle right at the level on the daily chart
target 55

NZDJPY - Approaching Sweet Spot for SHORTNZDJPY is creating a bearish correction now and approaching an area of interest where it would be ideal for a short.
Watch for break of the correction!
Goodluck and trade safe!

CHFJPY - Correcting For A Move LowerCHFJPY has been making easy corrections. Look for a break on the smaller timeframe and then enter. This has the potential to go much lower. See chart update for bigger timeframe analysis.
Goodluck and trade safe!

NZDCHF - Correction Overload!NZDCHf has been making beautiful bullish corrections all the way to the top. As we're anticipating NZD weakness, we can now look for shorting opportunities. We could possible be in a bear flag now leading to an area of interest. Watch for the flag to breakdown.
See linked chart on how to enter.
Goodluck and trade safe!

GBPUSD-Weekly Market Analysis-Mar21,Wk4GBPUSD is in a sideways consolidation. This setup allows us to trade within the zone(green box). The setup is safer when we are shorting from the top of the green box, than buying from the bottom of the green box, and the reason for that is the previous bearish trend which coincides with the starting point of Point X on the Bearish Shark.
However, if you are an aggressive trader, buying within the box can work as well and in the long run as long as you aren't flustered nor overtrade, you will be profitable.

AAVE See ya back at 208-210 area Broke structure with recent BTC dump. Expecting a 1.618 extension move which coincides with bear flag breakdown if it plays here.

Morning Update - SPX - Bear FlagThe overnight H&S hit it's target and now we have a 30 minute bear flag with resistance at the top of the range. The 10 year treasury hit 1.6 overnight after the State of the Union. The Dow hit ATH , an eventual snapback trade for the NAS is in order. The open give us direction. Scouting bounces if we consolidate. Weekly options expiry fireworks or pinned, next week monthly opex.

TESLA Short positionTesla hitting all time high, pending now to the bearish side.
There was high expectation from the Q4 earnings, that were missed.
MACD overbought, descending
Stochastic overbought, descending
With many analyst targeting the 518 level.
We will se probably a bounce on the trendline.
Dr. Michael J. Burry predicts a heavy fall on the stock price, well, lets see if he is right...

EUR/USD LONG [BEARISH FLAG]EUR/USD has been in an uptrend since last May.
Previously it had formed a bearish flag that continued the uptrend .
Currently I see another possible bearish flag forming that could once again indicate a big buy that is about to happen.
The price is currently touching the bottom trend line which indicates a reversal to continue the bearish flag, and adding to the confluence the price is also at a important support level which the price is failing to break .
Therefore I expect the price to increase until the upper trend line completing the bearish flag pattern .
The expected movement of the price is shown by the grey path drawn.

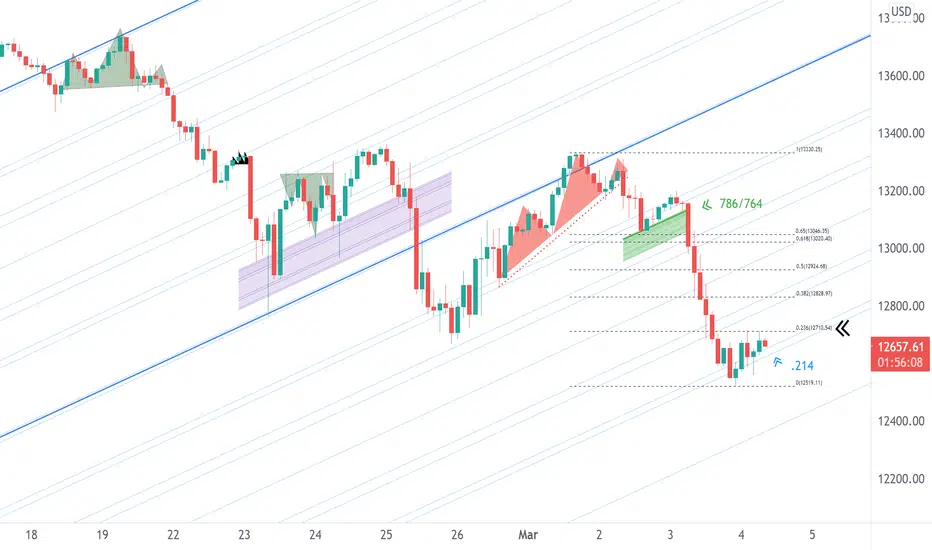
NAS - iH&S embedded in a Bear FlagLinear .236 Resistance from the recent move down. Found Blue Channel .236/.214 Support. Will the market sit on it's hands until Mr. Powell at noon?
📚 What To Look for When Charting Here is a chart of EURCAD. There were various opportunities available both short term and long term. Once you can identify chart patterns, you can easily anticipate where price will go next.
A great chart pattern that I always use is flags - Bull Flags and Bear Flags. In the chart you can see that many times price impulsed and then created a flag and then carried on with the move. Flags can be found both in higher timeframes as well as lower time frames.
Be sure to look out for them!

Bearish flag on WKHS heading below $10NASDAQ:WKHS Workhorse has had some quite bad news in the last couple of days, including the loss of a $6 billion vehicle contract, offered by UPS to one of WKHS competitors. What could have been a massive push to the company's vehicle orders is now gone. Well almost, because Workhorse management want to meet with UPS to discuss the matter. Though I would be very surprised that changes anything to the outcome of the contract awarding.
From TA perspective, buying a stock that has lost half of its value within a few days is tempting, but not always a good idea. I see it forming a bearish flag before continuing the dip, which could lead the stock below $10. The RSI is also showing a big weakness.
BUT, don't get me wrong, I don't recommend to short the stock as the risk-reward ratio is not great, but I prefer waiting for the bottom to buy, then ride the stock back up.

Bear Flag & a Head and Shoulders for GBR?Since my previous post on GBR, we've clearly seen the price breakdown from what appeared like a bullish pennant or potentially a bull flag, but the bearish divergence was/is too strong...
Currently, it appears as though the price is breaking down from a bear flag with a head and shoulders pattern noticeable. I have placed a blue human head and body icon to represent the head of the H&S pattern.
It could be an ascending triangle with a fake-out to the downside occurring now, the higher low trajectory has been negated at the upward sloping support of the pattern, in the next several trading sessions it will be more apparent.
The RSI is trading in a descending triangle creating a series of lower highs.
The DMI is showing a bearish cross where I've placed the red finger point downward.

📚 What To Look for When ChartingHere is a chart of EURCAD. There were various opportunities available both short term and long term. Once you can identify chart patterns, you can easily anticipate where price will go next.
A great chart pattern that I always use is flags - Bull Flags and Bear Flags. In the chart you can see that many times price impulsed and then created a flag and then carried on with the move. Flags can be found both in higher timeframes as well as lower time frames.
Be sure to look out for them!

GOLD - 4 ENTRIESOn the mark, I've illustrated how we had 4 entries on gold which aligned with our trading plan.
As soon as you understand which way the trend is, you can easily find loads of entries. Like my charts? Drop a like!

$FSLY bear flag into EarningsPretty obvious bear flag forming prior to $FSLY up coming Earnings report, my guess is a big gap down coming :)
