Bearish Flag

The EURUSD Trading Below 1.1000Last post: See link below.
Review: Price was weakening but in consolidation.
Update: Price has remained in consolidation until the break down below 1.1000 on Friday's bearish bar.
Conclusion: Standing aside until an offered ideally in the form of a bearish flag formation below 1.1000 .
Any comments or questions, do not hesitate to leave them below. Give us the thumbs up if you share our sentiments!
Sublime Trading


USD/CHF ShortOverall, the projection for the pair was downwards due to the HTF. On the 1HR we noticed, after we broke out of a larger bearish flag, we impulsed and then formed a 1HR bearish flag, got in on the RRE as the flag hadn't formed the third touch for a RE and the pattern was too tight to warrant a RE as per my trading plan - Instead we rejected the double top within the pattern. Order set.


EUR/USD Technical analysisThe counter has confined its price action to a range of 1.11078-1.10640.
It is awaiting cues from the Jackson Hole symposium to make a decisive move.
However, we expect a bearish move in the counter if it breaks the support of 1.10640.
The break could propel the pair to the support of 1.10267.

BTCUSD Update: Potential Trade SetupsUpdate of the attached trade.
Potential Trade Opportunities:
1. Short the flag breakout
2. Short the Alternate Bat
3. Long the resistance breakout
I will update!

bearflag poentially breaking down...target 8.6k?breakdown no confirmed just yet but probability is definitely favoring it now as we can see price acion now firmly under the 4hr deathcross. If price action cant climb back above that deathcross then both the bearflag breakdown and he death cross will be sustained/confirmed. this is the perfect spot if the breakdown is confirmed for price action finally reach that 8.5k gap on cme futures chart bit of course the smart trader will make sure to buy back in a few pips before that and if we continue to fall and hit that target to also buy the dip

BTC/USD Bear Flag Hello Friends,
Not much to say here, only thing to mention is that this is not a good time to be in the trade. I would wait for the down trend to end. Click on my link to see probable outcome.
Details on the Chart.
This is my viewpoint and my opinion. I am not giving advice but only sharing what I see. Do not enter a trade on my TA but do your own homework.
Cryptocurrency is volatile and very risky. Never invest what you can't afford to lose and always educate yourself and continue to do so when making any kind of investment.
If you find this information helpful, then please hit the like button. Your support is appreciated. Thank you!
CYA on the next one...until then, the trend is your friend. Buying on the dip and selling on the hype.
Cheers!

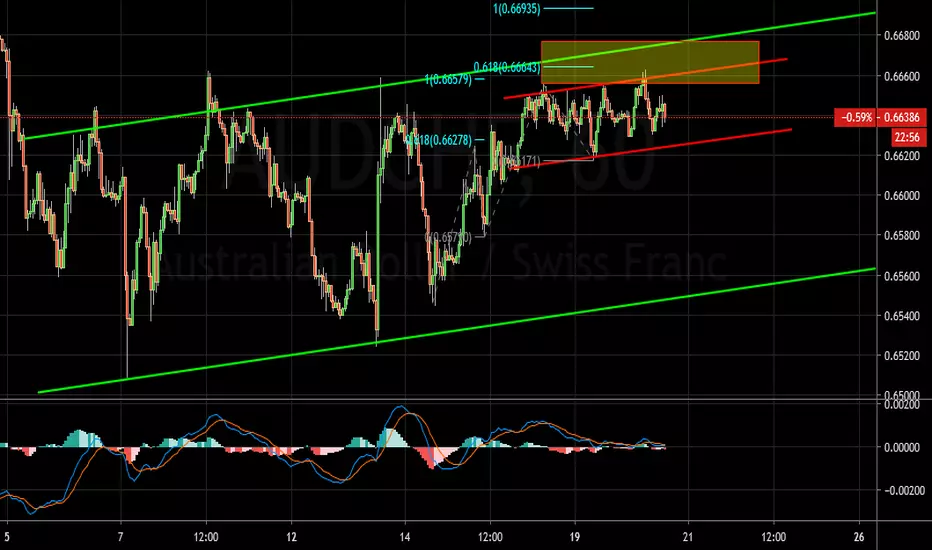
AUDCHF Sell IdeaD1 - Price has created lower lows currently it looks like a flat correction is happening.
H4 - Price is moving inside a bearish flag pattern.
H1 - Price is moving inside a small range, price has reached a critical zone formed by the top of the H1 range, H4 bearish flag and the fibo levels of the cycles we have and is currently moving lower.
Until the price holds below the critical zone we may look for bearish setups with bearish evidences in order to join the bears.
Nasdaq bear flag, ready for second leg down?Almost becoming a standard for the stock market to bounce right back up again after some bad bearish news and price action. This time there is a chance things might be a bit different though. On the left it looks like there is a real resistance zone now inside this bear flag. I have not posted much about these markets, because the noise has been extreme past year. But now it's worth it. Because if the curved blue line on the right holds, bearish price action could become real for the coming period. Maybe even a real bear market. But as soon as the curved line breaks, i will very easily step back again from that assumption and open again for both sides. There has been no logic at all IMO about the stock market. Everything can blow up easily IMO, but those thoughts have been with me for a very long time now. It has become clear, that as long as intrest rates don't increase, the inflow of (borrowed) capital could continue to push the stock market up. So it could be that as long as intrest stay this low, the bear market simply won't start.

JOHNSON & JOHNSON 1D IS IN A RANGE & BEARISG FLAGBearish Flag is a form of range pattern
Ranges, Descending Triangles, Triangles, & Ascending Triangle are repeatable trading chart patterns.
Triangles and ranges are consolidation chart patterns that can breakout either direction.
Ascending and descending chart patterns will have a directional bias depending on the previous incoming trend.
Each chart pattern will have defining trendlines of the support/resistance levels creating the pattern.
What ever time frame you are trading this chart pattern, wait for a candle close outside of the trendline in the direction of the breakout candle. (Our time frame preference is the Daily chart ).
Add volume indicator - Volume is the amount of $ that went into a particular candle or in Forex the # of trades that took place.
Add ATR indicator - Volatility is the amount of price movement that occurred. Use the ATR to measure the price movement.
When you see descending volume bars and descending atr line (which indicates volatility ) this shows
a dis-interest in traders to invest in this pair creating consolidation which creates the chart pattern.
Trade Management after there is a breakout candle close.
1 - Position size (compare volume bar to volume ma line).
a - Breakout candle must be 100% of average volume for a full position size.
b - If 75% of average volume then ½ position size.
2 - Enter two trades.
3 - SL for both trades will be 1.5 x ATR.
4 - 1st trade TP will be 1 x ATR.
5 - No TP on 2nd trade – letting profit run and adjusting SL to follow price.
6 - When 1st TP hit – move 2nd trade SL to breakeven.
7 - Adjust the 2nd trade SL to follow price.
*8 - When breakout candle is more than 1 ATR from breakout candle open.
a - Enter 1st trade at candle close with ½ position size.
b - Enter 2nd trade with a pending limit order that is 1 ATR of breakout candle open.
c – Price should pullback to that pending limit order for 2nd trade.
d – If Price returns back into chart pattern close trade before SL is hit.

BTCUSD 1D Bearish Flag forming It looks like there is a bearish flag forming that may break south after testing the 50 EMA and daily trend line close to 10,400. If it breaks the trend line of the ascending wedge and breaks through the level of support and psychological barrier of 10,000 it's next possible level of recovery would be the 100 EMA followed by a weekly pivot point at 8500 . I do not expect it to close past the 200 EMA.

BTC Potential Bear Flag? Short Hello Traders,
Update on BTC's recent developments,
Points to consider,
- Sharp advanced decline into pattern, - Key characteristic of a bear flag
- Price is in a narrow range
- Major support broken, support was in confluence with the .618 Fibonacci level
- RSI recovering to neutral zone
- Stoch's on downwards momentum
- EMA's providing price resistance at current given time
- Volume is below average, signalling a move is incoming
BTCUSD has been trading in this narrow range after a sharp decline in price, forming this potential bear flag pattern. This consolidation is a breather in the current trend (Bearish) as a bear flag is simply a continuation pattern. The flagpole formation gives us clear targets which is around the green support zone...
What are your thoughts on the potential bear flag ? Please leave a like and comment
and remember,
“Take your profits or someone else will take them for you.” – J.J. Evans

EURUSD Update: Bearish Flag and Potential Bullish BatUS Retail Sales, Phil FED Man. Index, Production Data
Potential Bearish Flag Breakout to add short as described.


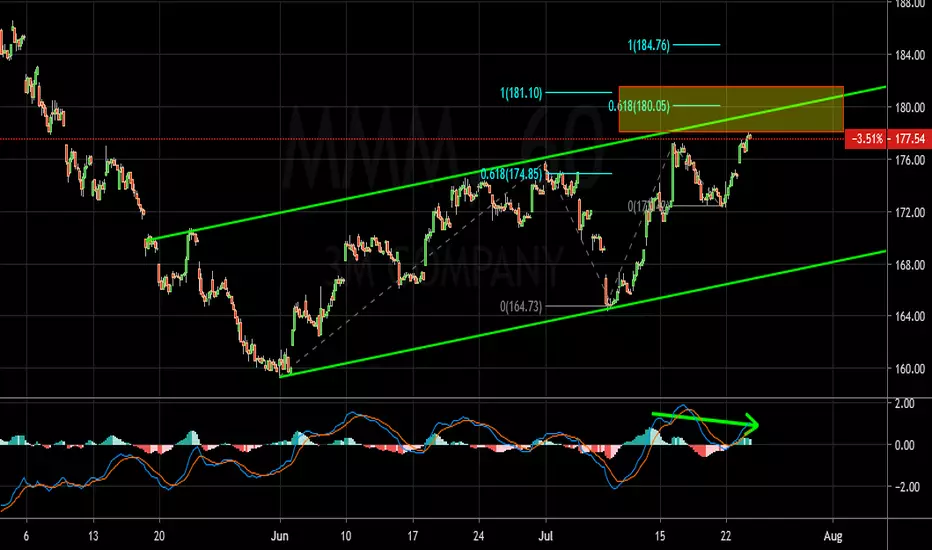
3M Sell IdeaW1- Double wave down, price broke below the 61.8 level, until this breakout holds, we may expect the price to move lower towards the next critical area.
D1 - Bearish divergence, price broke below the bearish flag.
H4 - Price has currently broken below the last low, we may now start looking for sells with more bearish evidences.

USDJPY-Weekly Market Analysis-Aug19,Wk22 counter-trend trading opportunity, a bullish bat and an ABCD pattern.
Breakout trader can look for an aggressive selling opportunity, conservative trend trader can look for a retracement before engaging the trade.

BTC Update! Bulls and Bears continue to battle - weekly outlookNot much to update from a few days ago. We continue to battle within the $11,100 and $9000 range. This is essentially a weekly bar we are within and with this weeks candlestick about to close in a few hours, thought I'd update a weekly chart.
Bears may seek to push price down and get a bearish weekly inside bar close and hope for continuation with the new weekly candlestick that will start tonight. Bulls will desperately seek to defend this low $9k area but they have their work cut out to get back up towards those $11k's. Besides a personal long position, I am currently all cash and patiently waiting for bears to dump price for a potential oversold bounce play or bulls to shift trends with some higher lows and higher highs. Hourly chart for bulls was trying desperately to make a climb but not much follow through. This has me thinking bearish with potential for bear flag on 4-6 hour time frames and a flush below $9k coming soon. Certainly does not have to occur but as a trader, I am leaning bearish which has my trading capital locked up in cash until some clearer opportunities present themselves.
Just My 2 Sats!

USDCAD Long Term Downside SetupUSDCAD Weekly chart gives us an indication of overall price momentum to the downside as price has retested the weekly resistance zone of 1.35200.
Overall a break in upwards channel from
1.34150 has seen USDCAD sustain its shorts over the last 3weeks.
After a break - Price will usually form a pullback/consolidation zone. Perfect for re-entries.
A Weekly Pullback from Support Zone of 1.30200 has encountered yet another wall of weekly resistance of 1.31500.
Weekly Depicted Below
Daily Chart gives us a bearish flag continuation pattern with ideal swing target set at 1.25000
See below D1
Down to the 4HR Chart, a huge range of consolidation confirms our higher time frame bias on going short on USDCAD Overall .
It is important to note that the only driver of higher CAD prices could indeed be fundamental news/ lower OIL prices.
Fundamentally CAD sees itself losing steam gained against the USD as FED may hold true of cutting rates.

3M Sell IdeaD1 - Price has reached the top of the bearish flag, bearish divergence.
H4 - Bearish divergence.
H1 - Price has reached the critical zone formed by the top of the daily bearish flag pattern and the the fibo levels of the cycles. Bearish divergence.
Until this critical zone holds, we may look for more evidences of bearish pressure in order to join the bears.