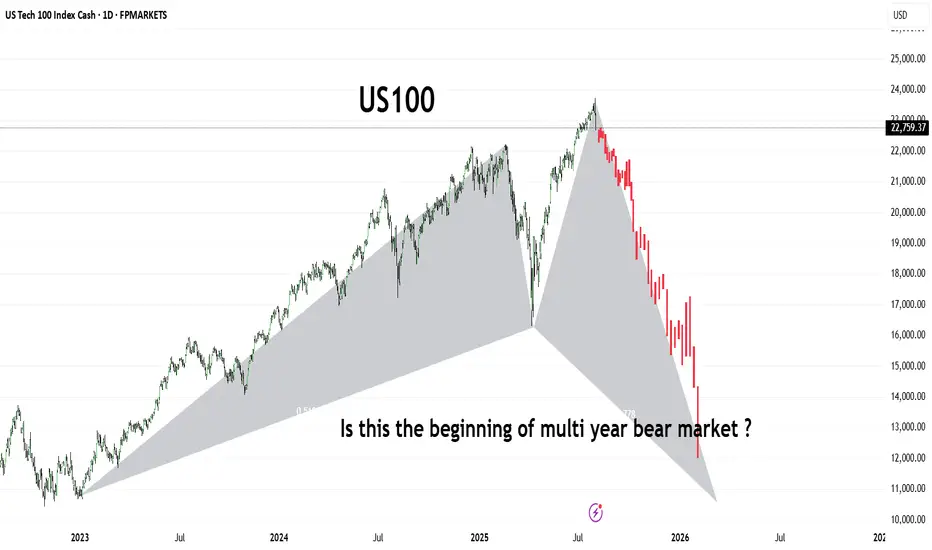
US100The US100 (Nasdaq 100) has shown a dramatic shift in trend, forming what appears to be a large-scale bearish harmonic pattern or potential M-top structure. After reaching its peak in mid-2025, the index has entered a sharp downward trajectory, shedding significant value in a short span.
This chart raises a critical question for long-term investors and traders:
Are we witnessing the early phase of a prolonged bear market that could stretch into 2026 and beyond?
🔻 Key Observations:
Bearish structure developing with aggressive selling pressure.
Potential breakdown from long-term support trendlines.
Momentum suggests institutional risk-off behavior.
Stay alert for macroeconomic cues, interest rate policy, and earnings season signals. A break below 13,000 could confirm a deeper bear cycle
Bearishmomentum
Get out now! Bullmarket might be over This is LMACD applied to GC with reduced lag. If this time is not different we just had our cycle top ~123k. Sell some coins and buy back around 2026 ~44K

Bearish Retest Setup After BreakdownPrice broke down from the recent bounce and lost the 0.098–0.101 zone, which lined up with the 23.6–38.2 fibs. That area is now likely to act as resistance. Momentum is still bearish. MACD histogram is red and expanding, and no signs of reversal yet. On the daily timeframe, MACD has just started to cross bearish, which adds weight to the downside bias.
If price retests that 0.098–0.101 area and shows weakness (like rejection wicks or small-bodied candles), it’s a clean short opportunity. First target would be the recent low around 0.092, and if that breaks, the next key level is 0.077.
Any push above 0.102 would invalidate the setup for me.

NIFTY 24740: Smart Money Signals Bearish Move IncomingThe directional bias is clear – bearish – and I'm currently waiting for a precise setup to present itself. Based on the Smart Money Concept, we could be looking at a potential short opportunity around the 24740 zone.
📍 Once the setup is confirmed, I’ll be sharing the exact entry and stop-loss levels with you.
Stay tuned – patience here is key. Let the market come to us.

GBP/JPY 4H - Rejection from Supply Zone and Key Fib AreaOverview:
GBP/JPY is trading near 197.91, and recent price action suggests a potential short opportunity. The pair has been rejected from a key Fibonacci resistance zone, and bearish momentum appears to be building beneath a fading ascending channel. Let’s break down why this chart leans more bearish.
Market Structure Breakdown:
* Price action failed to sustain new highs above 199.90 and is now forming lower highs, a potential early sign of trend exhaustion.
* The recent bounce from 197.40 was muted and rejected near the 0.5 and 0.618 retracement levels, indicating strong supply around the 198.68–198.98 zone.
Fibonacci Confluence:
* The rejection occurred right at the 0.618 retracement of the prior downswing — a key Fibonacci level often used by institutional traders to re-enter in the direction of the trend.
* Price is now hovering below the 0.382 (198.38) and 0.5 (198.68) levels, which may now act as resistance.
* If the current rejection holds, downside targets are:
* 0.0 (197.40) – recent low
* -0.27 extension (196.70) – potential bearish continuation target
* -0.618 extension (195.81) – extended downside objective
Trendline & Channel Considerations:
* The ascending channel is losing momentum.
Moving Averages:
* Price is now below the 50 EMA, and testing the 200 EMA, which is at risk of breaking.
* A clear close below both EMAs would confirm bearish momentum.
RSI & Momentum:
* The RSI shows bearish divergence on recent highs and is struggling to break above the midline (50).
* Momentum is tilting to the downside and failing to build higher on bounces.
Key Zones:
* Resistance Zone: 198.60–198.98
* Strong Fibonacci confluence + previous supply
* Support Zone: 197.40
* Prior swing low and 0.0 Fib level
* Bearish Continuation Zone: Below 197.30
* Breakout would confirm downside acceleration toward 196.70 and 195.80
Conclusion:
GBP/JPY is showing signs of bearish pressure beneath key resistance. With the rejection from the 0.618 Fib level and weakening channel structure, the path of least resistance may be to the downside — especially if price breaks and holds below 197.40.
A confirmed breakdown opens the door toward 196.70 and possibly 195.80, as bearish continuation unfolds. Overall we can even see price hitting past historical levels at 189.50

Bitcoin Eyes $200K: Why a Correction Could Come FirstAs Bitcoin continues its remarkable run, optimism is high that we could see BTC break the $200,000 mark this year. The momentum is there, with bullish sentiment across the crypto and traditional finance spaces. Yet, it’s important to acknowledge a potential short-term correction ahead before new highs are reached.
Why a Correction May Happen Soon
Several factors point to a volatile period in the weeks ahead:
Upcoming Tariffs: On August 1st, the new round of tariffs announced by President Trump is set to take effect. Trade disputes historically introduce uncertainty into global markets and can sap risk appetite, even in alternative assets like crypto.
Federal Reserve Policy: The Federal Reserve has not yet begun lowering interest rates. High rates continue to pressure both equity and crypto markets by making cash relatively more attractive and increasing the cost of leverage.
Geopolitical Tensions: Ongoing instability in the Middle East adds another layer of unpredictability. Geopolitical flare-ups often lead to market volatility as investors act defensively.
The Takeaway
While Bitcoin is on track to reach unprecedented levels this year, investors should remain mindful of the broader market context. Short-term corrections are part of any healthy bull run and can be driven by macroeconomic and geopolitical events. Staying informed and maintaining a disciplined approach will be crucial for navigating what promises to be an exciting—and eventful—rest of the year.
Not Investment Advice!
#crypto #bitcoin #short #correction #dump #uncertainty #volatility #war #news #bearish

EURCHF new bearish push expecting
OANDA:EURCHF FALLING WEDGE we are have, in moment its be breaked, price is also be and on trend line with FW, i am expect price will continue pushing, but looks like we will have break of trend line and bounce on sup zone 0.93950
SUP zone: 0.94000
RES zone: 0.92450, 0.92000

Lighten Up! After a rounding bottom where it looked as though the bulls were forming a base, we now see a long bearish red candle hinting at the bears denying a bullish breakout. I wouldn't close positions here, but I would lighten up on longs. Follow me for more simple to understand expert analysis. Thank you for reading. Now get out there and trade! :)

Bear market coming soon Btc goes to 50,000$2️⃣ Daily Chart (1D) Analysis
🔍 Key Observations:
Price is consolidating below EMA and inside the red supply zone (0.618–0.65 Fib).
200 EMA is acting as dynamic resistance (around $85K).
Bearish structure with a lower high formation.
💡 Interpretation:
Current price zone (~$86.3K) is a potential short trigger area.
If rejected here, price may drop first to GETTEX:82K (0.786), then $74.5K.
If price breaks above GETTEX:92K (0.5 Fib), this bearish setup is invalidated.
✅ Suggested Trade Setup
Parameter Value
Short Entry $86,300 – $87,900
Stop Loss $92,500 (above 0.5 Fib)
Take Profit 1 $82,000 (0.786 Fib)
Take Profit 2 $74,500 (1.0 Fib)
Take Profit 3 $52,800 (1.618 Fib Extension)
Risk/Reward 1:3 or better

Bitcoin is Headed to $36K And It’s Happening NOW!This might not be the most popular opinion, especially among those who still believe the current Bitcoin bull cycle hasn’t ended. However, I encourage you to take a few minutes, approach this with an open mind, and let me know whether you agree or disagree.
Understanding the Previous Cycle (2020–2021)
The last Bitcoin bull cycle began in March 2020, when BTC bottomed at approximately $3,810. It then surged to an all-time high (ATH) of $69,870 in November 2021, marking the cycle top.
By applying a Fibonacci retracement to this entire range, we can see that the golden pocket (0.618 - 0.786 Fib)—often a key support zone during bear markets—fell between $17,700 and $28,690.
Looking at the chart, BTC beautifully retraced into this zone, even dipping slightly below it to form a cycle bottom at $15,500 in November 2022.
The key sign that the bear market had ended and a new bull market had begun was when Bitcoin broke above the 0.786 Fibonacci level of the previous cycle and established a higher high on the weekly chart. This marked a clear shift from a bearish to a bullish market structure.
The Current Cycle (2022–2025)
From the November 2022 bottom, Bitcoin rallied, setting a new ATH at $73,600—just slightly above the previous peak. After some consolidation, it found strong support at the 0.236 Fib level of the previous bull cycle, signaling that the uptrend was still intact.
The real breakout came when BTC surpassed the psychological $100,000 level and consolidated around the -0.5 Fib extension of the previous cycle. The cycle top appears to have been put in after Donald Trump took office in January 2025, marking an approximately 26-month bull run—longer than previous cycles.
However, a major bear market confirmation signal has now emerged: BTC has decisively broken below the 0.236 Fib retracement of this cycle, which historically signals the end of a bull market and the beginning of a new bear phase.
Where is the Next Bottom?
By analyzing the Fibonacci levels of both the previous and current bull cycles, we can identify key potential support zones where Bitcoin may bottom out:
1. $51,370 - $53,700
• This range aligns with:
• 0.236 Fib of the previous bull cycle
• 0.618 Fib of the most recent bull cycle
• This zone has confluence, making it a high-probability support level.
2. $35,600 - $36,500
• This range aligns with:
• 0.5 Fib of the previous bull cycle
• 0.786 Fib of the most recent bull cycle
• If BTC breaks below the first support zone, this is the next key level to watch.
Historically, Bitcoin bear markets last around one year, so we can expect this downward trend to play out over a similar timeframe.
How to Position Yourself?
For long-term investors, these support zones offer prime buying opportunities to accumulate Bitcoin at discounted prices before the next bull run begins. While the market won’t move in a straight line down—expect bounces and fake-outs—the general expectation is that BTC will find its next higher low within one of these zones.
Looking Ahead: Next Bull Cycle Target
If we use the same -0.5 Fib extension strategy that predicted the previous cycle’s top, we can estimate the next bull market peak. Based on the current cycle’s Fib range, the projected ATH for the next bull run would be around $157,000.
Final Thoughts
While nobody can predict the future with certainty, historical price action, Fibonacci levels, and market structure provide strong clues about where BTC is headed next. As always, flexibility is key—if market conditions change, so should our expectations. But if history repeats itself, these levels offer a solid framework for identifying the best entry points and positioning for the next major bull run.
What do you think? Do you agree with this analysis, or do you see it differently? Let me know in the comments!

DOGE 4HR Analysis Here is the current 4 Hour range within the 1st zone I was looking for.
Personally, I still see more downside as bears are still in control. There is potential for a breakout on the 4HR but confirming congruence on the Daily has me hesitant as the Daily Timeframe would still hold a downward trend.
——————————————————————
Diving further into the structure of the candles I noticed there are more wicks from the bottom side of the candles than the top; a confirmation bears and the downward trend are still in control.
Bulls are starting to defend this level, but to me it’s a sign that buy side liquidity it being created.
If I’m a seller, this is a great place to manage risk for further downside.
If I’m a buyer, I’m being patient as the retracement back to supply seems to be almost over.

Sweet Spot To Sell The BTC Pullback In a strong downtrend. Every pullback on the 4hr and Daily chart will be hyped by the bulls & super cycle evangelists as a "WE'RE BACK" moment.
I will continue to take this same setup, selling Major swing highs on 4HR & Daily chart on BTC until the Daily Chart flips bullish. Until then or some news come out, we will remain in the downtrend until we hit the target shown in my last analysis, see link below.

potential NASDAQ bearish reversal in the makingThe Nasdaq appears to be showing signs of a bearish reversal as technical and macroeconomic factors align against further upside. After a strong rally, the index is encountering key resistance, prompting concerns among traders about the sustainability of the recent gains.
A pinbar candlestick pattern has emerged, signaling potential downside as buyers fail to sustain momentum. Historically, such formations indicate a rejection of higher prices, often leading to further declines. Additionally, selling pressure on rallies suggests that market participants are taking profits rather than betting on continued strength.
From a momentum perspective, the Moving Average Convergence Divergence (MACD) indicator is beginning to roll over, hinting at a potential shift in trend. If this bearish momentum continues, the Nasdaq could face increased selling pressure in the coming sessions.
Beyond technicals, fundamental factors are adding to the uncertainty. The announcement of new tariffs under former President Donald Trump’s trade policies is weighing on market sentiment. Moreover, while Federal Reserve rate cuts are traditionally viewed as bullish, historical data suggests that in some cases, they coincide with economic slowdowns, leading to weaker market conditions.
Looking at key downside levels, support can be found at 18,400, where buyers might attempt to stabilize the market. A break below this level could accelerate losses toward 16,500, a critical zone where stronger buying interest may emerge.
Traders should closely monitor price action and market reactions at these levels. Confirmation of bearish signals and continued weakness in bullish sentiment could pave the way for a more extended correction. Caution is advised, with risk management strategies essential for navigating the potential downturn.

#GNOUSDT remains weak after a strong drop📉 SHORT BYBIT:GNOUSDT.P from $181.40
🛡 Stop Loss: $186.50
⏱ 1H Timeframe
✅ Overview:
➡️ BYBIT:GNOUSDT.P experienced a sharp rally above $210, followed by an equally strong pullback.
➡️ The POC (Point of Control) at $187.27 indicates the highest liquidity area, which serves as a strong resistance level.
➡️ Price is consolidating below $183.12, signaling potential seller dominance.
➡️ If $178.55 breaks downward, further decline toward $175.30 is expected.
⚡ Plan:
➡️ Enter short upon a confirmed break below $181.50.
➡️ Stop-Loss placed at $186.50, above the resistance zone.
🎯 TP Targets:
💎 Take Profit1- 178.55
🔥 Take Profit2- 175.30
🚀 BYBIT:GNOUSDT.P remains weak after a strong drop—expect further downside.

Saying the quite things about TSLA out loud...This is my first chart art.
Hope you all find humor in the awful situation that is TSLA.
I do NOT see any situation where TSLA remains a Trillion Dollar market cap company for the next 4 years. Their cars are being sold used at historically higher volume, demand has gone down and their new model Y... WHY would someone buy that when the CEO and founder is sieg healing behind the podium the same day where the American Equivalent of the nuremberg laws are signed into law.
Behind the insanely bearish optics, the fundamentals have always been overvalued. TSLA is not a tech company. It's a car company built off the top of liberal ideology. It's founder is in an "open loop" or more accurately a "broke loop". He has chosen to support policy that harms his stock, such as removing the EV credit that has contributed to their profitability. Worse still, the acquisition of Twitter, using TSLA as collateral will inevitably result in a defaulted loan. Compounding still, further, he is borrowing money from new investors to fund xAI, which has no real value compared to OpenAI and is, itself being used to pay back the defaulting loans backed by TSLA.
This is a literal PONZI scheme, ran by someone who has put the entire fate of his company in the hands of a convicted fraudster with 7 bankruptcies under their belt.
It is a literal, red nazi flag.
Nothing NEO about it...

Bearish trends in the days ahead. Hello,
To all my folks who are trading forex. Right now everything has been going crazy with all the news across the world.
One thing can be sure is the USD is reigning supreme. With a guy sitting at the big White House in DC. Be rest assured he wants to be first at everything. He wants US first in everything. It’s only a matter of time before things start to reflect certain aspects of that. Especially the USD.
So let’s take a look at what the EUR has been doing for a while! What it has been doing for a long time is falling.
Things will continue to be that way. If we extend the times on the chart to 4hrs, day, week and even month. You can see that things are looking to trace back to low’s that haven’t been hit in years.
Of course, things will always have to retrace, you will have your support and resistance levels. That’s a gimme. It’s what we do at those levels is what will define these future trades.
At this time. It’s time to throw the towel in and admit. We are in a EUR/USD downtrend for a long time to come.
As always, research your entries, confirm your strengths and look for opportunities to trade smarter. If you enjoy this publish idea, please follow and boost this up.
- Thank you

EUR/USD (EU) Analysis (Daily Timeframe)Recently, we’ve observed a distribution phase in EUR/USD, followed by a markdown , confirming the overall bearish trend visible on both the daily and weekly timeframes.
Key Observations:
Bearish Structure:
On the daily timeframe, price is consistently creating supply zones and showing strong reactions to them.
The market structure confirms the downtrend with the formation of lower lows and breaks to the downside.
EMA Interaction:
The price is currently surfing downward along the EMAs , which are acting as dynamic resistance and reinforcing the bearish momentum.
Scenarios to Watch:
Continuation: Price could continue its markdown, heading toward the short-term target and potentially testing the psychological level of 1.0000.
Re-distribution: There’s also a possibility of a move upward, creating a re-distribution phase to accumulate enough liquidity for a stronger push below 1.0000 .
Fundamental Insights:
Strength of the US Economy:
The US dollar remains strong due to:
Higher interest rates maintained by the Federal Reserve to combat inflation, which increases the demand for USD-denominated assets.
Strong labor market data , with low unemployment and rising wages supporting consumer spending.
Positive GDP growth , reflecting resilience in the US economy despite global economic challenges.
Weakness in the Eurozone:
European economies are facing multiple headwinds, including:
Energy concerns driven by geopolitical tensions, leading to higher costs for businesses and consumers.
Slow economic growth as inflation continues to weigh on consumer spending.
Divergence in monetary policy , with the European Central Bank (ECB) appearing more cautious about aggressive rate hikes compared to the Fed.
The combination of these factors makes the USD fundamentally stronger, while the EUR struggles under the weight of economic and geopolitical challenges.
My Perspective:
Given the strong bearish structure, EMA surfing, and fundamental backdrop, I expect further downside momentum. However, the possibility of a re-distribution phase cannot be ruled out, especially if liquidity is needed to push below the 1.0000 level. Staying cautious and reactive to price action around key levels will be crucial.

HEY SPYLOVERS ! Here is a Video Analysis on SPY (Price & Levels)Very strong movements and levels that we need to closely monitor, as we are entering a bearish market. We must exercise great caution during this decline and ensure that the price does not exceed the mentioned levels; otherwise, it will be cause for concern.
Best regards, and thank you for supporting my analysis.

Bitcoin at Critical Support: Will It Hold or Breakdown?We’re currently looking at Bitcoin on the weekly chart with 6 days remaining before this candle closes. It’s sitting at a key support level of $93,416.91, and Bitcoin needs to maintain this support for the bullish momentum to continue. If this critical support level breaks, we could see a bearish crossover, with the 9 EMA crossing below the 4 SMA. This could trigger a sharp decline and potentially lead to a panic sell. The next key support is at $87,328.39, which we’ll need to hold. We’ll revisit this analysis when the next move unfolds. If you found this helpful, please hit the like button.

S&P 500 Early Bearish SignsStill bullish as long price finds support at 21 weekly SMA and weekly RSI > 50

Pfizer Ltd. - Short Position AnalysisChart Overview:
The chart indicates that the stock is in a clear downtrend, following a descending channel pattern. The price is nearing a key horizontal support level (marked in black), and a breakdown below this level may present a shorting opportunity.
Trade Setup for Short Position:
1.Entry Trigger: Below ₹5,028 on a daily closing basis.
2.Targets:
Target 1: ₹4,885 (first demand zone).
Target 2: ₹4,760 (strong support and lower boundary of the descending channel).
3.Stop Loss: Above ₹5,187 (recent swing high and red-dotted resistance level).
4.Risk-Reward Ratio: Ensure a favorable ratio of at least 1:2.
Alternate Scenario:
If ₹5,028 holds as support, the stock might see a pullback toward ₹5,187, where selling pressure could resume.

USDJPY: Bearish Break in FocusHello Traders,
Below is my analysis of USDJPY currency pair from H1 perspective.
Trend & Sentiment
USDJPY is in a strong downtrend, forming lower highs and lows. The recent break below 153.819 confirms bearish momentum, with sellers firmly in control.
Key Levels
Resistance: 153.962 (Minor), 154.653 (Major)
Support: 153.276
Possible Movement
Bearish Continuation: Likely toward 152.466 (target) as long as the price stays below 154.653.
Retracement Risk: Minor resistance at 153.962 may cap any short-term bounces.
Reversal Signal: A break above 154.653 could shift momentum to bullish.
Conclusion
The outlook remains bearish with a focus on 152.466, while resistance at 154.653 defines the trend's invalidation point.
Do let me have your thoughts.
Cheers and happy trading!

EURCAD: Bearish Momentum in PlayHello Traders,
Trust trading has been awesome for you.
Please find below my analysis of the EURCAD currency pair from H4 perspective.
Trend & Sentiment
The pair remains bearish, forming lower highs and lows. Sellers maintain control, though the current consolidation suggests temporary indecision, even though price is facing resistance around the 1.48591.
Key Levels:
Resistance: 1.48591
Support: 1.47211
Possible Movement
A break below the equilibrium at 1.47993 could accelerate bearish momentum toward 1.47211 and 1.45831. A short-term pullback to the resistance at 1.48591 is possible (as we saw the buyers temporarily pushed above this region and closed back below it) but likely to face renewed selling pressure.
Short-Term Target: 1.47800
Medium-Term Target: 1.47211
Long-Term Target: 1.45831.
This trade may last from now till 22nd November or beyond to fully unfold.
Conclusion
The bias remains bearish, with a focus on the downside targets unless the price breaks above 1.48898 to challenge the trend.
Cheers and happy trading!
