DXY potencial sellHi everyone, dolar index is making some 1h correction now, and first i expect some small drop to make new lower low in that correction, then price will push higher to make new higher high in 4h correction and confirm expanded flat, so my view on dolar is bearish, be patient traders and wish you a lot of profits :) Please fell free to comment and share your opinions!
Bearishmomentum

BITCOIN DROP => Follow the Rectangle - 8k AHEAD!Hello followers,
BTCUSD bearish movement is ongoing as shown at the last chart.
Now, a sharp move DOWN is about to HAPPEN.
Be Aware!!
Thanks for Trusting and Following,
MW

Money flowing out of the market & a major momentum switch!!The market is bouncing around key support & resistance levels but some of them are soon due to be broken. The squeeze momentum indicator is signaling a first bear run since the drop in February–March. Also, the money flow index indicates that the money is rapidly heading out of the market.
When combining technical analysis with the fundamentals of the economy I see it more than suitable for the market to see a major pushback.

NZDCAD- Bearish Momentum On The Reversal Of The Supply Zone!-Very good opportunity to sell at the supply zone which is in confluences with the 38.2% level.
-The Ema is above price suggests Medium term bearish momentum on the pair.
-Price previously broke the ascending channel which is also another indication that price could retest the supply zone and then we could start to see bearish momentum for this pair.
Wait for price to reach the zone and look for bearish candlestick formation to enter this pair.

AUD/USD Short Entry 15 Minute Timeframe Good Risk RewardLooking for downside to first fib target. Quick UK session move. I wont go into why I am taking this trade. I do like this short setup good risk reward.

DKNG is a fat pig of a stock and it is about to get butchered.I mean they have outstanding debt and their price has been pumped up during a time where consumer traffic is less than their usual. I personally think a negative earnings is coming and it will hit the price hard.
I do not usually have a position during earnings but this stock slapped me in the face twice and I think having a put on it will be a safe trade. Possible upward movement is their recent high of 28 dollars and downward movement could result in a price of 17-19 dollars.

NZDUSD Bearish Momentum FX:NZDUSD My analysis for the upcoming week 4h trendline support broken, Opening of Market could be a fake bullish move then will work back to break 0.59269 Area & retest, Overall Bearish week / RR 1:3

Double Top & Bearish Momentum, 70% Sell OpportunityChart Patterns: "Double Top", "Adam & Adam"
Candlestick Patterns: "Strong Bearish Momentum"
Entry price: 1.24000
Stop Loss Price: 1.24762 (76 pips)
Take Profit Price 1: 1.22994 (100 pips)
Take Profit Price 2: 1.22472
Take Profit Price 3: 1.21635
Estimated Duration: 1-3 Days
Probability to Meet 1st. Target: 70%

NZD/USD Sell?My current thoughts on NZD/USD
Multiple tests of resistance at 0.61000 which I think killed the bullish momentum for awhile. My thoughts is that is that the market will move down to test support around 0.59500

USDCHF Bearish Momentum MarketMarket is overall sell so far and bear weighing against bull. Probably we may see some new lower highs and lower lows further.

USDCAD Bear In ActionBear are ruling the market on this major pair and knowing the fact how well aussie and kiwi buddy of loonie in AUDUSD | NZDUSD performing lately against buck I reckon this two buddies are together counter striking buck viciously. No positive sign for DXY yet and seems total stagnate talking about the price action for that index and the fact how pound and euro kicking butt of buck too I assume at this point we should not consider a strong king ( buck ).

GOLD on a Bearish Trend Line => Buckle up and Hold On!Hi followers,
GOLD reached a big resistance
Bearish Trend Line ongoing.
Buckle up and Hold On!
Going Down..
Enjoy => It's free!
M.W.

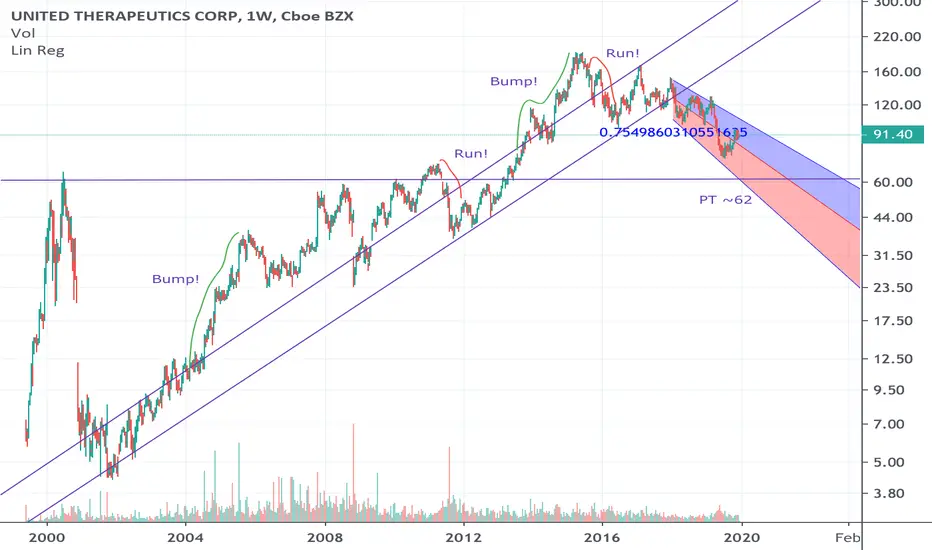
UTHR DetrendedUTHR has detrended from its major upward trendline, bearish moves probable. PT~62. Strong regression trend of 0.75.
NZDUSD - FURTHER DOWNSIDE ?NZDUSD on the weekly timeframe looks to create a closing bearish engulfing candle.
With data from the US still topsy turvy / if, but, maybe a trade deal, then the uptick in NZD may have to wait a while until it finds buyers at a lower level around the 0.6090 August 2015 spike.
Trades to the long side of NZD are increasing but the strength in USD may well keep it subdued. Maybe look to trade it against a weaker currency ?
Keep a look out next week on the price action to see if NZD drops below previous structure lows for clues to see how much further the downside will be.

Why BITCOIN WAS STUCK ON 10K ? Follow the Week Wave!Hello followers,
It is great to be back on TradingView, I love this job.
So, the big question is, why were all the bulls wrong??
Why BTC bulls got trapped on 10k, and now are running scared from BEARS...
That is not an easy question, but single numbers could tell a lot.
Check out these numbers of accounts and how many coins they have. If you check closely you will see that few accounts have most of the coins.
bitinfocharts.com
On the stock market and crypto, and everything you can sell, normally, less available means more expensive, or higher price.
So, one way to trick the market is to re-buy your own shares or concentrate it on few hands, so others will try to buy it and not be able.
But, and this is important, notice I said, "TRICK" the market. That means, it is not natural.
Eventually, investors will see that manipulation is happening, and will notice that price is not in the right place, but overbought.
A while ago, I stopped doing BITCOIN ANALYSIS because I could see manipulation on the chart.
Suddenly my analysis were not working as they used to work.
Now, everything changed, and that is why my charts are working again.
Investors are not buying it, because many difficulties are ahead, and there was another bubble...
What you are looking at is a weekly chart, main resistances (red) and main supports.(black) and Next Targets..
Let's ride the wave.
Good Luck

BITCOIN - #BTCUSD - ANOTHER RESISTENCE ON THE LINE - TARGET HIT!Hello Everyone,
When everybody was calling Bull, we called SHORT, and there it is, the chart worked like a charm.
The target of U$ 8.226 was hit, and now a new resistance line is ahead of the price, that means will need a lot more strength to back to go back to 10k.
A new broker is open bakkt, this move down hard could be related to investors making huge bets on Bitcoin fall.
I will make another analysis to see what could be ahead.
Stay tuned.
Thanks for Following and trusting.

Head and Shoulder Chart Pattern on BCH EURDear Reader,
As I was reading charts, I came across this head and shoulders pattern. This pattern is highly respected and valued among traders.
As addition to the Pattern the MACD is crossing the signal line, giving an indication of bearish momentum. The Price seems in an stable (as the RSI indicator shows)position and has room to move. I am excited to see if my prediction will be a successful one.
Warm regards,
Morning Light,

GBPAUD - looking for a good price to re-enter short!From my last post on this pair, we did see that push to the downside based on a couple of economic factors. First the speculation of the RBA cutting rates did not occur like I suspected. Instead the rates were held in at 1.50%. Keep in mind we know the RBA will cut rates and now we might see that come in as early as next month as they have now stated 3 rate cuts might be occurring this year. That tells us those have already been priced into the market. Looking at things from the pound’s perspective, we have the Brexit dilemma which keeps getting a twist especially with the resignation of Theresa May. A lot of rumors are going around that Pro Brexiters will push for a no deal while the other extreme want to remain in the EU. The British will not be able to renegotiate the deal May made with the EU. Hence two things, either they revoke Article 50 or a hard Brexit will happen and it won’t be pretty.
Moving to the technical analysis of this pair, I am looking for a retest of the 1.85 - 1.86 area as we currently sit on a temporary support to re-enter going short on this pair. The MACD confirms the bearish divergence just like I mentioned in my last post and with the fundamentals looking better for the Aussie, I am looking for this currency to pick up some steam. We should be seeing the 1.82 Price area once again.
Remember, patience is key! GL
DISCLAIMER!!!!
My Ideas are mine and mine alone and are only to provide my perspective of the current market situation. Do not take my posts as trading decisions for entries or exit. Trading the FOREX market is very risky and indulge in it at your own risks!

[H] EURUSD Long Possible Position [BULLISH PENNANT]Quick observation on EURUSD Hourly. We see a pennant forming with some consolidation and resistance support line of the pennant. We could see a price move up and break past the resistance to then hit top of pennant at price of 1.132. Over all target for me is 1.134 due to daily chart in a channel at the moment. Will take out profit slowly and use a SL to cash out if price decided to drop.

Bitcoin: In A State Of Wait. Back To 3600?Bitcoin update: Since my recent report on here, this market continues to linger at the 4K resistance level. We have written a number of articles and posted numerous charts in our chatrooms, reiterating over and over as to why the best trade right now is no trade at all. It may be common sense to some, but many are still getting caught up in the noise, especially when looking at smaller time frames. An important lesson that is often overlooked is being able to judge the quality of your trading environment. Not all environments are created equal. Some are better for position trades, while others are more conducive for short term strategies. And for those who do not carry any Bitcoin inventory, the current environment does not offer attractive reward/risk for putting any new money to work.
Since we do not day trade Bitcoin, or short it, the environment needs to fit very particular constraints in order for it to be worthy of taking on additional risk. This is a range bound market, clear and simple. The low 4K area is still the range resistance, while the lower 3K area is the range support. While we do hold inventory (position trade), it has been weeks since we have shared a swing trade. If you can't understand why, I have highlighted how we visualize the reward vs. risk within this environment. The green box is how we view potential reward, while the red box represents the potential risk. Why would we put on any new swing trades at range highs when chances are price is more likely to test much lower levels in the short term?
Evaluating probabilities is what drives our decision making process. and many elements are considered, not just a simple candlestick or RSI signal. The fact that price is beginning to show signs of structural weakness confirms our reasoning that staying out of any new swing trades near the range highs is the best choice for now. Support levels begin around the high 3600s and continue through to the 3450 level. We don't pretend to know where price is going because we are not marketers. We do know where the support is and IF the market offers an opportunity to buy in those areas, then we are prepared. That is the best we can do as outsiders (working with public information). We exercise things that we can control like the amount of risk we take, and WAITING for the best possibilities. Sticking to these best practices is why our performance record is green.
In summary, Bitcoin along with the entire space may be in the process of building a broader recovery over the long term, but the short term is just not in a position that offers attractive reward/risk. Although supply may be slowly removed from the market (Andrew wrote a recent article detailing his observations), it will take some time before the effects play out. So we will continue to WAIT for two particlar scenarios: price retraces toward the lower part of the range for a reversal to go long OR price breaks beyond 4150 and provides a momentum continuation pattern for a long. Since WAITING does not cost anything, we can WAIT for as long as it takes. Meanwhile, there are plenty of opportunities in the Forex and Stock markets. What would you rather do? WAIT for a high probabilitiy setup while losing nothing or take every setup and erode your account while getting caught up in noise?

CADJPY expect possible breakthroughSince the turn of the year the pair has seen bullish recovery but that seems to have halted, for the time being anyway, expect the pair to veer back toward the Oct 2018 bearish trend with the possibility that we witness a breakthrough of the support area through to 61.8 on The Fib. SHORT

Potential Bear flag on BTCI think that the bottom is yet set.
I feel that a last drop with "blood on the streets" is around the corner.
Time wise, i think that the last move will happen in Q2 2019.
After that the consolidation period will commence.
According to this idea, we might see BTC as low as 1850, but in different analysis methods I expect a bottom at 2600-2800 USD

GBP/USD 30 mins chartsGBP/USD after last 2 days ascending rally , now is under pressure . We will prefer short positions below 1.3075 .
RSI was overbought for the last 2 days . Time to retrace
Thank you .
If you like our chart , you can find more on our telegram channel most updated charts : @FX , bearish vs bullish
P.S Brayzil Team
