$VET USD 1HR INCOMING PUMP?Structure & Zones
Price is trading between a clear supply zone above and a demand zone below, offering defined areas for reaction.
Two unfilled FVGs on the 1D timeframe above current price could act as magnet zones for price continuation.
A 4H FVG just beneath current price is nearly filled — potential area for a bullish bounce.
Three psychological price levels are marked and align with Fibonacci and FVG targets, likely to act as resistance zones if price pushes higher.
Trend & Pattern
High timeframe (HTF) remains bullish, supported by the formation of a rounding bottom — a strong reversal structure suggesting accumulation.
Lower timeframe (LTF) is showing short-term bearishness as price pulls back and retests key support/trendline.
Price is holding above a bullish trendline, maintaining structure unless a breakdown occurs.
Volume & Momentum
The OBV indicator shows a broken rising wedge, signaling a possible momentum slowdown or short-term correction.
Anchored volume profile reveals high volume beneath price — indicating that previous trading activity supports current levels and adds bullish confluence.
Outlook & Trade Consideration
Bias remains bullish overall, supported by HTF structure and unfilled FVG targets above.
A potential pullback into the 0.5–0.618 fib retracement zone or into the 4H FVG could present long entry opportunities.
On continuation, price may target the daily FVGs and psychological levels as resistance or take-profit zones.
Watch for a rejection at fib/psych levels or breakdown below the bullish trendline to reassess bias.
Bearishpattern


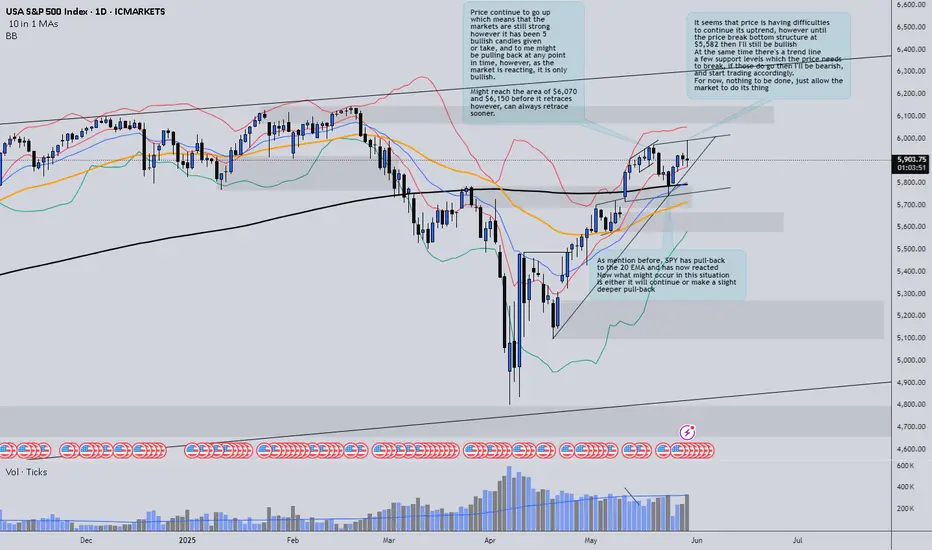
SPY update - still bullish!In today’s session, we saw an increase in volume without significant price movement. This could indicate underlying uncertainty or a potential shift in momentum.
At the moment, price is still respecting a key trend line and several support levels. Until these are broken, it's too early to confirm whether the broader market is turning bearish.
🧠 I also want to point out that the price is forming an ascending channel, often a reversal pattern, especially when occurring at market highs. While we’re seeing some bearish signs, it’s crucial to remain patient and let the market show its hand.
📊 As always, the key is to observe, not assume, and be ready to adapt as the price action develops.
Thanks for watching the update, I hope it brought some insight and value to your trading journey!
Bitcoin (BTC/USD) – Rising Wedge Pattern Signals & BreakdownThis chart illustrates a Rising Wedge Pattern on the weekly timeframe for Bitcoin (BTC/USD), which is generally considered a bearish reversal pattern in technical analysis. The pattern appears after a strong upward move and typically signals that the price is losing momentum and may be preparing for a significant correction.
📐 What is a Rising Wedge Pattern?
A rising wedge is a chart pattern formed when the price consolidates between two upward-sloping trendlines – the support line (bottom) and the resistance line (top) – with the two lines converging toward each other.
As price climbs higher, it forms higher highs and higher lows.
However, the slope of the highs is less steep than the slope of the lows, showing a loss of bullish strength.
Eventually, the price breaks below the support line, often leading to a sharp move downward.
🔍 Key Highlights from the Chart:
📌 1. Major Resistance Zone (~$110K–$120K):
BTC is currently facing heavy resistance in this area.
This zone has historically acted as a supply zone where bulls have struggled to break through.
Multiple rejection wicks indicate strong selling pressure.
📌 2. Pattern Touchpoints:
BTC has now formed multiple touchpoints on both the support and resistance lines of the wedge, confirming the structure.
This gives the pattern higher validity from a technical analysis perspective.
📌 3. SR Interchange Zone (~$65K–$70K):
This is a key horizontal zone where past resistance could act as future support.
A successful breakdown may first test this level before continuation.
📌 4. Retesting After Breakdown:
After breaking the wedge support, a retest of the broken trendline is often seen.
If the retest is rejected, it confirms the breakdown and opens the door to deeper bearish movement.
🎯 Target Projection:
If the wedge breaks down and the bearish scenario plays out, we could see Bitcoin fall to the $22,000–$25,000 region – marked as the final target zone on the chart. This level aligns with:
Previous macro-support zones from 2021
Fibonacci retracement levels
Psychological price levels where buyers may re-enter
⚠️ Bearish Factors to Watch:
Bearish divergence on indicators like RSI or MACD (not shown on chart but worth checking)
Volume decreasing as price rises – a classic wedge behavior
Macroeconomic headwinds or Bitcoin halving-related exhaustion
Rejection from major resistance with strong bearish candles
🕒 Timeframe & Patience:
This is a weekly chart, which means the pattern will play out over weeks or months, not days. Patience is key. A clear break, retest, and rejection would be the most reliable confirmation to expect further downside.
✅ Invalidation Scenario:
If BTC breaks above the wedge resistance line with strong bullish volume and holds above the $120K level, this bearish thesis becomes invalid.
In that case, BTC could enter price discovery mode, making new all-time highs.
💬 Final Thoughts:
This analysis is a technical outlook, not financial advice. Always use stop-loss strategies and manage your risk carefully. Market sentiment, news, and macro factors can quickly shift the scenario. However, from a purely technical standpoint, the rising wedge pattern is a powerful signal that should not be ignored.

$GOOGL the pattern is there, target $152, short setup.NASDAQ:GOOGL You tell me. This looks so ready to go back below $150. My target is $152. I am entering puts right now with a strike price of $150 for 6/20 starting at $1.33 entry. I will add some on a push towards $167-$168. I will give up if it pushes through or holds at $170. This just looks to good TECHNICALLY in my opinion. I will keep you updated. I am willing to watch this position go down 65% where I will consider selling; looking at price and time to expiration. We are not out of the weeds yet when it comes to political rhetoric regarding tariffs even though this name shouldn't be affected by such because it is software, nothing physical but when the idea of tariffs are spewed the market as a whole reacts in negatively.
WSL.

#VOXELUSDT is in an uncertain zone📊 BYBIT:VOXELUSDT.P Scenario – Potential for Movement in Both Directions!
🚀 BYBIT:VOXELUSDT.P is forming a bullish Falling Wedge pattern — a breakout to the upside could provide a great risk/reward long opportunity!
At the current stage, the BYBIT:VOXELUSDT.P market is shaping a scenario where both directions — long or short — are possible, depending on the reaction to key levels.
✅ Overview
➡️ The chart shows two key formations:
🔻 Bearish Pennant – a bearish continuation pattern, which has already played out to the downside.
🔻 Falling Wedge – a potentially bullish pattern, and price is now near the lower boundary of the wedge.
➡️ A weak bounce on volume is visible, and price is approaching a key resistance zone — a potential target if the wedge breaks out upward.
➡️ If the wedge plays out, a bullish impulse is expected.
Timeframe: 1H
📈 LONG BYBIT:VOXELUSDT.P from $0.03406
🛡 Stop loss: $0.03322
🎯 TP Targets:
💎 TP 1: $0.03456
💎 TP 2: $0.03526
💎 TP 3: $0.03586
➡️ This scenario becomes viable if price breaks and consolidates above the $0.03126–$0.03200 zone, opening the path toward the POC zone at $0.03676.
➡️ Volume should increase on the breakout to confirm momentum.
📉 SHORT #VOXELUSDT from $0.03016
🛡 Stop loss: $0.03126
🎯 TP Targets:
💎 TP 1: $0.02960
💎 TP 2: $0.02900
💎 TP 3: $0.02860
➡️ This scenario activates if the price fails to rise and pulls back below $0.03000.
➡️ Volume should confirm seller pressure.
➡️ The chart shows lower highs — risk of further decline remains.
📍 The price is currently in a critical decision zone , between the short entry level and the potential breakout zone for a long.
📍 The support below is strong — it has held the price several times already. No clean breakdown has occurred yet, which increases the chances of the wedge breaking upward.
📍 Avoid rushing into a position — wait for a clear confirmation in either direction (e.g., strong impulse on volume and consolidation above/below key levels).
📢 General advice on this asset:
📢 Wait for direction confirmation — both long and short setups are valid.
📢 Stay flexible and adjust to the move.
📢 Manage your risk carefully — do not enter without a signal.
🚀 BYBIT:VOXELUSDT.P is in an uncertain zone — the signal could play out in either direction. Watch the key levels and enter only after confirmation!

EUR USD Weekly Timeframe Outlook EUR USD Trade Setup weekly timeframe
On the weekly timeframe EUR USD has tapped on a strong supply level.
this level has also acted as a strong resistance level in the past.
So we will be looking for selling opportunities from the lower timeframe.
Patterns to watch out for.
1. Double Top
2. Head and shoulders pattern
3. Bearish break and retest + it must align with the 0.50 - 0.618 Fib Retracement level for stronger confirmation.
4. Lower timeframe supply levels.
Check next post to see the pattern i found.

JPY/USD: Bearish Triangle Pattern Breakout Towards TargetChart Pattern: Triangle Pattern
Pattern Description
Type: The chart identifies a Triangle Pattern, which is a type of consolidation pattern that can act as either a continuation or reversal pattern depending on the preceding trend and the breakout direction. Triangles are characterized by converging trendlines, indicating a period of indecision in the market as the price range narrows.
Specific Type: This appears to be a Symmetrical Triangle, as the upper and lower trendlines converge at a similar angle, suggesting neither buyers nor sellers have clear control during the consolidation phase.
Appearance on the Chart:
The Triangle Pattern is marked with two converging trendlines:
Upper Trendline (Resistance): Connects the lower highs, sloping downward.
Lower Trendline (Support): Connects the higher lows, sloping upward.
The pattern began forming around March 27, after a sharp downtrend, and continued until the breakout on April 2, 2025.
Breakout Direction:
Symmetrical Triangles can break out in either direction, but they often continue the preceding trend. In this case, the preceding trend was bearish (a sharp decline from 0.006720 to 0.006640), and the breakout is to the downside, confirming a bearish continuation.
The chart shows the price breaking below the lower trendline of the triangle around April 2, 2025, with a strong bearish candle, indicating a confirmed bearish breakout.
Key Levels and Trading Setup
1. Support Level
A horizontal support zone is marked around 0.006640 (approximately 0.00664–0.00665).
This level acted as a base during the triangle formation, with the price bouncing off this zone multiple times (e.g., on March 28 and March 31).
The price has now broken below this support, turning it into a resistance level on any potential retest.
2. Resistance Level
A resistance zone is marked around 0.006705 (approximately 0.00670–0.00671).
This level corresponds to a previous high within the triangle and aligns with the upper boundary of the triangle at the time of the breakout.
After the breakout, this resistance level is where the stop loss is placed, as a move back above this level would invalidate the bearish setup.
3. Target
The target for the breakout is projected at 0.006599 (approximately 0.00660).
This target is likely calculated by measuring the height of the triangle at its widest point (from the highest high to the lowest low within the pattern) and projecting that distance downward from the breakout point.
The chart indicates a potential move of -0.000604 (-0.96%), which aligns with the distance from the breakout level (around 0.006654) to the target (0.006599).
4. Stop Loss
A stop loss is suggested above the resistance level at 0.006705.
This placement ensures that if the breakout fails and the price moves back above the triangle’s lower trendline (now acting as resistance), the trade is exited with a manageable loss.
Trading Setup Summary
Entry:
The setup suggests entering a short (sell) position after the price breaks below the lower trendline of the Triangle Pattern, which occurred around April 2, 2025. The breakout is confirmed by a strong bearish candle closing below the trendline at approximately 0.006654.
Stop Loss:
Place a stop loss above the resistance level at 0.006705 to protect against a false breakout or reversal. The distance from the breakout level (0.006654) to the stop loss (0.006705) is 0.000051, representing the risk on the trade.
Take Profit/Target:
Aim for the target at 0.006599, which is the projected price objective based on the triangle’s height. The distance from the breakout level to the target is 0.000055, or a 0.96% move.
Risk-Reward Ratio:
The risk is 0.000051 (from 0.006654 to 0.006705), and the reward is 0.000055 (from 0.006654 to 0.006599), giving a risk-reward ratio of approximately 1:1.08 (0.000055 / 0.000051). While this ratio is slightly above 1:1, it’s on the lower side for a typical trading setup, so traders should ensure high confidence in the breakout.
Additional Observations
Price Action Context:
Before the triangle formed, the price experienced a sharp decline from 0.006720 (March 23) to 0.006640 (March 27), indicating a strong bearish trend.
The triangle represents a consolidation phase within this downtrend, and the downside breakout suggests a continuation of the bearish momentum.
Volume and Momentum:
The chart doesn’t display volume or momentum indicators (e.g., RSI, MACD). However, a typical confirmation of a triangle breakout would include:
An increase in volume on the breakout candle, indicating strong selling pressure.
Bearish momentum signals, such as an RSI below 50 or a bearish MACD crossover.
Traders might want to check these indicators for additional confirmation of the breakout’s strength.
Timeframe:
This is a 1-hour chart, so the setup is intended for short-term trading, with the target potentially being reached within a few hours to a day.
Market Context:
USD/JPY is influenced by factors like U.S. dollar strength, Japanese yen safe-haven demand, and interest rate differentials. A bearish move in USD/JPY could be driven by a stronger yen (e.g., due to risk-off sentiment) or a weaker dollar (e.g., due to dovish U.S. economic data).
Conclusion
The TradingView idea presents a bearish setup for USD/JPY based on a Symmetrical Triangle Pattern on the 1-hour chart. The price has broken below the triangle’s lower trendline, confirming a bearish continuation with a target of 0.006599. The setup includes a stop loss at 0.006705 to manage risk, offering a risk-reward ratio of approximately 1:1.08. Key levels to watch include the former support (now resistance) at 0.006640 and the resistance at 0.006705. Traders should consider additional confirmation from volume and momentum indicators, as well as broader market conditions, before executing the trade. Since this chart is from April 2, 2025, market conditions may have evolved, and I can assist with searching for more recent data if needed!

Bitcoin (BTC/USD) Breakdown – Rising Wedge Signals Further Drop!1. Chart Overview
This 4-hour BTC/USD chart from BITSTAMP presents a well-defined Rising Wedge pattern, which is a bearish reversal structure typically signaling an upcoming price decline. After a strong upward movement, Bitcoin formed a wedge pattern with higher highs and higher lows converging. This indicates weakening bullish momentum, leading to a confirmed breakdown.
2. Key Technical Elements & Market Structure
A. Rising Wedge Formation (Bearish Pattern)
A rising wedge is a bearish reversal pattern that appears after an uptrend, showing gradually weakening buying pressure.
The chart shows that price action was following an upward sloping support and resistance trendline.
The higher highs and higher lows formed within the wedge indicate a loss of bullish momentum.
Eventually, the price broke below the lower trendline, confirming a bearish breakdown.
B. Breakdown Confirmation
A decisive bearish candle broke below the wedge's lower trendline, confirming the downward move.
After breaking down, the price attempted a small retest of the wedge’s support, which has now turned into resistance.
This successful rejection from the previous support adds to the bearish confirmation.
C. Support & Resistance Levels
Resistance Level ($88,547):
This zone acted as a strong supply area, where previous bullish moves were rejected.
If BTC/USD attempts to recover, this area may provide selling opportunities.
Support Level ($79,193):
This is the next downside target, aligned with previous price consolidation zones.
A break below this support could trigger further selling pressure.
3. Trading Setup & Strategy
A. Short Trade Setup
Entry Point: After BTC/USD confirmed the breakdown of the rising wedge.
Stop Loss: Placed slightly above the $88,547 resistance level to limit risk.
Target Price: A decline towards $79,193, which aligns with the previous major support zone.
B. Bearish Market Sentiment
BTC/USD is currently trading below the wedge, reinforcing bearish bias.
A successful retest of the broken wedge support would validate further downside continuation.
If price remains below the $85,000 level, sellers are likely to maintain control.
4. Market Outlook & Next Price Action
Bearish Scenario
If BTC fails to reclaim the wedge breakdown level, further downside is expected.
A breakdown below $80,000 psychological level could increase selling momentum toward $75,000-$77,000 levels.
Volume analysis suggests that selling pressure is increasing.
Bullish Scenario (Invalidation)
If BTC/USD reclaims the $88,547 resistance and closes above it, the bearish bias could weaken.
Bulls need to break above the rising wedge resistance trendline for a reversal.
5. Conclusion & Trading Plan
The Rising Wedge pattern breakdown confirms a bearish outlook for BTC/USD.
The risk-reward ratio for a short trade is favorable, targeting a move down to $79,193.
Traders should watch for volume confirmation and trend continuation signals before entering.
Key Takeaways
✅ Bearish Bias confirmed after the Rising Wedge breakdown.
✅ Short Position setup with entry, stop loss, and target defined.
✅ Resistance at $88,547 - Failure to break above it strengthens the bearish case.
✅ Target at $79,193 - A strong support area where buyers may step in.
6. Tags for TradingView Post
#BTC #Bitcoin #Crypto #TradingSetup #TechnicalAnalysis #CryptoTrading #BearishPattern #RisingWedge #Breakdown #ShortTrade #PriceAction #SupportResistance #MarketAnalysis
Would you like any further refinements or additional insights? 🚀

BTC/USD Rising Wedge – Bearish Breakdown Ahead?Introduction: Understanding the Market Structure
This Bitcoin (BTC/USD) 4-hour chart presents a technical setup with a mix of bullish and bearish formations. The analysis focuses on key support and resistance zones, trendlines, and chart patterns to determine the next possible move.
🔍 The key takeaway? BTC has formed a Rising Wedge, a bearish reversal pattern, signaling potential downside unless a breakout invalidates the setup.
1. Market Structure & Current Trend Analysis
📌 Market in Curve Formation – The Accumulation Phase
Before the recent rally, Bitcoin was in a downtrend, making lower lows and lower highs, suggesting a period of price weakness.
However, price found strong support at around $77,600 - $80,000, forming a curved bottom structure—an early signal of an accumulation phase.
This bottoming pattern transitioned into a bullish uptrend, leading to the formation of a rising wedge.
🔹 Key Observations:
✔ Accumulation near $77,600 created a base for buyers.
✔ The gradual recovery curve suggests a shift from bearish to bullish momentum.
✔ Bitcoin later formed higher lows, confirming a temporary uptrend.
⚠ Shift in Momentum – The Rising Wedge Appears
The price rallied from the support zone but started forming a Rising Wedge pattern, which is typically a bearish signal.
A rising wedge indicates that although buyers are pushing prices up, they are losing momentum.
The narrowing price range suggests that sellers are entering at higher levels, weakening bullish strength.
2. Key Technical Levels to Watch
🔵 Resistance Zone ($92,000 - $94,957)
The shaded area near $92,000 - $94,957 is a major resistance level, where BTC previously failed to sustain a breakout.
This supply zone has been tested multiple times, reinforcing its strength.
The Stop Loss for short positions is placed above $94,957—any breakout above this level would invalidate the bearish setup.
🟠 Support Zone ($77,600 - $80,000)
The strong demand zone between $77,600 - $80,000 aligns with previous support levels.
If the rising wedge breaks down, this is the first major price target where BTC could find support.
A strong breakdown below $77,600 could lead to further declines toward $75,000 or lower.
3. The Rising Wedge Pattern – Bearish Warning!
🔍 What is a Rising Wedge?
A Rising Wedge is a bearish reversal pattern that forms during an uptrend when price moves within two converging trendlines.
It indicates that buyers are losing strength, and sellers are preparing to take control.
Once the lower trendline breaks, it confirms bearish momentum, leading to a price drop.
📝 Current BTC/USD Rising Wedge Analysis:
BTC has formed higher highs and higher lows, but the price range is narrowing.
The lower trendline is critical—a breakdown below this level could trigger a sharp decline.
The bearish target aligns with the support zone near $77,600.
4. Trading Plan – Possible Scenarios
📉 Bearish Breakdown Scenario (High Probability)
✅ Entry: Short BTC if the price breaks below the rising wedge (~$86,000 - $85,500).
✅ Stop Loss: Above $94,957 to protect against invalidation.
✅ Take Profit Target: $77,600 - $80,000 (first support level).
✅ Extended Target: If BTC drops below $77,600, watch for $75,000 - $72,000.
✅ Risk-Reward Ratio: Ideally 1:3 or higher for optimal trade management.
📈 Bullish Breakout Scenario (Low Probability but Possible!)
If BTC breaks and closes above $94,957, the bearish setup becomes invalid.
A confirmed breakout above resistance could push BTC towards $98,000 - $100,000.
Traders should wait for volume confirmation before entering long positions.
5. Risk Management & Final Thoughts
⚠ Risk Factors to Consider:
If BTC breaks the wedge with low volume, the move might be a false breakdown.
Macroeconomic events, such as interest rate decisions, can influence price behavior.
Watch for bullish divergences in indicators like RSI or MACD before shorting aggressively.
🔎 Conclusion:
The Rising Wedge pattern suggests a bearish reversal—a breakdown could send BTC toward $77,600.
Traders should wait for confirmation before entering trades.
If BTC breaks above $94,957, a bullish continuation could push it toward $100,000.
🔥 Bearish Bias Until Breakdown Confirmation!
Would you like an indicator-based analysis (e.g., RSI, MACD, or Moving Averages)? 🚀

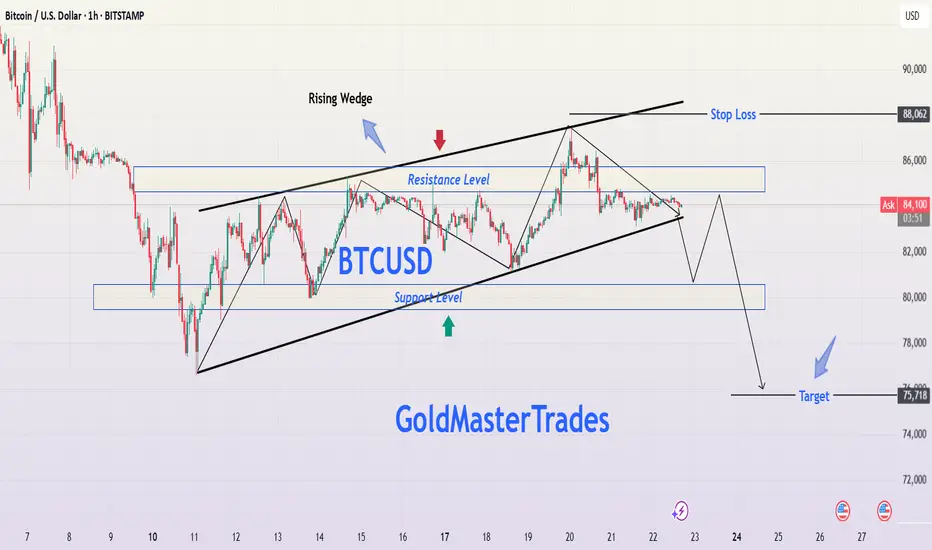
BTCUSD – Rising Wedge Breakdown Setup | Short OpportunityBitcoin (BTCUSD) is trading inside a rising wedge pattern on the 4H chart—typically a bearish reversal structure. Price is currently hovering near the wedge resistance and a previous supply zone, presenting a clean short opportunity with solid risk-to-reward.
📊 Technical Breakdown
1. Rising Wedge Formation
The price action has formed a clear rising wedge, a pattern often associated with a bearish breakout.
Current price action shows momentum fading near the wedge top, aligning with historical resistance.
2. Key Sell Zone
The 88,600–89,000 region marks an ideal short-entry zone.
This overlaps with a prior consolidation/supply block and wedge resistance—making it a high confluence zone.
3. Bearish Target & Projection
Breakdown of wedge support could drive price down toward the target zone near 78,000, a potential -8.89% move.
This target zone acted as a strong demand area in mid-March and is likely to attract buy interest again.
📌 Trade Plan
Sell Entry: Around 88,600–89,000
Stop Loss: Above 92,923 (beyond wedge + supply zone)
Target: 78,000 zone, prior demand and technical projection
Risk-to-Reward: High conviction R:R setup with structured invalidation
⚠️ Watch for Confirmation
Ideal confirmation would be a strong bearish 4H candle below wedge support or bearish divergence on RSI/MACD.

BTCUSD Bitcoin Rising Wedge Breakdown – Professional AnalysisBitcoin's price action is forming a Rising Wedge pattern on the 1-hour chart, a well-known bearish reversal formation. This pattern suggests that although the price has been making higher highs and higher lows, the upward momentum is weakening. Historically, when a rising wedge breaks to the downside, it often leads to strong downward movement, making it an ideal shorting opportunity.
This analysis will cover the pattern formation, key support and resistance levels, price action expectations, trading strategy, and risk management to ensure a well-informed trade setup.
1. Chart Pattern Breakdown: Understanding the Rising Wedge
Formation of the Rising Wedge
The price has been moving within two converging trendlines (black lines), forming a wedge shape.
The slope of both the upper and lower trendlines is positive, indicating an uptrend, but the lower trendline is steeper, suggesting weakening bullish pressure.
As Bitcoin moves higher, buying volume is declining, indicating that buyers are losing control.
The price has tested the upper resistance trendline multiple times, failing to break above it, further confirming bearish exhaustion.
The lower trendline has acted as strong support, but multiple touches suggest a possible breakdown soon.
Why This Pattern is Bearish
The rising wedge is inherently bearish because it signals that although the price is rising, the upward movement is slowing down. Eventually, the price is likely to break below the lower support trendline, triggering a sharp sell-off.
A breakdown from this wedge structure would confirm the start of a downtrend, making it an excellent opportunity for short traders.
2. Key Technical Levels to Watch
Resistance Level (~$86,000 - $86,500) - Strong Sell Zone
Bitcoin has repeatedly failed to break above this zone, indicating heavy selling pressure.
If the price unexpectedly moves above this level, the bearish setup would be invalidated.
Support Level (~$80,000 - $80,500) - Breakdown Zone
This support level has held strong multiple times.
If BTC loses this zone, it will likely trigger a massive drop due to stop-loss orders being hit and panic selling.
Stop Loss ($88,062) - Risk Management
A stop loss above $88,062 ensures protection against unexpected bullish breakouts.
This level is placed just above recent highs to minimize the risk of premature stop-outs.
Target Level ($75,718) - Profit Objective
The projected price target is based on measuring the height of the wedge and applying it to the breakout point.
This level also aligns with a major historical support zone, where buyers might step in.
3. Trading Setup & Strategy
Bearish Trading Plan - Short Setup
📌 Entry:
Enter short after Bitcoin breaks below the wedge’s lower support and confirms the breakdown by retesting support as new resistance.
Ideal entry price is around $81,500 - $82,000 after confirmation.
📌 Stop Loss:
Place above $88,062, which is beyond the wedge’s upper resistance.
This protects against unexpected bullish breakouts.
📌 Take Profit:
First target: $78,000 (psychological support).
Final target: $75,718 (technical breakdown target).
Confirmation Signals for a Strong Short Trade
✔ Candle Close Below Support – A 1-hour candle closing below the wedge confirms a breakdown.
✔ Increase in Selling Volume – Rising bearish volume supports downward momentum.
✔ Retest of Broken Support as Resistance – If the price retests the wedge’s lower trendline and fails to reclaim it, it confirms further downside.
4. Risk Management & Considerations
Risk-to-Reward Ratio: The trade offers a 3:1 risk-reward ratio, making it highly favorable.
Market Conditions: External news events, institutional activity, or macroeconomic trends (like inflation reports) could impact price action.
Bear Trap Possibility: If Bitcoin breaks below but quickly reclaims support, it could be a fakeout, so wait for confirmation before entering.
5. Alternative Scenario – When to Invalidate the Bearish Outlook?
Although the primary expectation is a bearish breakdown, we must consider alternate scenarios:
🚨 Bullish Invalidation: What if Bitcoin Rallies?
If Bitcoin breaks above the resistance zone at $86,500 - $88,000, the rising wedge breakdown would be invalidated. In that case:
✅ A breakout above $88,062 could trigger a short squeeze, pushing BTC toward $90,000+.
✅ Bulls will regain control, shifting the trend to bullish continuation instead of reversal.
🔹 In such a case, traders should exit short positions and re-evaluate market conditions before re-entering trades.
6. Conclusion – Trading Plan Summary
📊 Current Bias: Bearish 📉
🔹 Pattern: Rising Wedge (Breakdown Expected)
🔹 Entry: Short after wedge breakdown & confirmation
🔹 Stop Loss: Above $88,062
🔹 Target: $75,718
Bitcoin is forming a classic Rising Wedge, which historically leads to strong downward movement once it breaks support. If BTC follows the expected scenario, a high-probability short trade is in play, targeting a decline toward $75,718. However, traders must wait for confirmation and manage risk effectively to avoid fakeouts.
📢 Stay updated, follow price action closely, and trade responsibly! 🚀
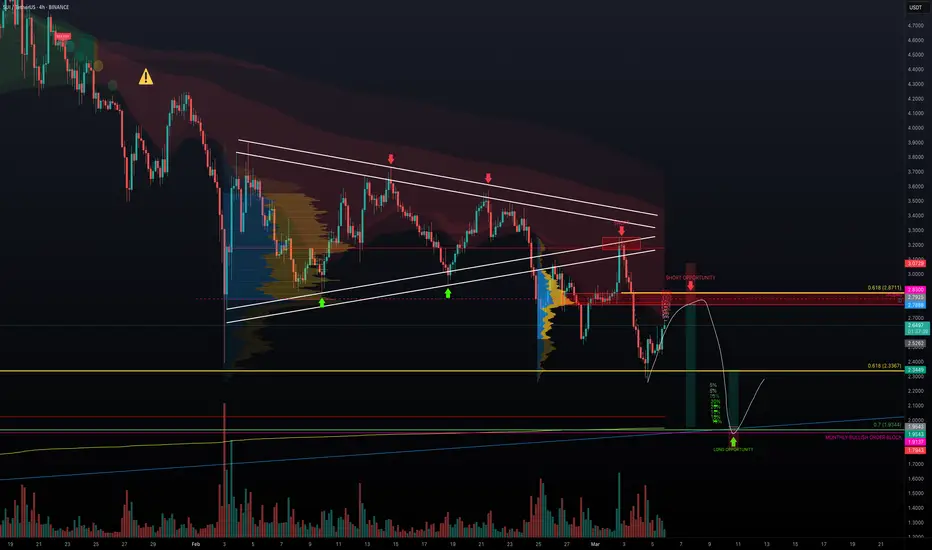
SUI - Short or Long? The Ultimate SUI Trade BlueprintHere’s an update to the analysis I did one month ago on February 10. Since then, SUI has continued to show its bearish tendencies—making lower highs and lower lows. After that dramatic 30% drop from a golden pocket short opportunity, the price started inching up on low volume. This weak rally suggests that while buyers are testing the ceiling, the overall trend remains down. That sets the stage for two possible plays: a short trade if the price reaches the resistance zone, and a long trade if it bounces off a strong support level.
1. Identification of Support and Resistance Zones
Resistance Zone (for the Short Trade):
Daily Resistance: ~2.7888
Point of Control (POC): Around 2.8035
Monthly Open: 2.83
0.618 Fibonacci Retracement: 2.8711
All these levels combine to create a robust resistance area where sellers are likely to step in.
Support Zone (for the Long Trade):
$2 Psychological Level: A key round number that attracts attention.
0.7 Fibonacci Retracement: Derived from the swing low of $0.4625 to the high of $5.3687, this places an important level at 1.9344 (just below $2).
Monthly Bullish Order Block: At 1.9137, indicating buying interest.
Fib Speed Fan (0.786): Points to support near the $2 mark.
POC: 2.0225
Anchored VWAP: Calculated from the deep low at $0.362, which again aligns around $2.
These multiple layers of confluence make the $2 area a strong support zone and an attractive entry point for a long trade.
2. Short Trade Setup
The Plan:
Building a short position gradually using a laddering strategy. With a $15,000 allocation from a $100,000 account, scale in at different levels to keep risk in check.
Scaling In (Entry Levels):
Entry # Entry Price % of Position Amount Invested ($)
1 2.6808 5% $750
2 2.7070 5% $750
3 2.7314 10% $1,500
4 2.7552 10% $1,500
5 2.7755 10% $1,500
6 2.7990 15% $2,250
7 2.8242 20% $3,000
8 2.8485 25% $3,750
Total: Avg. ~2.7924 $15,000
Stop Loss: Set at $3.07, limiting the risk to about $1,506 (roughly 10% of the trade allocation or 1.51% of the account).
Scaling Out (Exit Levels):
Exit Cover Price % of Position Amount Paid to Cover ($)
1 2.7925 5% $750.02
2 2.1715 5% $583.23
3 2.1365 10% $1,147.66
4 2.0981 20% $2,254.07
5 2.0630 20% $2,216.36
6 2.0257 10% $1,088.14
7 1.9930 15% $1,605.87
8 1.9625 15% $1,581.29
Outcome:
Total: Avg. ~2.09 $11,226.65
Net Profit: $15,000 (initial proceeds) – $11,226.65 (cost to cover) = $3,773.35
Profit % on Trade: +25.16%
Risk-to-Reward Ratio (R:R): Approximately 2.51
This laddering approach helps to secure profits at various levels while managing the risk effectively.
3. Long Trade Setup
The $2 support zone is a magnet, backed by multiple confluences. When SUI tests this area and shows signs of a rebound, it sets up a great opportunity to go long.
Key Support Details:
$2 Psychological Level: A well-watched price point.
0.7 Fibonacci Retracement: Places a key level at 1.9344 from the low ($0.4625) to the high ($5.3687).
Monthly Bullish Order Block: At 1.9137, adding to the support.
Fib Speed Fan (0.786): Confirms support near $2.
POC & Anchored VWAP: Both clustering around $2 (POC at 2.0225 and VWAP from a low of $0.362).
Trade Details:
Entry: Buy at $2.00
Target: Sell at $2.337 for an approximate 20%+ gain
Stop Loss: Set just below $1.80 to protect against further downside
Risk-to-Reward Ratio: About 2.44 or better
Wrapping It Up
In this dual-setup strategy, we're well-prepared for different market outcomes:
Short Trade: If SUI rallies into the tightly clustered resistance zone, scale into a short with defined entries, exits, and a stop loss that caps our risk at about 1.51% of the account. Exit ladder aims for an average cover price of around $2.09, netting a neat profit of approximately $3,773 (or +25.16% on the trade).
Long Trade: Conversely, if SUI finds strong footing at the confluence-rich $2 support zone, we can flip to a long position. Entering at $2.00, with a target of $2.337 and a stop loss below $1.80, gives an attractive risk-to-reward ratio of roughly 2.44.
This approach lets us capitalise on both sides of the market. Keep an eye on volume and price action. Happy trading! P.S. If you have any coin requests, feel free to share them in the comments. I will be selecting one or two for the next TA.
35 ) XAUUSD - GOLD - on the path of declineWhen gold reached the Fibonacci range of 1.618, I believed that it would fall, and it did, and now it is necessary to predict how much the price will continue to fall.
I think it will decline to 50% of the rise from 2584

SOL on the Slide: Is a Bounce from $150 in the Cards?Solana has been in a downtrend for over 30 days after reaching its ATH at $295.83. For the past two weeks, SOL was stuck in a trading range that formed a descending triangle (a bearish pattern) which eventually broke down, confirming the downtrend. Additionally, SOL lost its yearly support level at $189.31. Where is SOL heading next? Let's find out!
Key Support Zone
Our main long opportunity is around the $150 level, where several confluences align:
Fibonacci Levels:
The 0.5 fib retracement of the entire 5-wave structure sits at $151.92.
The 0.786 fib retracement from the 5th wave is at $149.77.
A fib extension 1.618 of the descending triangle is at $148.65, which is very close to the $150 mark.
Volume Profile:
The Point of Control (POC), highlighted by the red horizontal ray, is around $144, adding another layer of support.
Trade Setup
Currently waiting for SOL to reach the support zone between $152 and $144. An alarm is set when price nears these levels for a long opportunity.

Understanding market structure: Trend reversals & price actionIn this chart, we can observe how price action follows a structured pattern of trends, reversals, and breakouts. The market moves in cycles, creating bearish and bullish trends that traders can capitalize on by identifying key areas of support and resistance.
At the beginning of the chart, we see a bearish trend, characterized by lower highs (LHs) and lower lows (LLs). This structure indicates that sellers are in control, pushing the price lower with each attempt to rise. The price remains within a descending channel, offering multiple sell opportunities at resistance levels. Traders following this trend can look for short entries at each lower high.
The first major shift occurs when the price breaks above resistance, marking a potential trend reversal. This breakout signals that buyers are stepping in, disrupting the bearish pattern. Once a previous resistance level turns into support, it confirms a shift from a downtrend to an uptrend.
In the next phase, we see the emergence of a bullish trend, where the price begins forming higher highs (HHs) and higher lows (HLs). This structure confirms that buyers are now in control, pushing the market upward. The price moves within a new ascending channel, and pullbacks to support provide buy opportunities for traders looking to ride the uptrend.
Finally, another major shift occurs when the price breaks below a key support level. This break signifies a possible trend change, where buyers lose control and sellers regain momentum. Traders need to watch for confirmation before entering new positions, as this could mark the start of another downtrend.

Bearish ascending wedge could signal a 50% - 75% drop in VELO.There have been four times previous on VELO'S weekly chart when price peaked out on the RSI. After this peak, VELO'S price has dropped between 75.6% to as high as 99.95% from the presented peak. 6 weeks ago, VELO flashed this same signal for the 5th time in its history, indicating that a drop to the bottom trend line of the current bearish ascending wedge pattern could be imminent in the medium term.
If this is the case, and this pattern plays out for a 5th time, there could be some really good discount prices coming to add to your positions.
I'm not a VELO fan, and will be passing on this regardless of price, but for those who do, this could be time to be very cautious.
Good luck, and always use a stop-loss!

USDT.DIntroduction
The analysis of Tether Dominance (USDT Dominance) is one of the most essential tools for predicting overall trends in the cryptocurrency market. This metric plays a crucial role in understanding investor behavior, particularly during periods when the market leans towards liquidity or transitions into a bullish phase. This report delves into the technical aspects of Tether Dominance, offering a detailed review of its current state and outlining potential future scenarios. It serves as a valuable resource for millions of investors seeking informed decision-making.
USDT Dominance Analysis
Definition and Importance of USDT Dominance
USDT Dominance reflects the percentage of the stablecoin USDT's market share relative to the total cryptocurrency market.
🔹 Increase in Dominance: Indicates investor preference for holding cash, often signaling market downturns.
🔹 Decrease in Dominance: Suggests capital is flowing into cryptocurrencies, signaling potential price growth.
Technical Overview
1. Breakout of the Ascending Channel
✅ Current Status:
USDT Dominance has broken below its ascending channel and entered a consolidation range.
✅ Range Box Details:
Upper Limit: Green Zone (6.17 - 6.53)
Lower Limit: Red Zone (3.73 - 3.99)
2. Price Target Based on Broken Channel
🔸 Bearish Target Estimate:
The projection based on the broken ascending channel suggests that USDT Dominance might drop to the gray support zone (2.99 - 3.16).
Possible Scenarios
Bearish Scenario
📉 Condition: Breaking below the red support zone (3.73 - 3.99).
📉 Target: A decline towards the gray support zone (2.99 - 3.16).
📉 Market Impact: Bitcoin and altcoin prices may rise as capital exits USDT and flows into digital assets.
Bullish Scenario
📈 Condition: Holding the red support zone and moving back toward the green resistance zone (6.17 - 6.53).
📈 Market Impact: Crypto prices may decline as demand for USDT increases.
Daily Timeframe Triangle Pattern
🔺 Observation: A triangle pattern has formed on the daily timeframe.
🔺 Prediction: A downward breakout is more likely, aligning with the bearish scenario.
Conclusion and Key Takeaways
1️⃣ Overall Trend: The trend remains bearish unless key resistance levels are broken.
2️⃣ Critical Levels:
Red Support Zone: 3.73 - 3.99
Gray Support Zone: 2.99 - 3.16
3️⃣ Trading Decisions: Focus on higher timeframes and confirmation of breakouts before making decisions.
4️⃣ Market Impact: The breakout or defense of critical USDT Dominance levels will have a significant influence on Bitcoin and altcoin movements.
🎯 Recommendation: Considering the bearish trend, approach bullish scenarios cautiously and prioritize confirmation of breakouts for accurate decision-making.

How to easily place pending orders in GOLD #XAUUSDThis is an easy way to determine where to place a buy or sell order. Place the buy or sell order in the boxed area created by the signal, as in the example. For SL TP, it can be in a 1:1 ratio or placed at the previous strong Support and Resistance. Always pay attention to the LOT placed. Adjust to the capital and do not place too many positions during the transaction. Be disciplined and stay relaxed when trading. God Bless.
FOREXCOM:XAUUSD

Where will markets trend next? Planetary patterns give us clues!Solar Eclipses are major 6-month pivot points. The next one is on October 2, 2024. Invest By Cycles decodes planetary patterns and astrological cycles as an investing enhancement tool to complement classic fundamental and technical analysis.

SPY LOVERS ! NEW ALL TIME HIGHS But be very careful ! Check hereFINALLY HERE ! NEW ALL TIME HIGHS !
But wait!!! do you really Trust those 2 last Dojis ?
Here are 2 quick scenarios to analyze for the week:
Scenario #1 (Green Line): The price may pull back to bounce off the order block zone I have marked in white, which we know as the institutional block where there was a lot of liquidity.
I call this pattern in my trading system "N3" as it consists of 1 breakout + 1 pullback + 1 trend decision.
Scenario #2 (Red Line): Always considering our active order block zone, the price may break through the block with strong momentum, confirming another pullback or bearish market for several days. In this case, AGAIN, the price could fall back to our buyer pressure zone (blue zone), where higher buying pressure volume has been shown. NOTE: All of this depends on the bearish strength the market carries; we can tell if the market will break downward by simply observing bearish volumetric candles or seeing a lot of active bearish volume.
But for now, we can't do anything as long as the price remains within our bullish channel, which we'll keep monitoring throughout the week!
The decision will become very clear once the price makes the choice to break out of my bullish channel.
Best regards, and a million thanks for supporting my analysis!

AUDJPY Short Trade Setup A #short trade opportunity recently presented itself on the #aussieyen (#AUDJPY) #trading chart 📉.
This is indicated by the #bearish harami candlestick 🕯️ pattern just below the 100.972 horizontal resistance level.
This indicates a rejection of the same level, with potential price move in the downward ⬇️ direction (#sell).
Sufficient downward momentum should see price dumping towards the 98.500 psychological level and possibly testing the strength of the 98.056 horizontal support level.
As always, please apply appropriate risk management.
Happy trading!
#crosspair

BTC - DOMINANCE (Altseason2024)rising wedge pattern is consolidated in 3d chart
need a breakout of the lower side of the pattern in HTF as 3d chart then
btc dominance must decline 20% from here so we could tell welcome to Altseason2024.
thanks and for more ideas hit "follow" and "like"🎯
tell me in comment section when u think Altseason2024 will start
