BNB/USDT 8H (Binance Fut.) Rising wedge breakout & pullbackBinance Coin clearly broke-out this bearish pattern, now pulled-back is about to end, better prepare for downtrend.
We've got that blue Trend Line that was broken last week acting as support, but a breakdown would trigger lots of sell orders.
Sell Entry= 17.035 - 17.715
Take Profit= 15.445 | 13.807 | 11.025
Stop Loss= 19.306
Risk/Reward= 1:1 | 1:1.85 | 1:3.29
Expected Profit= 33.33% | 61.62% | 109.65%
Possible Loss= -33.33%
Fib. Retracement= 0.236 | 0.382 | 0.618
Margin Leverage= 3x
Bearishpattern

ETH/USDT 12H (Binance Fut.) Double rising wedge about to endEthereum is at critical resistance here and I can see some bearish pattern forming.
There is still some place to grow up a little bit before dump that's why I'm using low leverage and large entry range.
Sell Entry= 193.62 - 200.00
Take Profit= 181.11 | 169.33 | 150.28
Stop Loss= 212.51
Risk/Reward= 1:1 | 1:1.75 | 1:2.96
Expected Profit= 23.94% | 41.88% | 70.92%
Possible Loss= -23.94%
Fib. Retracement= 0.236 | 0.382 | 0.618
Margin Leverage= 3x

XTZ/USDTPERP 4H (Binance) Rising wedge about to break-outTezos is on dangerous support, if break-out is confirmed this would probably go down, so that's our short-term set-up:
Sell Entry= 1.995 - 1.925
Take Profit= 1.847 | 1.787 | 1.681
Stop Loss= 2.073
Risk/Reward= 1:1 | 1:1.53 | 1:2.47
Expected Profit= 28.85% | 44.15% | 71.15%
Possible Loss= -28.85%
Margin Leverage= 5x

ASCENDING WEDGIEAscending Wedge
Hey all! I hope everyone is having a great Friday!
SUMMARY:
Price continues to move up towards $9.3 USD before getting REJECTED AT THE 100SMA (4HR). This rejection will send us down to find support on the 61.8% FIB RT ($8776) where we will consolidate before making a HUGE move UP.
ENTRY: SHORT $9195, TP1: $9K, TP2: $8.85, TP3: $8.785
It looks as if we’re heading towards the completion of an ASCENDING WEDGE as we have the upper resistance and lower support converging RIGHT AT THE NECKLINE (RED HORIZONTAL RAY) of the MACRO CUP AND HANDLE we’ve been forming since OCTOBER.
Now.. Some things to consider:
We are finding resistance on the MACRO 1:1 Gann Fan (highlighted in GREEN). We appear to be following this resistance line up.
The estimated convergence of the support and resistance trend lines coincides with a 50% FIB RT line drawn from the $10.5K peek reached back on 13FEB. Breaking down off of this line makes sense as the 0.5 FIB RT is typically pretty strong S/R.
VOLUME: We appear to remaining stagnant here without any signs of increasing BULL VOL, indicating we’re more likely to break lower. Slope of the VWAP is also looking more bearish than bullish.
% BREAK DOWN is about 70% of the time
BEARISH DIVERGENCE on the RSI - we are showing higher highs with lower highs on the RSI and STOCH RSI. The MACD is also looking bearish as the HISTOGRAMS are narrowing, however the SIGNAL line appears to have began to slope UP on this 4H TIME FRAME.
100SMA - At the apex of this ASCENDING WEDGE, REJECTION from this MA should be what initiates the MOVE DOWN.
LOOKING AT SMALLER TF: We are showing similar signs from indicators. CHALKIN MF is decreasing, indicating a higher probability of breaking DOWN.
VPVR - We look to have support at the coinciding with the 61.8% FIB RT ($8776)
LARGER TF: 1D MACD SIGNAL appears to be heading towards a BULLISH CROSS, however we have BEARISH DIVERGENCE on the HISTOGRAM. However, MOMENTUM could be said to be shifting towards BULLISH, but this could be indicative of the move UP after we break DOWN of this BEARISH PATTERN.
COMPLETION of this ASCENDING WEDGE and a break DOWN, will confirm the INVERSE HEAD AND SHOULDERS we are currently trending towards and could be the LEG UP WE NEED to BREAK THE NECKLINE OF THE CUP AND HANDLE.
My play:
Waiting for break below the bottom SUPPORT LINE -just in case we get an influx of RETAIL cash from say… SOUTH KOREA, INDIA, or FRANCE which COULD send flip this BEARISH expectation on its head.
Following the completion of this pattern, I will be preparing to enter a LONG in anticipation of completing the INVERSE HEAD and SHOULDERS which should also give us the MOMENTUM we need to begin the BREAKOUT of the CUP AND HANDLE.
Thank you for taking the time to check out my trade! Please comment below if you agree/disagree!

AUD/USD Trade IdeaHello and welcome to my Trade Idea of the currency pair AUD/USD:
Lets start with the Top Down Analysis.
Monthly: Overall bearish, so we look for short Trades.
Weekly: The trend retraced itself after touching the weekly support. Now I think the retrace is complete.
Daily: We see a Trendline and again overall bearish momentum.
H4: We recognize a Resistance Area and a Trendline, which confirm that the trend will most likely turn around.


Bitcoin could drop another 34% here's why..Hellow tradingview,
- After almost 1 whole year of trading inside a descending triangle we finally broke out to the downside and hit the 3000$ target with near perfection.
- Now we can see on the chart above Bitcoin could potential form a new descending triangle.
- After a weak correction to the upper side we topped out at 4245$, we formed a bullish pattern and broke out of it. But selling pressure was so high wich resulted in a big drop once again. At this time i am looking for a double bottom around 3150$ more or less.
- I want to point out that the pattern is still not active YET, if we touch the lower trend-line again which is very likely, the pattern becomes active.
- Quick measurement shows us that a target of 2000$ is very possible for Bitcoin
- Pattern becomes invalid if we break above the upper trendline or break below it.
Safe trading!

ETHUSD - 15m Three-Drives, SMA 50, and 100. Some Recent 15m price action analysis with Bearish Three-Drives Pattern . I think the SMA 100 will come into play after the next leg up. The SMA 50 is also standing by on the Daily, noted on the recent Bullish action Sunday Evening with quick profit taking. Bulls will need a great deal of momentum here to break SMA 50, 100 , and the Downtrend Line in place from September.
A correction may be on the horizon - keeping price action in a daily Bullish Butterfly that looks to have started developing around Dec. 15th 2018.
Bullish Butterfly:
Good Luck Traders!

Pullback increasingly likely 1/14 $ndx $qqq $ixic $nas100 OANDA:NAS100USD
1 hour, 2 hour, 4 hour charts shown, 3 different indexes to confirm overall decreasing volume. I put $ES1! there as a "control" comparison
-Decreasing volume ever since hitting this price point (red rectangle zone)
-At resistance
-Still overextended
-Losing momentum
1. Extremely likely we pullback Monday/Tuesday, Short term target ~$6400
2. Other possible scenario is we chop around to reset indicators for a day or 2
3. Very unlikely we close at new highs before making at least a 3% pullback.


[ETHUSD] Descending Triangle Forming - Potential $109 ETH ShortWhile ETH has seen a couple relief rallies in the past week, it doesn't appear to be enough to combat the selling pressure and the lack of buyers in this market.
Even with this most recent pump ETH couldn't muster enough buying volume to break out of this downtrend, and instead seems to have posted another lower high for a large descending triangle that can be charted off of the highest point of the rebound off of the drop from $200 ETH, this would be the near $138 high on November 21st. Since then ETH has consistently posted lower and lower highs.
There were two points where ETH nearly went into freefall at the $100 mark, on Nov. 25th and 27th. These two lows mark the lower bounds of this large descending triangle pattern. After these lows ETH managed to have a nice relief rally the drove us back up to $125 on Nov. 28th. This formed another "lower-high" point on the upper bound of the descending triangle pattern. Yesterday evening ETH tested the $109 mark, a break through that support would likely have resulted in ETH testing $100 again. Since that point ETH has rallied again. Unfortunately for the bulls this rally has even less volume behind it than the last couple.
If the bulls are strong enough we could see them push all the way up to the upperbound of this pattern (also the $120 fib retracement mark). The $119-121 range is hard resistance that is unlikely to break especially on low volume weekend trading.
As we can see RSI is very high now after this pump, Stoch RSI looks to be moving for a cross down, MACD bullish divergence seems to be reversing and we are right at the upper bound of this large descending triangle pattern that if it breaks out downwards would represent a continuation of the longer-term downtrend and would likely mean ETH could go below $100 in the upcoming weeks.
At this point in time I am seeing this as a strong short entry at $118-121, with stop loss set 5-10% higher and a price target of $109 (last nights support that was tested). I will be shorting until $109 and from there I will reassess the trend and my positions.
This trend has been playing out very much like I have expected, if you look at my descending triangle short posted at ETH near $215 you can see that this downtrend is solid and is likely to continue.
I will eventually switch to a bullish position when the time is right but short trades seem to be the trend and the easiest to trade within for now. The risk reward on a short at these resistance levels is much better than the r/r on a long off of this pump that is meeting resistance and seeing decreasing volume.
**This is not investment advice it is for educational purposes only, trade at your own risk, do your own research, yada yada yada**
Happy trading mates!

Head and ShouldersA Head and Shoulders Pattern is a chart formation that resembles a baseline with three peaks,the outside two are close in height and the middle is highest
In TA this pattern it s essential to predict when a bullish trend will be changed to bearish
This Head and shoulders pattern appear when:
After long term bullish trend the price rises to a peak and after declined to form a trough
The price will rise again to form a second high peak and declines again
And third time the price rises also but only to the level of the first beak before declining once more
The first and third peaks are shoulders and the second peak which is upper(heighest) will form the head,in this case head and shoulders will appear

CONTINUATION BEARISH PATTERNSBearflag:is a sharp,strong volume decline,several days of sideways to higher price action on much weaker volume followed by a second huge decline with a strong volume.Target is a NEW LOW
Target: for a bearflag pattern is derived by height of the flag pole(ex if this height is 5%) the decline target for breakdown will be 5%
Bearish Pennant:this pattern is bearish in nature and indicates that the current downtrend in price may continue.This pennant it s appear after a drop in price which will looks like a triangular flag as the price moves sideways .This slowly makes lower highs and higher lows which will confirm the bearish price action
The downtrend continues with another identical-sized fall in price so here we have an oportunity for short trade
Rising wedge:is a bearish pattern that begins wide at the bottom and contracts as prices move higher and the trading range narrows.In Contrast to symmetrical triangle which have no definitive slope and no bullish or bearish bias rising wedges definitely slop up and have a bearish bias(in the final is a breakdown from this wedge)
If we put this pattern at the continuation category the rising wedge will still slope up but the slope will be against the prevailing downtrend.
The final break of support indicates that the forces of supply have finally won out and lower prices are likely.There are no measuring techniques to estimate the decline.

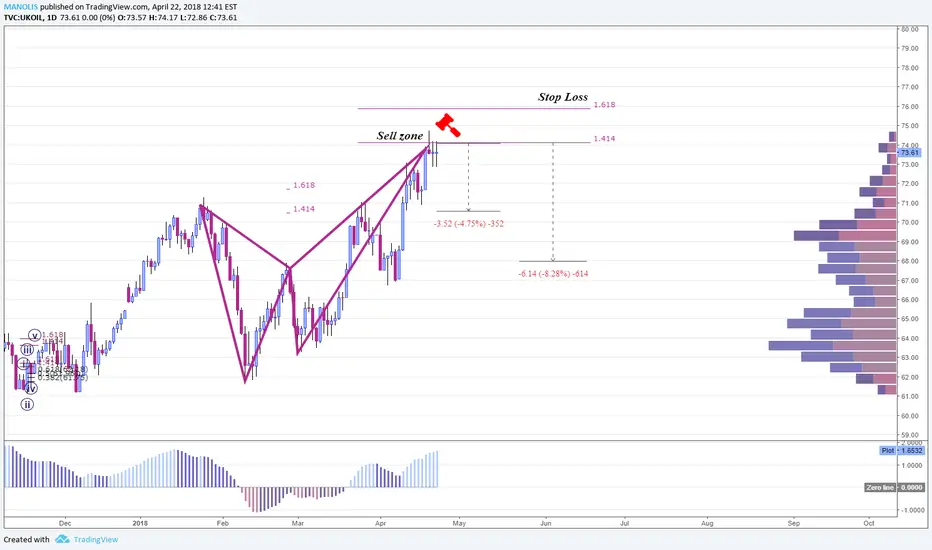
Bear ABCD Patternhere on the Brent OIL we have a Bearish AB=CD pattern. it is an 886 "C" point of the retrace of AB and it is a BC Projection of 1.13 and the ABC extension is completed nearly on top of the BC projection as it should! we shall see what happens!

GBPNZD is Forming BEARISH SHARK - Potential for Reversal!!Hey Everyone,
GBPNZD is forming HARMONIC PATTERN - BEARISH SHARK on H1 Chart with Overbought ratios
and it's expected to reverse,
and Hence we'll be shorting GBPNZD with these preferences,
GBPNZD - SELL NOW
STOP LOSS - 1.94672
TARGET1 - 1.92368
TARGET2 - 1.91389
More updates will be posted under this thread,
have any doubts? then, let us know in the comment section below
and make sure to give this analysis a Thumbs UP +_+

Bearish BatSell US Index as we notice a bearish bat pattern targeting the lower limit of the ascending channel.

USDCAD is Forming BEARISH BAT | Ahead OF BOC -CPI Release!! Hey Everyone,
Today, all Eyes are on Bank of Canada Consumer Price Index Core E.T 2.22M
and at the moment Initial expectation is Hawkish for CAD (future updates will be posted)
currently as per our Technical side USDCAD is Forming a Bearish BAT on 240M Chart
price is not that Overbought but according to H1 Chart it is slightly Overbought
and hence this trade complies with 60/40 Percent chance to reach our Targets
before crossing the stop level,
(Invest low to moderate amount)
For now let's SELL USDCAD with these preferences,
SELL LIMIT - 1.32630
STOP LOSS - 1.33568
TARGET1 - 1.31078
TARGET2 - 1.29481
(You can SELL at CMP only 9 PIPS Difference)
and remember to stay active during the news release as we might
update or adjust our stops or targets accordingly
GOODLUCK with this particular one,
More updates will be posted under this thread,
have any doubts? then, let us know in the comment section below
and make sure to give this analysis a Thumbs UP +_+

$DASH , Saved or Sell Off
Weekly
Looking at our highest timeframe we see price has been in an aggressive downtrend since forming our all-time high back in March of 2017. Stochastic RSI showing momentum continuing towards the downside, price making it’s way towards our last major support if we do not hold at this level expect a drop towards 2750000 satoshis.
Daily
Shifting over to our pattern timeframe we see price respecting a minor downtrend inside of our major downtrend. Lower high formed recently at our 4350000 satoshis, expecting a lower low to form near our 3500000 zone. A daily close above 4350000 activates our trade, however if we close below 4000000 expect a drop towards 3500000.
4Hour
Finally looking over at our trigger timeframe we see price has broke out of its small downtrend and is currently testing for support. A close below our blue line and expect a drop towards 3500000, however a 4hour close above 4100000 indicates support has been found.
Conclusion
Wait For A Daily Close Above 4100000

Gbpusd: Bat pattern:bearish 1HHello, here we just got a broke under the support, from preivous swing.
we got a nice litlle Bat pattern.
Complete D: 0.886.
Target 1: 1.40515
Target 2:1.40362
Stop loss:1.40867


Dow Jones looking bearishThis chart of the Dow Jones Inustrial Average does not bode well for the shot term future. Fact that it has dipped below its 50 day average , and the low close bar of February 8th continues to signal that this market wants to push further down. I don't want to be the doom and gloom guy, I just read it like I see it. Expect more bearish price action in the coming days.
