US100 Index – Potential Bearish Reversal in Key Resistance Zone🧠 US100 Index – Potential Bearish Reversal in Key Resistance Zone
Timeframe: 30-Minute | Chart Published: July 24, 2025
---
🔍 Overview
The US100 (NASDAQ) has been trading in a well-structured ascending channel, forming higher highs and higher lows. However, recent price action suggests that the index is testing a critical supply zone near 23,400, with signs of weakening bullish momentum. This may signal a potential corrective phase or bearish reversal.
---
📈 Technical Analysis Breakdown
🔵 Trend Structure:
Price is respecting a clear ascending trendline (blue), connecting multiple higher lows.
Multiple bullish flag/channel formations have been completed within the uptrend, showing healthy momentum until the current point.
🟥 Resistance Zone:
Strong supply zone marked between 23,250 – 23,450.
Price action shows stalling candles and rejection wicks within this zone, indicating buyer exhaustion.
⚠ Bearish Patterns:
The red path projection suggests a head and shoulders-like structure forming at the top of the channel.
This, along with divergence in wave strength and shrinking momentum, supports a potential reversal.
🔵 Key Support:
First support lies around 23,000 — aligning with the ascending trendline and previous consolidation.
If broken, next demand zone is around 22,835 – 22,900, where historical consolidation took place.
---
🔁 Projected Scenario (as per visual path)
1. Price may attempt one last push into the 23,400–23,450 zone (possible false breakout).
2. Rejection from this level could trigger a fall toward the ascending trendline support.
3. A confirmed break of the trendline can lead to a larger correction toward the 22,800 zone.
---
🧠 Unique Insight
This chart combines multi-timeframe structure recognition with a real-time reversal formation inside a long-standing bullish trend. The analysis doesn’t just rely on textbook patterns—it recognizes real-time price behavior shifts, which makes it valuable for proactive traders.
---
📌 Conclusion
While the trend remains bullish overall, caution is warranted as the US100 approaches a historically significant resistance zone. The setup offers a compelling risk-reward short opportunity for aggressive traders, especially if the price confirms a break below trendline support.
---
🔧 Next Steps for Viewers
> “Watch for a clean rejection candle or lower high at resistance before entering short. If trendline breaks cleanly, 22,835 could be the next target zone.”
Bearishreversal

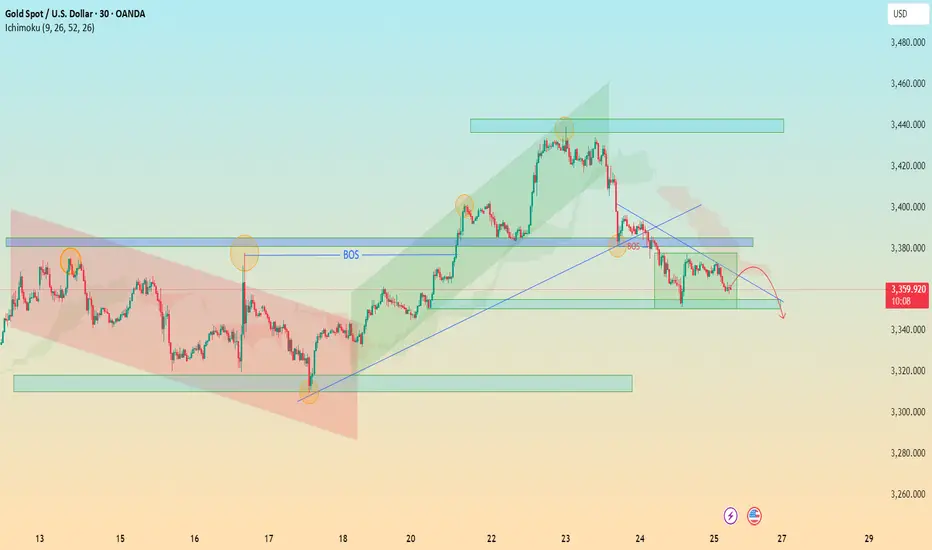
XAU/USD Bearish Retest in Motion – Watch 3340 for Breakout 🔍 XAU/USD (Gold) – Bearish Reversal Outlook
Timeframe: 30-Minute
Date: July 25, 2025
Indicators Used: Ichimoku Cloud, BOS (Break of Structure), Trendlines, Support & Resistance Zones
---
⚙ Technical Breakdown:
1. Previous Market Structure – Accumulation to Expansion:
Descending Channel (Red Box): Market moved within a bearish channel until the breakout occurred.
Key Break of Structure (BOS) around 3365 level signaled the beginning of bullish momentum — a textbook shift from accumulation to expansion phase.
Rally towards 3445 zone: Strong impulsive wave followed by higher highs and higher lows within a green rising channel.
2. Bull Trap and Structural Breakdown:
At the 3445-3460 resistance zone, price failed to maintain momentum and formed a double top / distribution setup.
The second BOS near 3385 confirmed a shift from bullish to bearish market structure.
Ichimoku Cloud also flipped bearish — price is now trading below the cloud, signaling potential continued downside.
3. Current Consolidation and Bearish Retest:
Price is now trapped in a bearish flag / rectangle pattern between 3360 – 3380.
Recent rejections from the descending trendline and overhead supply zone indicate weak bullish attempts and presence of strong selling pressure.
4. Anticipated Move – Bearish Continuation:
The projected red path suggests a retest of the diagonal resistance, followed by a breakdown toward key demand zone at 3340 – 3320.
If that zone fails, we may see a deeper move toward 3280.
---
📌 Key Technical Zones:
Zone Type Price Level (Approx.) Description
Resistance 3445 – 3460 Double Top / Strong Supply
Support 3340 – 3320 Historical Demand Zone
Short-term Resistance 3375 – 3385 BOS Retest + Trendline
---
🎯 Trading Insight:
📉 Bias: Bearish
⚠ Invalidation Level: Break above 3385 with volume
📊 Potential Target: 3340 → 3320
🧠 Trade Idea: Look for short entries on weak retests near descending trendline or cloud rejection.
---
🏆 What Makes This Chart Unique for Editors’ Picks:
✅ Multiple Confluences: Structural shifts (BOS), trendlines, Ichimoku, and classic patterns (channels, flags).
✅ Clear Visual Storytelling: Logical flow from bearish to bullish and back to bearish structure.
✅ Forward Projection: Predictive outlook based on strong technical context — not just reactive analysis.
✅ Educational Value: Useful for beginners and intermediate traders alike to understand structure transitions and key levels.
EUR/USD Breakdown Imminent – Rising Wedge at Major ResistanceOn the 1H chart, EUR/USD has developed a Rising Wedge pattern, a classical bearish reversal formation. The pair has been moving higher within a tightening structure, marked by converging trendlines—indicating weakening bullish momentum.
What makes this pattern more compelling is that it’s occurring just below a well-defined Major Resistance Zone around 1.1380–1.1400, where previous attempts to break higher have failed. This area has historically acted as a strong supply zone, increasing the probability of a reversal.
🔍 Key Technical Components:
Rising Wedge Pattern: The wedge reflects a temporary uptrend with weakening strength. Bullish candles are getting smaller, and volume appears to be fading (not shown here but typically expected in this setup).
Black Mind Curve Support: A custom support curve illustrating the underlying parabolic trend. Once this is broken, it often leads to a steeper selloff.
Change of Character (CHOCH): Around the 1.1260 level, there's a possible shift from bullish to bearish structure. If price breaks and closes below this level, it will likely confirm a momentum reversal.
Target Projection: The measured move and previous structural support suggest a drop toward 1.11479, which coincides with a prior demand zone. This also aligns with a potential liquidity sweep beneath recent lows.
🔔 Price Action Signals to Watch:
Bearish engulfing candles or strong rejections from the wedge’s upper boundary.
Breakdown below the lower wedge line and the curved support.
CHOCH confirmation – market structure shift from bullish to bearish around 1.1260.
Retest of the wedge breakout level, followed by continuation to the downside.
📌 Trading Plan (Not Financial Advice):
Entry: On break and retest of wedge support.
Stop Loss: Above the wedge high or resistance (~1.1400).
Target: 1.11479 for first take-profit level; partials can be taken at 1.1260 if needed.
📉 Bias:
Short-Term Bearish – Only upon wedge breakdown and confirmation.
🧠 Minds Section (Expanded for Traders' Perspective)
EUR/USD is approaching a critical technical juncture. We are seeing a textbook rising wedge formation into a major resistance zone, signaling exhaustion of bullish strength. While the pair has enjoyed upward momentum, price action is showing signs of slowing, and the structure is no longer sustainable.
This pattern often traps late buyers before reversing. We are closely watching the lower wedge boundary and curved support—a breakdown here will likely trigger bearish momentum, especially with the CHOCH area near 1.1260 acting as a structure-defining level.
If sellers gain control and the breakdown confirms, there’s high probability for a fall to 1.11479, targeting prior demand zones and potential liquidity pockets.
Now is the time to be cautious if long, or begin planning short setups. Wait for confirmation—no need to rush the trade.

JPY/USD Rising Wedge Breakdown – Bearish Reversal in Play🔎 Technical Breakdown:
1. Rising Wedge Formation:
The pair has been trading within a Rising Wedge, a bearish reversal pattern that forms when price makes higher highs and higher lows but with diminishing momentum. The wedge is visible from the swing low on May 13, where price began to climb aggressively but within increasingly narrow price action. This narrowing range signals weakening bullish strength.
2. Key Resistance Zone:
The wedge forms right below a Major Resistance Zone marked earlier in the chart (around 0.007050), where price had previously faced heavy selling pressure. This adds confluence to the bearish bias, as the zone historically acted as a turning point.
3. SR Interchange Zone:
Below the wedge lies a Support-turned-Resistance (SR) Interchange level, a critical price area where past support may now act as resistance if the price attempts to retrace. This is a commonly watched level by institutional and technical traders.
4. Breakdown Confirmation:
The price has broken below the wedge's lower trendline, which is often considered the breakdown signal. A valid breakdown typically includes a close outside the wedge body followed by a retest or continuation.
5. Bearish Target:
The projected move is toward 0.006796, derived by measuring the wedge height and applying it from the breakdown point. This level aligns with a historical support zone, adding more confluence to the target.
🧠 Psychological & Structural View:
Bullish exhaustion: Buyers pushed price higher into resistance, but momentum slowed, signaling exhaustion.
Trapped longs: Traders who entered late in the wedge may now be trapped, potentially accelerating a sell-off as they exit.
Smart money behavior: Rising wedges near resistance often signal distribution by smart money before a drop.
🛠️ Trading Plan Suggestion (Not Financial Advice):
Entry: After a clear wedge breakdown, consider short entries on a retest of the broken trendline or a bearish candle confirmation.
SL: Above the wedge high or major resistance zone.
TP: Staggered exits below 0.006850 and final target around 0.006796.
🔁 What to Watch For:
Retest of the wedge breakdown (potential short entry zone)
Momentum confirmation via volume or bearish candles
Price reaction at SR Interchange and final support target
🧠 Minds Section – Condensed Summary
JPY/USD formed a Rising Wedge below major resistance, signaling bullish exhaustion. Price has broken down from the wedge, confirming bearish momentum. A clean breakdown targets 0.006796, with SR interchange acting as a minor support. A retest of the wedge breakdown could offer a good short opportunity.

XAGUSD Technical Analysis : MMC Breakdown from Resistance ZoneChart Concept: By Using MMC – Mirror Market Concepts
🔎 1. Major Resistance Zone – The Brick Wall
At the top of the chart, around $33.85–$34.00, we see a strong major resistance zone. This area has acted as a ceiling for price multiple times in the past. Think of it like a brick wall where the bulls keep trying to break through but get pushed back. When price touches this level and fails to break above it, that’s a clear rejection.
This rejection gives the first sign that buyers are losing steam and sellers are stepping in.
🧠 2. Mirror Market Concept (MMC) in Action
Using the MMC (Mirror Market Concept), we’re treating the chart like a reflection — what happened on one side of the move is likely to mirror or repeat on the other.
So when price aggressively moved up into resistance, you look for a symmetrical move back down once it's rejected — just like looking in a mirror. This concept helps predict where price might land based on previous movements, levels, and psychological patterns.
🧱 3. SR Interchange Zone (Support ↔ Resistance Flip)
Look around the $33.10–$33.25 area — this is a critical SR interchange zone. Price used this zone as resistance in the past, broke above it, and then used it as support.
Now that price has rejected from the top, it’s coming back down to retest this SR zone. If it breaks below this area, it confirms a shift in market structure—from bullish to bearish.
🌀 4. Black Mind Curve Support – Dynamic Support
That curved black line? That’s not just a drawing — it's called Mind Curve Support in MMC. This curve helps map out dynamic support based on price memory and human psychology.
As long as the price respects that curve, the structure is bullish. But once it breaks below it — like it’s threatening to do now — it often means momentum has shifted and a correction is underway.
⛓️ 5. Bearish Breakdown Structure
Once price touched the major resistance, it formed two swing highs labeled TP1 and TP2. That’s very similar to a double top pattern, which is a strong bearish reversal signal. After the second peak, price dropped sharply — that’s your early confirmation of a potential move lower.
And now, price is forming lower highs and lower lows, another classic sign of bearish momentum taking over.
🎯 6. Target Zone – Why $32.72?
Here’s where MMC really helps:
The projected target zone is $32.72, which is marked in the chart.
Why this exact level?
It’s previous market structure (support zone from earlier)
It aligns with the 50% Fibonacci retracement
It’s the mirror reflection of the bullish move, completing the MMC concept
This is a high-probability area where buyers may step in again.
💼 Trade Setup Summary (Educational Only)
Parameter Level
Entry Below $33.20 after confirmation candle
Stop Loss Above $33.85 (recent high)
Take Profit $32.72 (MMC Mirror Target)
🧠 Final Thoughts – The MMC Edge
This chart isn’t just about lines and levels. It’s about understanding how traders think — where they get excited, scared, greedy, or exhausted. That’s what Mirror Market Concepts (MMC) are built on.
By recognizing structure, psychological curves, and SR flips, you're not just guessing—you’re reading the market’s mind.
⚠️ Risk Disclaimer
This is not financial advice. Always use proper risk management and confirm setups with your own trading plan before entering any trade.

BTCUSD 15M | Order Block Slam + Channel Break | 1:4+ RRR Setup🧠 BTC/USD Breakdown — Smart Money Style | May 17, 2025
This one’s textbook bearish premium reaction — the kind of move that wipes out late buyers and fills institutional orders. Let’s zoom into this juicy setup ⬇️
🧩 1. Smart Money Context
Price climbs inside a rising wedge structure
Enters premium zone and taps a defined 🔮 Order Block (OB)
OB rejection confirmed with:
Liquidity grab
Bearish engulfing
Channel break 🚨
🎯 2. Trade Details
Entry: 103,500 – 103,800 (OB zone)
SL: 103,850
TP Zones:
TP1: 103,000 (OB base)
TP2: 102,500
TP3: 101,420.70 (full breakdown completion + imbalance fill)
Risk-to-reward: 1:3 to 1:4.5+ depending on your exit style.
🔍 3. Why This Setup Works
Order Block marks institutional selling zone
Liquidity sweep triggers false breakout trap
Channel break with volume confirms momentum shift
Final candle closes with strength — this ain’t no fakeout
This is how smart money loads up and leaves retail chasing ghosts 👻
📉 Missed the initial entry? Watch for a pullback to the OB for a possible second chance!
🔥 Final Note:
The weekend price action often moves erratic, but this setup shows institutional control — wait for confirmation and let price do the heavy lifting 🧘♂️
💬 Drop your thoughts: bullish retest or straight dump incoming?
📲 Follow @ChartNinjas88 for clean, no-BS smart money analysis every day!

GBPUSD Hits Institutional Supply – Bearish Rejection Loading…⚠️ GBPUSD Smart Money Setup – Premium Price, Weak Low, Juicy Liquidity Below!
We’ve officially entered Smart Money playground territory on GBPUSD.
Here's what's happening:
🧠 Market Structure Narrative:
🔹 Price ran straight into a premium OB
🔹 Internal structure shift already played out
🔹 Now in distribution territory, prepping for a dump
Price has tapped into a high-probability sell zone (purple OB zone) between 1.34500–1.35000, where Smart Money is most likely positioned to unload shorts.
🟪 Order Block Confluence:
📌 OB Range:
Base: 1.34500
Cap: 1.35000
This zone caused the previous bearish impulse – unmitigated until now
Price reacted sharply upon entry = signs of institutional interest
💡 Clean, unmitigated supply = chef’s kiss setup.
🔻 Liquidity Engineering:
🧊 Below current price sits a “Weak Low” marked around 1.32400
💰 Below that: massive Sell-Side Liquidity at 1.31400
📌 This = high-probability magnet for Smart Money to drive price lower
🔁 Fibonacci Confluence (if applied):
Entry zone aligns with 70.5–79% retracement of previous impulse leg = premium risk zone for pro sellers.
💣 Entry Strategy:
🎯 Sell Zone: 1.34500–1.35000
📍 SL: Above 1.35100 (above OB + liquidity grab buffer)
📍 TP1: 1.32400 (Weak Low)
📍 TP2: 1.31400 (Sell-side Liquidity)
📍 RRR: Up to 1:5+ depending on entry precision
This is a swing trader’s dream — premium risk, maximum reward.
💡 Confirmation Tools:
✅ Bearish engulfing candle on LTF
✅ Internal BOS on M15-H1
✅ Rejection wick from OB or candle body stall = sniper entry
Be the sniper — not the FOMO chaser. 🎯
🧠 Key Lesson:
"Weak lows exist to be broken. OBs exist to be respected. Combine both = Smart Money sniper mode."
Let the trap trigger and ride the liquidity wave down.
🗣️ Drop a 💀 if you’re watching this setup play out!
📌 Save this chart — it’s a Smart Money blueprint.

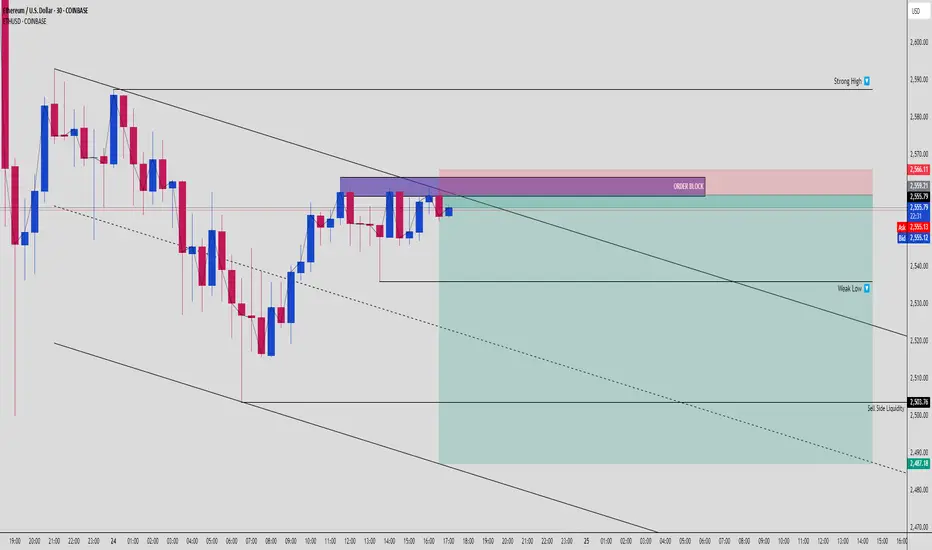
ETHUSD Bearish Trap Unfolding: FVG Fill Targets Sell-Side Liq!🚨 ETHUSD – Smart Money Bearish Setup (30-Min Timeframe)
Ethereum just gave us a beautiful SMC reversal setup after a short-term range liquidity sweep. Let’s break this down so you don’t miss the next leg. 👇
🔍 1. Structural Liquidity Sweep
A clean grab above internal highs pushed price into a well-defined premium zone where both Order Block (OB) and Fair Value Gap (FVG) reside. It’s not a bullish breakout – it's a liquidity trap.
The strong high at ~$2,566 hasn’t been breached, meaning structure still leans bearish.
🟪 2. Order Block Reaction Zone
Price is tapping directly into a bearish Order Block zone (~$2,559–2,566), showing hesitation and rejection candles.
💥 OB rejection confirmed with wicks and short-body closes
🔻 Follow-through expected down to clean up inefficiencies below
This is where Smart Money quietly enters short – right before the crowd realizes it wasn’t a real breakout.
🟦 3. Fair Value Gap (FVG) Below Price
A large FVG zone (~$2,553–2,503) is waiting to be filled. This is textbook Smart Money behavior – price rallies into premium, rejects OB, and aggressively seeks to rebalance inefficiency below.
📉 4. Weak Low & Sell-Side Liquidity
Below $2,530 lies a Weak Low, likely to be swept as price seeks out Sell-Side Liquidity. Final target sits at ~$2,487, right before the broader demand re-enters.
This is a liquidity vacuum move:
Price is engineered to sweep internal liquidity → break structure → mitigate deeper imbalance.
🎯 5. Trade Setup Breakdown
📍 Short Entry Zone: $2,555–2,566 (OB + trendline + FVG rejection)
🔐 Stop Loss: Above $2,570 (structure break level)
🎯 Take Profit Zones:
TP1: $2,530 (Weak Low sweep)
TP2: $2,503 (FVG base)
TP3: $2,487 (Sell-Side Liquidity)
⚖️ Risk:Reward Ratio – 1:3 or better
💡 Bonus: Add trailing stop after TP1 for locked-in gains
🧠 Market Psychology Lesson:
Retail sees a breakout of range = FOMO buys
Smart Money sees trapped longs = entry fuel for bearish move
Weak lows = targets
Your job = be the hunter, not the hunted. 🎯
✅ Summary:
ETHUSD is setting up for a classic bearish SMC reversal. Price tapped the OB, respected structure, and is showing a roadmap toward Sell-Side Liquidity below $2,500.
Don’t fade the confluence:
Premium OB + FVG
Rejection wick confirmations
Weak low + clean internal liquidity targets
⚠️ Keep emotions out, follow the setup, manage risk like a sniper.
💬 Type “ETH ON LOCK” if you’re tracking this beast with precision. Tag your trading squad!
Silver Double Top at Major Resistance – Bearish Breakdown📌 Overview:
This chart shows a classic Double Top Pattern forming on the weekly timeframe for Silver (XAG/USD). Price has reached a multi-year resistance zone and failed to break above it twice, signaling potential exhaustion of bullish momentum and the possibility of a larger trend reversal.
🧩 Detailed Pattern Breakdown:
🔹 1. Double Top Pattern
The double top is one of the most reliable bearish reversal patterns, formed when the market tests a resistance level twice and fails to break it, creating two rounded or sharp peaks. In this case:
Top 1 and Top 2 occurred near the $35–36 zone, clearly marked as a major resistance level.
This indicates strong selling pressure from that zone.
🔹 2. Major Resistance Zone
The $35–36 price range has historically acted as a ceiling for Silver prices. It rejected price several times between 2021 and 2025. When this kind of level holds, it often precedes sharp corrections, especially when volume begins to drop and momentum weakens.
🔹 3. Rising Trendline Break
After forming the double top, price broke down through a key ascending trendline, a sign that the bulls are losing control. The breakdown is further confirmed by a strong bearish candle, closing below both the trendline and a critical SR (Support-Resistance) Interchange zone.
🔹 4. Retesting in Progress
Post-breakdown, the price action is now retesting the broken trendline and horizontal zone (~$28). This is a crucial moment:
If Silver gets rejected here, it confirms the bearish breakout and signals entry for sellers.
If it reclaims this level, the bearish setup could fail, and price might consolidate or resume uptrend.
🔹 5. SR - Interchange Zone
This zone is marked because it acted as resistance during the 2022-2023 period, and then flipped into support in 2024. Currently, it’s being tested from below, making it an SR flip retest. These zones often become inflection points.
🔹 6. Black Mind Curve Support
An important and unique addition is the “Black Mind Curve Support” – a curved dynamic trendline that has historically aligned with price retracements. The projected path shows that the curve and horizontal support (~$22.68) intersect, strengthening the significance of that level.
🔹 7. Measured Move & Target
Based on the height of the Double Top pattern (approx. $10 range from top to neckline), the measured move places the target near $22.68, which matches both:
Historical demand zone
Curve support
This alignment makes $22.68 a realistic and strong downside target.
🧭 Strategic Summary:
Pattern Type: Double Top (Bearish Reversal)
Key Resistance: $35–36 (Multi-year rejection level)
Trendline: Broken (Bearish confirmation)
Retesting Area: $28–29 zone (Watch for rejection)
Downside Target: $22.68 (Confluence of support zones)
Invalidation: Clean weekly close above $35
🔍 What Traders Should Watch:
✅ Bearish Candlestick Confirmation at the retest zone (e.g. bearish engulfing, shooting star).
✅ Increased volume on drop, confirming participation by larger players.
🚫 Invalidation signal would be a sustained move and close back above the resistance zone.
⚖️ Risk Management Tip:
This pattern offers a high risk-to-reward ratio trade setup. Short entries on the retest with stop loss above $36 can provide substantial downside potential toward $22–23, especially in a commodity market prone to sharp retracements.
📌 Final Thoughts:
Silver appears to be forming a clean double top reversal at a long-term resistance. If the current retest fails, a significant correction may follow, targeting the $22.68 level. This pattern, combined with key support-resistance dynamics and psychological zones, makes this setup worth monitoring for medium- to long-term traders.

USDJPY Tap and Dump – Perfect Lower Timeframe ReversalSmart Money Scalpers, it’s time to eat 🍽️
USDJPY just played into a beautiful supply zone rejection on the 30-minute chart, with clean confluence from structure, trendlines, and OB reaction. Let’s break it down like a pro:
🧠 Market Structure Narrative:
🔻 Strong bearish momentum
🔹 Price created a clear lower low
🔹 Pullback into a premium zone = sniper short entry setup
You’re looking at textbook bearish order flow, with price rejecting hard from the 143.805 zone, which served as a high-risk institutional POI (Point of Interest).
🟥 Supply Zone / OB Zone:
📌 OB Range:
Top: 143.805
Bottom: 143.639
This red zone triggered the last bearish impulse and was just tapped and rejected with precision.
The reaction candle wick shows clear rejection = institutions likely mitigating and initiating shorts.
📐 Trendline Confluence:
You’ve got a perfect descending channel running down with clean touches on both trendlines.
Price bounced off the upper line → trendline + OB = double whammy setup 💥
🎯 Entry Plan:
Entry: 143.512
SL: 143.805 (above OB)
TP: 142.358 (next liquidity pocket)
This gives a juicy RRR of around 3.9–4x, depending on your exact fill.
🎯 Why This Works:
Price reacted to a clear OB
Inside a descending channel
Weak bullish push = no conviction
Favorable RRR = asymmetrical edge
Perfect combo of SMC + structure + execution = sniper-grade entry 🔫
🧠 Key Lesson:
“Let price come to you. Smart Money doesn’t chase — it traps and snaps.”
This is a trap sprung with surgical precision. Execution was key — and you nailed it.
🗣️ If this setup hit your radar too, drop a “🎯” in the comments
📌 Save this — these are the trades that build your bankroll over time.

JPY/USD Rising Wedge Pattern Formed | Retest & Move To Target🧠 Overview:
The JPY/USD pair has recently exhibited a Rising Wedge Pattern, a classic technical formation known for its bearish implications. This pattern has developed over several days of bullish price action, showing diminishing bullish momentum as price action narrows.
The wedge is forming right beneath a minor resistance zone, increasing the likelihood of a potential rejection and breakdown. This setup is particularly noteworthy due to the multiple layers of confluence supporting the bearish bias.
🔍 Technical Breakdown:
📌 1. Rising Wedge Formation
A rising wedge is often considered a bearish reversal pattern, especially after a strong uptrend.
As seen on the chart, price is respecting both the upper and lower bounds of the wedge, but with a loss of bullish momentum, indicated by shallower highs.
This tightening price action hints at indecision and likely exhaustion from buyers.
📌 2. Minor Resistance Zone
Price has approached a previous structure high where strong selling interest was seen before.
This zone has already rejected price once, acting as a supply area.
The repeated failure to break above reinforces the strength of this resistance.
📌 3. SR Interchange (Support Turned Resistance)
Below the current price action, there's a well-defined Support-Resistance Flip Zone (SR Interchange).
Previously a strong demand area, this zone may now act as a new resistance if price breaks below and retests it.
This is a key area where sellers are likely to step in again.
📌 4. Break & Retest Structure
As price begins to break the lower wedge boundary, the next move we anticipate is a retest of the broken wedge trendline.
This retest, if confirmed by rejection candles (such as bearish engulfing or pin bars), would present an ideal entry opportunity for short positions.
🎯 Trade Plan & Price Levels:
💼 Bearish Scenario
Entry Point: Wait for a successful retest of the broken wedge line (confirmation via price action: bearish engulfing or pin bar).
Stop Loss: Above the recent swing high or above the wedge resistance (~0.006920).
Take Profit 1 (TP1): 0.006845 – First key support zone.
Take Profit 2 (TP2): 0.006807 – Next major support / liquidity zone.
🧩 Why This Setup Makes Sense:
✅ Multiple Confluences:
Bearish wedge structure = reversal pattern.
Resistance zone = psychological and technical rejection.
SR Interchange = confirms institutional selling interest.
Retest confirmation = high-probability entry.
Target zones = based on recent support levels and market structure.
🛑 Risk Management:
Risk-to-reward ratio favors short positions if executed after retest.
Avoid jumping in early — wait for confirmation.
Proper stop loss is key to avoiding false breakouts or premature entries.
📊 Summary:
This is a textbook bearish setup with strong technical backing. The rising wedge pattern, when combined with resistance and retest zones, offers a great shorting opportunity — assuming price respects the pattern. Patience will be crucial here; wait for the break, the retest, and the confirmation before entering.
🔔 What to Watch:
Price behavior near the lower wedge boundary.
Reaction on retest — do bulls defend or do bears take over?
Confirmation from volume or price action (engulfing candles, rejection wicks).
Any fundamental catalysts or USD-related news.
✍️ Final Thoughts:
This is a well-structured short setup on the JPY/USD 1H chart. Wedges often deceive with temporary breakouts before reversing hard — so discipline, timing, and confirmation will be key. If the market respects this technical structure, we could see a clean drop toward our projected targets.

BTCUSD ChoCh + FVG Rejection = Drop Incoming🧠 Smart Money Concepts | BTCUSD 1H Breakdown
Here’s a crystal-clear Smart Money setup on Bitcoin that screams bearish intent. The wedge was a trap, the ChoCh confirmed the flip, and now price is reaching back into a Fair Value Gap that’s likely to reject hard.
Let’s dissect the setup:
🧱 1. Structure: Rising Wedge + ChoCh
Bitcoin climbed with a grinding structure inside a rising wedge — classic liquidity trap.
Smart Money lured in longs, then snapped structure (ChoCh) at ~102,700 — that’s your reversal confirmation.
📉 2. Fair Value Gap (FVG) Rejection Zone
After the ChoCh, price retraced into a juicy FVG zone around 103,219 – 103,913 —
right below a Strong High at 105,900. Inducement bait for breakout traders.
That’s premium pricing in a bearish environment = high-probability short.
🎯 3. Liquidity Target: Weak Low + Sell Side Sweep
Price is eyeing the Weak Low at 99,114, and below that sits the real magnet:
Sell Side Liquidity at ~98,800. That’s your ultimate draw.
📐 4. Trade Idea (R:R Approx. 3.5:1)
📍 Entry Zone: 103,200–103,900 (FVG zone)
❌ SL: Above Strong High @ 106,000
✅ TP1: Weak Low at 99,114
🏁 TP2: Sell Side Liquidity @ ~98,800
🧩 Confluences Checklist:
✅ Rising Wedge Trap
✅ ChoCh Confirmed
✅ FVG in Premium Zone
✅ Bearish Order Flow
✅ Weak Low + Sell Side as Target
⚠️ Caution:
Don’t short blindly. Wait for reaction in the FVG zone — ideally a rejection wick or lower timeframe BOS.
If price closes above the Strong High — setup is invalidated.
📊 Summary:
This BTCUSD setup is dripping with manipulation. Smart Money engineered a wedge, flipped structure, and is now likely to distribute before the next leg down.
Stay sharp. Trade with the big players, not against them.
💬 Type “🚨 BTC Short Alert” in the comments if you caught this setup too.
📉 Follow @ChartNinjas88 for more SMC alpha and sniper setups.
👀 Tag a fellow trader who thinks wedges always break upward 😂

Gold's Final Push?Multi Time Frame Analysis:
1. Monthly Chart;
• RSI: Extremely Overbought at 84.66
• Volume: Declining – signals weakening buying pressure
2. Weekly Chart;
• Historical Volume Spike
• RSI: Overbought at 78.26
3. Daily Chart;
• Price near Upper Channel Line
• R2 (3246.25): Resistance/Trend Continuation Zone
• MML +2/8 (3281.25): Extreme OverShoot zone (POI)
• R3 (3315.96): Exhaustion Zone
• Gap at 3177.260 still unfilled
• RSI: 71.24 – overbought
• Pattern: Rising Wedge
4. 4H Chart;
• RSI: Overbought
• No Valid Correction
5. 2H Chart;
• RSI: Overbought
• MACD Histogram: Fading
• MACD Lines: Near Crossover
• Volume: Declining
6. 1H Chart;
• MACD Crossover occurred, histogram below zero
• Volume: Weakening
• Price: Still rising despite momentum loss
7. 30-Min Chart;
• MACD Downtrend but price pushing up
• Histogram below zero, divergence forming
• Volume: Dropping
• Near R2 Pivot
Gold appears to be in a trend exhaustion phase. Across higher and mid-timeframes, RSI is extremely overbought, volume is consistently declining, and the MACD is losing momentum. Price is approaching a critical zone between R2 (3246.25) and MML +2/8 (3281.25)—our points of interest (POI) for potential reversal.
If 3246.25 holds, we may see a correction. However, if price breaks above this level, the final resistance could be 3315.96 (R3 Exhaustion Zone). Any signs of inducement or fake breakout could trap buyers at the top (FOMO entry).
Confirmation signals to watch:
• Reversal Candlestick Patterns: Shooting Star, Evening Star, Bearish Engulfing, or multiple Doji formations.
Final Thoughts:
Gold is currently trading at elevated levels, showing signs of exhaustion across nearly all timeframes. With the RSI reading at an extreme 84.66 on the monthly chart, and volume drying up as price continues to rise, this suggests that the market is driven more by momentum and emotion than sustainable buying pressure. The presence of an unfilled breakaway gap at 3177.26, combined with key resistance zones approaching at R2 (3246.25), MML +2/8 (3281.25), and R3 (3315.96), indicates that Gold may be entering a Fear of Missing Out (FOMO) phase, often marked by impulsive buying and the final surge before a correction. Patterns like the Rising Wedge, MACD divergence, and consistent overbought RSI across MTFs reinforce the likelihood of a potential reversal.
However, due to the nature of FOMO-driven moves, the price could still spike before reversing—this is where inducement traps often catch late buyers. It’s crucial to remain patient and wait for proper confirmation signals such as bearish candlestick formations, MACD crossovers, or strong rejection wicks at resistance levels. If price reacts at these zones without breaking through decisively, it could be an ideal setup for short opportunities. Always protect your capital with a solid risk management strategy, use clearly defined stop-loss levels (preferably just above R3), and avoid emotional trading decisions. The technicals are aligning for a significant correction—what remains is the right trigger.
🎯 Potential Targets:
• Support Zone 1: 3210.75
• Gap Fill / 26.60% Fib: 3177.26
• Support Zone 2 / 38.20% Fib: 3131.00
• Support Zone 3 / 50% Fib: 3101.50
• Support Zone 4 / 64% Fib: 3052.79
• Final Target / 78.60% Fib: 3022.52
• Demand Zone: 2961.00

XAUUSD Bearish Breakdown: Riding the Rising Wedge to Profit1. Chart Pattern: Rising Wedge (Bearish Reversal)
The Rising Wedge is a technical pattern that occurs when price makes higher highs and higher lows within converging trendlines. This pattern is considered bearish, as it usually precedes a breakdown when price fails to sustain the higher levels.
The pattern is clearly visible as price moves within two upward-sloping black trendlines.
The narrowing range suggests that buying pressure is weakening, and sellers are gaining control.
A confirmed breakdown occurs when price breaks below the lower trendline, indicating potential further downside.
2. Key Technical Levels
Resistance Level (Highlighted in Beige, Top Box)
This area represents a strong supply zone where price has struggled to move higher.
Each time the price reaches this level, selling pressure increases, pushing the price lower.
The chart labels this as the Resistance Level, suggesting a potential reversal zone.
Support Level (Highlighted in Beige, Lower Box)
This is the previous demand zone, where price has rebounded multiple times.
Once price reaches this level, buyers may attempt to push it higher.
However, if this level fails to hold after the breakdown, further downside is expected.
Stop Loss Level (~3,150)
The stop loss is placed just above the recent highs.
If price moves beyond this level, it would invalidate the bearish setup.
Traders use stop losses to limit risk in case the market moves against the position.
Target Level (~3,080)
This is the projected downside target based on the height of the wedge.
A measured move (calculated from the highest to the lowest point of the wedge) aligns with this target.
It represents a potential 1.78% decline from the breakdown level.
3. Price Action & Trade Setup
Breakout Confirmation:
The price broke below the lower trendline, confirming a wedge breakdown.
The bearish momentum suggests sellers are in control.
Entry Zone:
A good short-selling opportunity is identified after the breakdown and potential retest of the lower trendline.
Risk Management:
Stop loss at 3,150 (above resistance).
Profit target at 3,080 (expected support).
This gives a favorable risk-to-reward ratio.
4. Market Psychology Behind the Pattern
Rising Wedge Psychology:
The pattern forms as buyers push price higher, but each new high has weaker momentum.
Eventually, selling pressure outweighs buying interest, leading to a breakdown.
Resistance & Support Psychology:
The resistance area acts as a supply zone where big traders sell their positions.
The support zone may hold temporarily, but if it breaks, panic selling could accelerate the decline.
5. Possible Scenarios After the Breakdown
Bearish Case (Most Likely Outcome)
Price continues downward after breakdown.
It reaches the 3,080 target with increased selling momentum.
Confirmation of a bearish reversal pattern.
Bullish Case (Invalidation of Setup)
Price reclaims the wedge and moves back above resistance.
It invalidates the bearish breakdown, stopping out sellers.
A potential bullish continuation toward new highs.
Final Thoughts
This chart presents a high-probability short trade based on the Rising Wedge breakdown and resistance rejection. Traders can manage risk by setting a tight stop loss above resistance while aiming for a target at the next key support zone. The pattern suggests a bearish sentiment in the short term, favoring sell setups over buying opportunities.
Would you like me to add further insights, such as Fibonacci levels or RSI analysis, to strengthen the trade idea? 🚀

EUR/USD Double Top Analysis - Bearish Reversal Trade Setup This analysis highlights a Double Top pattern forming on the EUR/USD 4-hour timeframe, which is a classic bearish reversal pattern. The pattern signals a potential shift from a bullish trend to a downtrend, providing traders with a well-defined entry, stop loss, and target levels.
1. Understanding the Double Top Pattern
A Double Top is a trend reversal pattern that forms after an extended uptrend. It consists of two peaks (Top 1 and Top 2) at approximately the same resistance level, followed by a break below the neckline (support level), confirming the pattern.
Pattern Breakdown:
Top 1 & Top 2: These peaks represent failed attempts to break higher, showing strong selling pressure at resistance.
Support (Neckline): The price found support at a key level, where buyers initially stepped in, but eventually, this level was broken, triggering a potential downtrend.
2. Key Levels & Trading Setup
📌 Resistance Level (Bearish Rejection Zone)
The resistance level is marked in the 1.09500 - 1.09600 range.
Price action tested this zone twice (Top 1 & Top 2) but failed to sustain above it.
The repeated rejection indicates that sellers are dominant in this zone.
📌 Support Level (Neckline Breakout Confirmation)
The support level is marked in the 1.07700 - 1.07800 zone.
The price bounced off this area initially, but later broke below it, confirming a bearish move.
The breakout suggests selling momentum is increasing.
3. Trading Strategy – Bearish Setup
🔴 Entry Point (Sell Trigger)
A short trade is confirmed when the price breaks below the neckline (support level) after forming the Double Top.
The breakout confirms seller dominance and signals potential downside movement.
🚨 Stop Loss Placement
Stop Loss is placed slightly above the resistance level at 1.09575.
This ensures protection against false breakouts or price retracements.
🎯 Target (Take Profit Projection)
The price target is calculated based on the height of the Double Top pattern.
Target Level: 1.06639, aligning with the measured move from the resistance to the neckline.
4. Market Outlook & Risk Management
📉 Bearish Scenario (High Probability Move)
✔️ The market structure shows a strong bearish reversal with price failing to break above resistance.
✔️ The confirmed neckline break indicates sellers have taken control.
✔️ If the price continues lower, we can expect a move toward 1.06639.
📈 Bullish Scenario (Invalidation of Trade)
❌ If price closes back above resistance (1.09575), it would invalidate the bearish setup.
❌ This would indicate that buyers are regaining control, and the trade setup should be re-evaluated.
5. Final Thoughts & TradingView Tags
Summary of Trading Setup:
✅ Pattern: Double Top (Bearish Reversal)
✅ Sell Entry: Below the support neckline
✅ Stop Loss: Above 1.09575
✅ Target: 1.06639
✅ Risk-Reward Ratio: Favorable
📌 Tags for TradingView Idea:
#EURUSD #DoubleTop #ForexTrading #BearishReversal #SupportResistance #PriceAction #TechnicalAnalysis #ForexSetup #TradingStrategy

(XAG/USD) weekly Forcast – Double Top Breakdown & Bearish SetupThis detailed technical analysis of Silver (XAG/USD) on the daily timeframe highlights a potential bearish reversal forming through a Double Top pattern. This setup suggests that Silver could be gearing up for a major decline, provided key confirmation levels are met. Let’s break it down thoroughly.
📌 1. Understanding the Chart Pattern – Double Top Formation
A Double Top is a bearish reversal pattern that forms after an extended uptrend, signaling that buyers are losing strength and sellers are taking control.
🔹 Key Phases of the Double Top:
1️⃣ First Top (Top 1)
Silver initially rallied to a major resistance zone ($34.5 - $35).
The price failed to break higher, leading to a correction.
This rejection signals heavy selling pressure at this level.
2️⃣ Pullback to the Neckline ($28.5 - $29)
After the first peak, the price retraced to a critical support area known as the neckline.
This level acts as a decision point—either price bounces or breaks lower.
3️⃣ Second Top (Top 2) – Bull Trap?
Silver made another attempt to break through $34.5 - $35, but once again, sellers defended this level.
The failure to set a new higher high confirms weakness, forming the second peak.
This second rejection adds credibility to the Double Top pattern, increasing the likelihood of a bearish move.
4️⃣ The Crucial Neckline Test
The neckline around $28.5 - $29 is the most critical level to watch.
A clean daily close below this level would confirm the breakdown and trigger a strong bearish trend.
📍 2. Key Technical Levels & Market Structure
🔴 Resistance Level ($34.5 - $35) – Strong Selling Zone
This area has repeatedly rejected price advances, indicating high supply.
A breakout above this level would invalidate the bearish setup.
🔵 Support & Neckline ($28.5 - $29) – The Make-or-Break Zone
A break below this level would complete the Double Top pattern and confirm the bearish trend.
If buyers defend this area, Silver could see short-term consolidation before another breakout attempt.
🎯 Target Price ($22 - $23) – Where Silver Could Be Headed
The measured move (distance from top to neckline) suggests a potential drop to $22 - $23.
This aligns with historical support zones, making it a reasonable target.
🚨 Stop Loss Area ($35.2 - $35.5) – Risk Management
If Silver invalidates the pattern and closes above $35.2 - $35.5, the bearish setup is no longer valid.
Traders should cut losses early if price regains bullish momentum.
📊 3. Trading Setup & Execution Plan
🔻 Bearish Trading Plan (Short Entry):
✅ Entry Point:
Enter a short position after a confirmed neckline break below $28.5 - $29.
Wait for a break-and-retest of this level to confirm the bearish move.
✅ Stop Loss:
Place stop loss above $35.2 - $35.5, just beyond the resistance level.
This protects against false breakouts and sudden bullish reversals.
✅ Take Profit Targets:
Primary target: $24.5 - $25 (first support zone).
Final target: $22 - $23 (measured move completion).
📉 4. Market Sentiment & Technical Outlook
📌 Why This Setup is Important:
The Double Top pattern is a well-established bearish signal.
Price failed to create a new high, showing that buying momentum is fading.
The neckline breakdown will confirm that sellers are in control, pushing price lower.
📌 What Could Invalidate This Setup?
If Silver breaks and closes above $35.5, it would signal that bulls have regained strength.
A strong rally above this level could send Silver towards $37 - $38 instead.
🔎 Final Thoughts – Will Silver Collapse or Hold?
The chart suggests a bearish bias, but confirmation is key!
A breakdown below $28.5 - $29 would activate the Double Top pattern, leading to a potential drop.
If Silver bounces off the neckline, then we might see consolidation or a reversal instead.
🚀 What’s your view? Will Silver break down or bounce back? Share your thoughts below! 🚀

Gold (XAU/EUR) – Potential Sell Setup from Rising Wedge📉 Market Structure & Pattern:
The chart shows a broadening wedge pattern followed by a rising wedge formation.
Price has reached the upper boundary of the descending channel, where a potential sell-off could begin.
📉 Bearish Outlook:
The sell signal is indicated near 2,811 EUR, suggesting a possible reversal.
The target area is around 2,769 - 2,700 EUR, aligning with previous support zones.
If the price breaks below the wedge structure, further downside momentum is expected.
📌 Trading Plan:
Bears may look for short opportunities around resistance.
A break below 2,794 EUR could confirm further downside.
Bulls should monitor price action for any rejection near support zones for potential buying opportunities.
⚠️ Risk Management:
A break above 2,815 EUR could invalidate the bearish setup.
Stop-loss placement above resistance is advisable to minimize risk.

XAU/USD – Triple Top Formation & Bearish Breakdown Potential📌 Overview of the Chart
This chart presents the XAU/USD (Gold Spot vs. USD) price action on a 15-minute timeframe, highlighting a classic Triple Top pattern. The Triple Top is a well-known bearish reversal pattern that forms after an extended uptrend. It signals that buyers have attempted to push the price higher multiple times but failed, indicating weakening bullish momentum.
This pattern is crucial for traders as it often precedes a trend reversal. The breakdown below the neckline (support level) confirms that selling pressure is taking over, leading to a potential decline.
📊 Identifying the Triple Top Formation
A Triple Top pattern consists of three peaks (Top 1, Top 2, and Top 3) at nearly the same resistance level. Here’s a detailed breakdown of its formation:
🔹 Step 1: Price Uptrend Leading to Resistance
Before the pattern develops, the price follows a strong uptrend with buyers dominating.
The price reaches a key resistance level and faces rejection (Top 1), signaling initial weakness.
🔹 Step 2: Repeated Attempts to Break Resistance
After pulling back slightly, buyers make another attempt to break through resistance (Top 2), but fail again.
This signals that sellers are actively defending this price zone.
🔹 Step 3: Final Rejection & Breakdown Setup
The third attempt (Top 3) fails to break resistance once more.
This repeated rejection confirms a Triple Top formation.
The price then moves toward the neckline (support level), which is a critical area for the bearish breakdown.
📉 Trading Setup & Execution Strategy
✅ Entry Point – When to Open a Short Position?
A short position is confirmed when the price breaks below the neckline with a strong bearish candlestick.
A breakdown with high volume strengthens the bearish confirmation.
Conservative traders may wait for a retest of the broken neckline before entering.
❌ Stop Loss Placement – Managing Risk
The stop loss should be placed above the highest peak ($3,039.076), ensuring protection against false breakouts.
If the price moves above this level, the Triple Top pattern fails, and the bearish setup is invalidated.
🎯 Profit Targets – Where to Exit?
After the breakdown, price action usually follows a measured move based on the height of the pattern. The following target levels are identified:
1️⃣ First Target: $3,000.962 → A key support level where price may pause.
2️⃣ Second Target: $2,991.766 → A deeper support area that aligns with the price projection from the pattern.
Risk-Reward Ratio: The trade setup offers a favorable risk-to-reward ratio, making it an attractive opportunity for short sellers.
📈 Confirmation Signals to Strengthen the Setup
To increase the probability of a successful trade, look for additional confirmations:
🔸 Volume Analysis:
A spike in selling volume at the neckline breakdown suggests strong bearish conviction.
Low volume breakdowns may indicate a false move, requiring extra caution.
🔸 Retest of the Neckline:
Sometimes, after breaking below the neckline, the price retests the level before continuing downward.
This provides a secondary entry opportunity for traders who missed the initial breakdown.
🔸 RSI & Momentum Indicators:
If RSI (Relative Strength Index) shows bearish divergence, it adds confidence to the downside move.
Momentum indicators like MACD crossing bearish further confirm selling pressure.
📍 Key Considerations & Risk Management
🔹 False Breakout Risk: If price bounces back above the neckline after the breakdown, it could be a false move. Waiting for confirmation reduces this risk.
🔹 Macro Fundamentals: Gold prices are sensitive to economic news, interest rates, and geopolitical events. Unexpected fundamental shifts can impact the pattern’s reliability.
🔹 Trailing Stop Strategy: To protect profits, traders can use a trailing stop-loss, adjusting as the price moves toward targets.
🔍 Summary & Trading Plan
📊 Pattern: Triple Top (Bearish Reversal)
📉 Bias: Bearish (Short Setup)
🛠️ Entry: Sell below neckline confirmation
🎯 Targets:
Target 1: $3,000.96
Target 2: $2,991.76
🚨 Stop Loss: Above $3,039
💡 Final Thoughts
The Triple Top pattern on XAU/USD suggests a high-probability bearish setup. A confirmed neckline breakdown signals selling pressure, with price targets well-aligned with historical support zones. Patience and confirmation are key—watch for a clean breakdown or a potential retest before entering.
Would you like any modifications or additional insights? 🚀

JPY/USD Technical Analysis - Head & Shoulder Chart Bearish Move1️⃣ Chart Type & Timeframe:
Market: Japanese Yen (JPY) / U.S. Dollar (USD)
Timeframe: 1-hour chart (H1)
Platform: TradingView
This is an intraday chart used by traders to identify short-term price action and trend reversals.
2️⃣ Identifying the Key Chart Pattern – Head & Shoulders
The dominant pattern on this chart is the Head & Shoulders (H&S), a well-known bearish reversal signal that forms after an uptrend. Let’s break it down:
A. Formation of the Pattern
Left Shoulder: The price forms a peak, then retraces down to a support level.
Head: A higher peak is formed, followed by another decline, indicating buyers are losing control.
Right Shoulder: The price attempts another rise but fails to reach the previous high, showing bearish momentum is increasing.
B. Neckline & Trendline Support
The neckline acts as a key support level. A break below it confirms the bearish move.
The trendline, which has been supporting price action for a while, is also at risk of breaking.
3️⃣ Key Support & Resistance Levels
Resistance Level (0.006750 - 0.006819):
This is the previous high area where sellers are active. A stop-loss is placed above this level.
Support Level (0.006567 - 0.006468):
Key demand zones where buyers may step in. These are the take profit (TP) levels.
4️⃣ Price Action & Expected Movement
📉 Bearish Outlook – A potential breakdown from the neckline and trendline would confirm further downside.
If price breaks the trendline, a pullback to retest resistance is expected before dropping further.
Take Profit (TP) 1: 0.006567 – Minor support, possible bounce.
Take Profit (TP) 2: 0.006468 – Stronger support, deeper correction possible.
🚨 Stop Loss: Above 0.006819, just beyond the right shoulder and all-time high (ATH).
5️⃣ Trading Strategy & Execution
💡 Entry Strategy:
Sell Breakout Entry: Short the market when the neckline/trendline is broken with strong volume.
Retest Confirmation: Wait for a pullback to the broken trendline and enter when price rejects it.
📌 Risk Management:
Risk-to-Reward Ratio: 1:2 or higher for an optimal setup.
Use trailing stop-loss to secure profits if TP1 is hit.
6️⃣ Market Psychology & Smart Money Behavior
The Head & Shoulders pattern reflects buyer exhaustion and increased seller strength.
Smart money often enters after the breakdown when weak hands get stopped out.
Conclusion: Trade with Confidence!
This chart presents a high-probability bearish trading opportunity based on a textbook Head & Shoulders formation, support/resistance dynamics, and trendline analysis. A disciplined approach with risk management will ensure better execution.
📉 Final Verdict: Bearish Breakdown Expected – Sell the Retest!
🔥 Tags for TradingView Idea:
#JPYUSD #ForexTrading #HeadAndShoulders #TechnicalAnalysis #BearishReversal #SmartMoney #PriceAction #RiskManagement #TradingSetup #TrendlineBreak

Gold (XAU/USD) – Bearish Reversal Setup from ResistanceAnalysis:
Gold (XAU/USD) has been trading within a well-defined ascending channel on the 4-hour timeframe.
The price is now approaching the key resistance zone around $3,054, where sellers may become active.
A potential bearish rejection could lead to a reversal towards the $2,980 target level, aligning with previous support.
The setup suggests a sell opportunity at resistance, expecting a downward move.
Trading Plan:
Entry: Consider selling near $3,054 after confirmation of rejection.
Target: $2,980 (Support level).
Stop-Loss: Above recent highs to manage risk.
Conclusion:
If the price fails to break above resistance, XAU/USD could see a pullback, offering a shorting opportunity. Traders should watch for bearish signals before entering trades.

CHF/USD Trading Idea – Bearish Reversal from Key ResistanceThis CHF/USD chart presents a compelling bearish setup, suggesting that the pair may be headed for a decline after facing strong resistance. The price action has followed a technical breakout and retest pattern, with a clear rejection from a well-defined resistance level.
Traders looking for short-selling opportunities should take note of the key price zones, support levels, and overall market structure before making a move. Let’s break it down in detail.
🔍 Chart Breakdown: What’s Happening?
1️⃣ Falling Wedge Breakout & Bullish Push
The price was consolidating inside a falling wedge, a pattern that typically signals an eventual breakout to the upside.
The breakout led to a strong bullish move, pushing the price toward a well-established resistance zone around 1.1414.
After breaking out, the pair made a significant upward run before stalling at this key resistance.
2️⃣ Key Resistance Level Holding Strong
The price touched the resistance zone but failed to break above it.
This rejection indicates that sellers are stepping in, absorbing the buying pressure.
The market is showing early signs of bearish momentum, hinting at a potential downtrend.
3️⃣ Projected Bearish Move: Lower Targets in Sight
If the current rejection holds, the price is likely to fall toward the nearest support levels:
✅ TP 1 (Take Profit 1): 1.1271 → First major support level, likely to be tested soon.
✅ TP 2 (Take Profit 2): 1.1201 → A deeper retracement if selling pressure increases.
✅ TP 3 (Take Profit 3): 1.1055 → Final downside target if the bearish trend extends further.
4️⃣ Stop Loss Placement – Risk Management
To manage risk, the ideal stop loss should be placed slightly above the resistance level at 1.1414.
This protects against potential false breakouts and unexpected market shifts.
📉 Trade Strategy – How to Approach This Setup?
🔸 Entry Point: Look for a confirmed rejection of the resistance level (e.g., bearish candlestick patterns like engulfing, shooting star, or pin bars).
🔸 Stop Loss: Place above 1.1414 to avoid getting caught in a short squeeze.
🔸 Take Profit Targets:
First TP at 1.1271
Second TP at 1.1201
Final TP at 1.1055 for extended downside moves
⚠️ Important Notes for Traders:
✔ Wait for Confirmation: Don’t rush into a short trade. Look for a strong bearish candle closure or a retest before entering.
✔ Be Aware of News Events: Economic releases, interest rate decisions, and major USD-related news can impact price movement.
✔ Monitor Market Sentiment: If USD strengthens, this setup is even more likely to play out.
🧐 Final Thoughts – High Probability Short Setup?
✅ Why This Trade Looks Strong:
The technical pattern is playing out perfectly, with a clear resistance rejection.
The risk-to-reward ratio is favorable, with well-defined entry, stop loss, and take profit levels.
The overall market structure supports a potential downside move if price continues respecting resistance.
📢 Bottom Line : If price remains below the 1.1414 resistance, this trade setup could provide an excellent opportunity for short-sellers targeting lower support levels. 🚀 Stay patient and wait for confirmation before pulling the trigger!

EUR/GBP - Bearish Rejection from Resistance
This 4-hour chart of EUR/GBP indicates a potential sell opportunity following a rejection from a key resistance level.
Key Observations:
Resistance Level: Price is struggling to break above 0.84200, suggesting strong selling pressure.
Bearish Structure: The price action shows a rejection at resistance, forming a potential lower high.
Target Support: The next major support level is around 0.83448, followed by 0.82562 for further downside.
Trading Plan:
📉 Sell Entry: After price confirmation below 0.84000
🎯 Take Profit: First target at 0.83448, second target at 0.82562
🔴 Stop-Loss: Above 0.84300 to minimize risk
Technical Indicators to Watch:
✅ Bearish Candlestick Patterns confirming resistance rejection
✅ RSI Divergence or overbought conditions
✅ Break & Retest Confirmation before entering a short trade

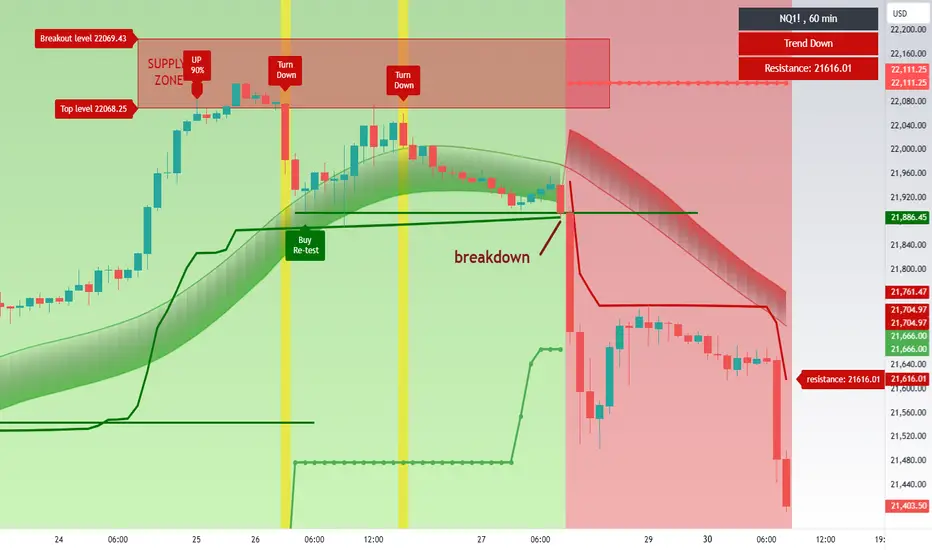
The Impulse Master indicator nailed the top of this rallyThe Impulse Master indicator accurately identified the top in NQ (Nasdaq Futures) and signaled a shift in market structure. The key observation here is the breakdown under the critical support level, which confirmed a reversal in the trend.
Explanation of the Pattern:
Supply Zone and Reversal Signal:
The chart highlights a supply zone where bullish momentum begins to stall. This area marks the exhaustion of buying pressure, as seen with the "Turn Down" label. The price repeatedly failed to break higher within this zone, signaling a potential reversal.
Support Breakdown Logic:
A rally typically continues as long as the price respects key support levels. Think of the structure as comprising a micro wave iv (a small corrective dip) followed by a wave v up (a final push higher).
In this case, the breakdown below the first major support invalidates the continuation of the uptrend. The failure of bulls to produce a higher high off the low created by wave iv is a clear indication that the rally has ended.
Confirmation of Trend Reversal:
Once the price broke below support, the rally's structure was compromised. This failure to sustain higher levels signals the transition from a bullish trend to a bearish phase, as confirmed by the "Trend Down" signal and the formation of resistance at 21,652.81.
Indicator Precision:
The Impulse Master indicator effectively mapped the turning points in the market, including the Breakout Zone, the critical support retest, and the ultimate rejection leading to a downtrend.
Key Takeaway:
The breakdown below ** the key support** is a crucial confirmation that the uptrend has concluded. This methodology highlights the importance of observing raising support levels as benchmarks for trend continuation or bearish reversal. ***When bulls fail to push the priceto a higher high after a corrective dip, then drops under the previously made low, it serves as a reliable signal that the rally is over and a new down trending move might have started.***