Nvidia - Earnings, Channel, $1.000!Hello Traders and Investors, today I will take a look at Nvidia .
--------
Explanation of my video analysis:
If you are objectively looking at the stock chart of Nvidia, you can see that Nvidia is currently trading in a solid rising channel formation. But as we are speaking, Nvidia is retesting the upper resistance and considering that we just saw a rally of +700% without any real correction, it is quite likely that we will see at least a short term bearish rejection from here.
--------
Keep your long term vision,
Philip (BasicTrading)
Bearishreversal

Uptrend Exhaustion For Top Daily Gainertrend adaptive/supertrend strategy with trendrsi and machine learning studies the strength of a trend in reversal or continuation.
this move has tracked heavily on the daily, and retraced .382 from top. the regularity of the trend is toward average low.

AUDUSD - 1H - Long Positionn this chart we have observed a Bearish Continuation pattern making LH & LL . But there is Bullish Divergence spotted which give us the signal of potential reversal towards bullish trend. So we have placed entry point above the LH level as it breaks we take an entry and we put SL & TP accordingly.

CELH in the AI subsector flies on Earnings- SHORTCELH on the 15 minute chart broke out from a decent earnings reprto and has been part of the
IA stock surge. Is it over-extended? Will it follow NVDA in a downtrend? Is this Icarus getting
too close to the sun? Yes, I think so. The company name is Celcius and it fits the Greek
mythological person and story well.
Yes I think CELH will correct. It's in the cards for a lot of its peers. CELH has been hugging
the second upper VWAP band as resistance for several days and is at the upper bounds of the
high volume area for the profile. The slower RSI line is above 50 but the faster line in green is
below that important level. The Luxalgo predictive model forecasting the linear regression
line shows a trend down. This is a regression to the mean concept playing out.
I will open a short trade targeting the evolving PCO line at 82 and then the mean anchored
VWAP line at 78.5. A stop loss of 91.35 kicks in if instead price moves into a high volume
area breakout which is considerably less probable.

#SOLANA : Feeling exhausted imo.#Solana seems to be exhausted and needed some timeout imo. The current support holding the H&S got to be broken to confirm the bearish move though.

IBM Bearish Pattern!!!When taking a look at IBM, we an see that it has had an impressive climb over the past few weeks. This bullish climb is also printing a bearish reversal pattern. The rising wedge breaks out to the downside more than it breaks upward. With this being said and the price action approaching the end of the wedge, i would expect a drop from these levels to the next support around 5% down.
If you end up taking a trade, use risk management so you don't lose more than 1%-2% of your account per trade.
Every day the charts provide new information. You have to adjust or get REKT.
Love it or hate it, hit that thumbs up and share your thoughts below!
Don't trade with what you're not willing to lose. Calculate Your Risk/Reward!
This is not financial advice. This is for educational purposes only.

AUDJPYAUDJPY is in under immense sell pressure and perfectly trading in bearish parallel channel.
Ahead of weaker AUD it seems like AUDJPY is still due for another sell off.
As the price is retracing a bit , will the bears attack the trend and send the price to lower side?

AUD/JPY: Time to Reverse! Swing Short
AUDJPY is reversing.
The pair set a lower high and lower low on a daily breaking a solid support.
It looks to me as a classic bearish reversal pattern.
I expect a bearish continuation at least to 89.6 target level.
Please, support my work with like!

BTCUSDT A Head & Shoulders to builtBTCUSDT have a Head & Shoulders pattern to built in a Zig Zag downward, in which a wave 1 can be expected for an 2-D swing trade as a breakdown from the micro symmetrical triangle is expected. Thereby, a new supply target will expecting for a reaction. This will be an increase of confidence for the sell-side. Displayed on this H4 chart: daily LSMA (least squares moving average) resistance plus AVWAP (anchored volume weighted average) from peak of wave (ii) of this ending diagonal (as showed on my actual cyclical wave analysis). Technicals: serious divergences on Commodity Channel Index and Chaikin Money Flow suggesting a condition to a dip soon. Overbought condition.

📉Bearish Reversal Patterns & Showcase📉What are Reversal Patterns?
In trading, candlestick patterns are used to analyze the behavior of the market and identify potential opportunities to enter or exit a trade. Reversal patterns and continuation patterns are two types of candlestick patterns that traders look for.
Reversal patterns are characterized by a change in the direction of the trend. These patterns indicate that the market is likely to reverse its direction and move in the opposite direction. In contrast, continuation patterns signal that the trend is likely to continue in the same direction after a temporary pause or consolidation.
Reversal patterns usually take longer to form than continuation patterns because it's easier for the market to continue moving in the same direction than to change course. For example, if sellers are pushing the market lower, it takes more effort for buyers to turn the market around and initiate an uptrend.
A reversal pattern may occur after a period of strong selling or buying pressure, as traders become exhausted or the market reaches a key support or resistance level. Once this happens, traders who missed the initial move may see an opportunity to enter a new trade in the opposite direction of the previous trend.
However, for a reversal pattern to be considered valid, there must have been a previous trend in place. A sideways market cannot be classified as a reversal because it doesn't reflect a change in trend direction. Traders typically look for confirmation of a reversal pattern, such as a breakout from a trendline or a significant price movement in the opposite direction of the previous trend.
👤 @AlgoBuddy
📅 Daily Ideas about market update, psychology & indicators
❤️ If you appreciate our work, please like, comment and follow ❤️

SPX: Poised to Seek Lower Support Levels.• The bear market persists on the SPX, as it lost our support at 4,015 and there’s no bottom sign on it yet;
• Now the 4,015 is a resistance area for any bullish reaction. In addition to his resistance, there is the 21 ema and the 4,060 (our previous support). These key points reinforce the mid-term bearish thesis;
• In the lack of bullish reaction, the index is heading to the 3,949, the next support level;
• The SPX triggered a bearish pivot point this week (a lower high/low) when it lost the 4,060. It would take a very good and powerful bullish reaction to reverse the bear trend, and so far, there’s no technical evidence pointing to that direction. I’ll keep you updated on this.
Remember to follow me to keep in touch with my daily analyses!

Entering in bullish tren AUDUSDas the price breaks the series of lower lows and made a higher high & higher low. it seems the start or bullish trend.

How to Spot Reversal Of Bullish Or Bearish Trend- Elliott Wave Dear traders,
In this video I want to look at some basics of Elliott Wave analysis and how to spot top/bottom or reversal of a trend. There are specific patterns that can help us define useful set-ups for potential trade idea.
Hope you will enjoy the video.

wouldnt be surprised to see the dollar lose somei wont be surprised if the greenback looses steam around the top of this envelope and revisits trama, bounces to form a lower high, and rolls over to form a h&s. the key is getting a sell signal near the top there.

bearish reversal in the nasdaq, bounce over?weve seen a pretty bearish reversal in technology this morning as the bounce falters at stiff resistance. if we continue looking this direction id imagine we hit that vwma currently sinking around 53.43, and cool off a bit, but since weve come out of bullish divergence RSI in SQQQ (bear nasdaq) as long as we are holding mid 51s we may have the go agead to close the gap at 56

GBPUSD ShortOANDA:GBPUSD
GBPUSD in an overall bearish trend on higher timeframes(DAILY,4H,1H). Price broke a key level of support to continue its bearish move. Let's wait for a possible retest at one of the FIB retracement levels alongside a bearish reversal pattern to go short on GBPUSD

AUDUSD shortOANDA:AUDUSD
AUDUSD broke bullish structure on the 4H and DAILY timeframes. Let's wait for a retest at one of the fib levels, and a bearish reversal pattern to form to go short on AUDUSD

GBPUSD ShortOANDA:GBPUSD
GBPUSD broke support on the 1H. It is currently making a possible retest around the 50%-61.8% fib retracement level.
A bearish reversal candle will give us a confirmation for a sell setup on GBPUSD.

Head and Shoulders pattern formationVery bearish chart pattern formation in Banknifty (NSE)
In an 15 minutes time frame
Waiting for completing the left shoulder on monday
Its time for bears

EURUSD Possible reversal or continuationHTF - Market has been corrected in an ascending channel in the 4Hr TF, and just recently broke out to it.
LTF - To me, the market seems that at least it wants to correct, however, the main bias is bearish, and therefore more bears are with strength in the markets, the main reason for me here is that the market can possibly reverse (theoretically low probability according to technicals and market bias) more due to the dollar index is forming a head and shoulder pattern at the top of its ascending channel, with that said, there's really no other reason why EURUSD should reverse here, besides that it broke out of the LTF descending channel and is correcting now...
This idea is just my thoughts about what might happen to the EUR according to how the dollar might react to its levels!
If reversal doesn't happen, the market will be breaking the bottom of that LTF descending channel and probably continue to the Daily support level of the symmetrical triangle.

Dollar index possible outcomesHTF - The market has been moving bullishly since May 2021, forming an ascending channel.
With an impulsive move to the upside, nearly touching the HTF top channel.
LTF - With an HTF bullish bias, I am considering possible outcomes out of the HTF top of the channel which implies the reversal, where to me we've already started doing and appears to be forming a kind of head and shoulder pattern.
With that said, there's still the possibility that the market will move higher, since the Dollar is doing pretty well economically, however in my perspective, in order for dollar strength to carry further north a break of the HTF ascending channel followed by a correction must happen, however until then, I'm probably going to be more bearish biased if price breaks the right shoulder down.

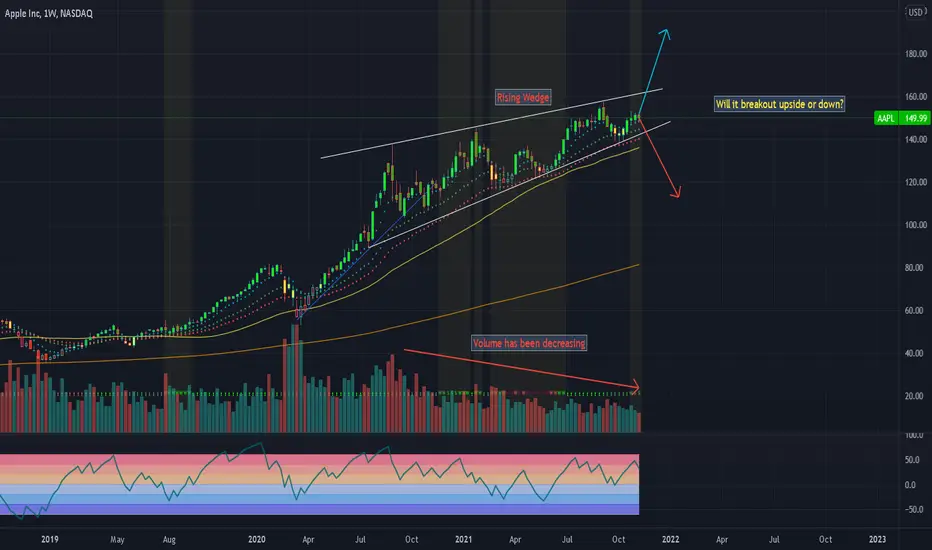
AAPL - Will the price break down or up?NASDAQ:AAPL is forming rising wedge pattern(bearish reversal) on weekly time frame. Volume has been decreasing ever since it has been trading in rising wedge pattern. If it breaks the lower bottom of the wedge with volume, It would be a confirmation of bearish reversal. Let's see if price breaks down or breaks up.
Bearish Evening Star at PCZ of ABCD Visible on the Weekly in ETHThis reversal from the D point of our ABCD has great potential of taking ETH back down to a minimum target of $2,500 and as low as a maximum target of $600
