EUR/AUD: shoulder head shoulderThe price made movement to up this early and we see that this could be a good opportunity to short again Euro/Australian Dollar when take my SL in my 2nd trade and at least, in my first trade, I'm in profit with 31 pips for now. B
Also as we forming a bearish channel, we could to forming a Shoulder Head Shoulder, a bearish pattern in development what I can see, but inevitable, we could't to hope what will be happen in the early today as Euro made a climb of 0.30% approximately.
I will hope that Euro make a bearish cnadlestick of confirmation to entry to short in that price around $1.4606 AUD to see another opportunity here
Bearishsetup

AUD/JPY: Sell in the change of trendAustralian Dollar keep in this bearish trend in H1 tiemframe. So, we could to put a sell order limit. In my case, I put a sell order limit to $91.77 JPY with my SL to $92.20 JPY (42 pips) and I have a target to $90.54 JPY (123 pips)
This it's the H4 timeframe and the trend it's clearly that we're going to find down this correction, and into this correction it's a good opporutnity to get pips in this week.
And also, I made a Daily analysis that I share in this screenshot and I see that as we're in the correction and confirmed this bearish break out and change of trend, we would hope that AUD/JPY goes to 0.382% around $90.68 JPY. And more below 0.618% as another chance to hit.
I hope that this idea support you very well!!! Also, my previously analysis that I create from my iphone, I will replace it for this analysis in how I see the movement by H4 timeframe.

XRP/USD: Fake break outXRP showing a possible go back down to $0.70 cents and this it's another interesting trade to put in short position.
Right now, as we forming a ascending triangle, but the key level of institutionals don't convinced me because this it's a key supply zone that I draw here.
I'm in short in H4 timeframe and I'm very surely that it's bearish and not bullish.

USD/CAD: Liquidation zone to sellUSD could to forming this market structure to note it. In case, we would make to sell U.S. Dollar against Canadian Dollar. But maybe, I expect that USD make a little up movement to $1.2843 CAD, also I put an alarm on $1.2840 CAD to being informed that USDCAD up, and then, we would need to hope a bearish candlestick group of confirmation to sell and entry in short in this trade
For reference: We have 2 news in USA about:
1) Consumer Price Index; measures the changes in the price of goods and services, excluding food and energy. The CPI measures price change from the perspective of the consumer. It is a key way to measure changes in purchasing trends and inflation.
2) Initial Jobless Claims: measures the number of individuals who filed for unemployment insurance for the first time during the past week
But I hope a bad news about more in the Consumer Price Index as inflation take bad expectative in America.
Good luck in this trade.

EUR/GBP:Wait for the next trade!!!
In case that EUR/GBP forming a consolidation patter like triangle symetric or any chartist pattern, this it's a signal of liquidation and the key point its's above of 0.8402 GBP to watch out.
The Daily candlestick closed up with a wick and body of indecision market, And we would need to wait. But a possible signal could to find up in the next up.
We still monitoring Euro/Great Britain Pound to trade in short or long. But wait!!!

GBP/JPY: Short PosiitonGreat Britain Pound show right now sell inminent of this downtrend continuation against Yen Japanese to trade Forex
This it's the Daily chart and it's look bearish and Pound could to hit down to $149.46 JPY.
This it's the market structure, but in case that Pound make a pull back to $152.70 JPY approx. This zone it's another opportuity to sell in case that we fall this trade.
Now, in H1 I see this price action and Pound forming a bearish hammer, an indication to sell.
So guys, in our economic calendar there're nothing for tomorrow to still pending the pause of the market when that pass, but we hope to read everyday in our Forex news to know what happen in the world, specially in this conflicts of war between Ukraine and Russia.

ETH/USD: Short Posiiton confirmed!!!In this update from H4 timeframe, Ethereum it's ready to drop their value. So guys, as we forming this bearish rising wedge in the past days, I hope that Ethereum continue toward a crash to $1,953 USD
So, in Daily timeframe we forming this symetric triangle in formation and I believe that Ethereum it's ready to the another crash as I saw in the price of $1,953 USD
But, I put a sell order limit at $2,622 USD and my SL to$2,711 USD. And my target will be around $2,420 USD. And this it's a risk/benefit 1:2. It's a good proportion to get profit. Now, if you want to extend your target toward $2,300 USD. You can to do it and this will be a risk/benefit 1:3, and it's a good proportion to get profit.

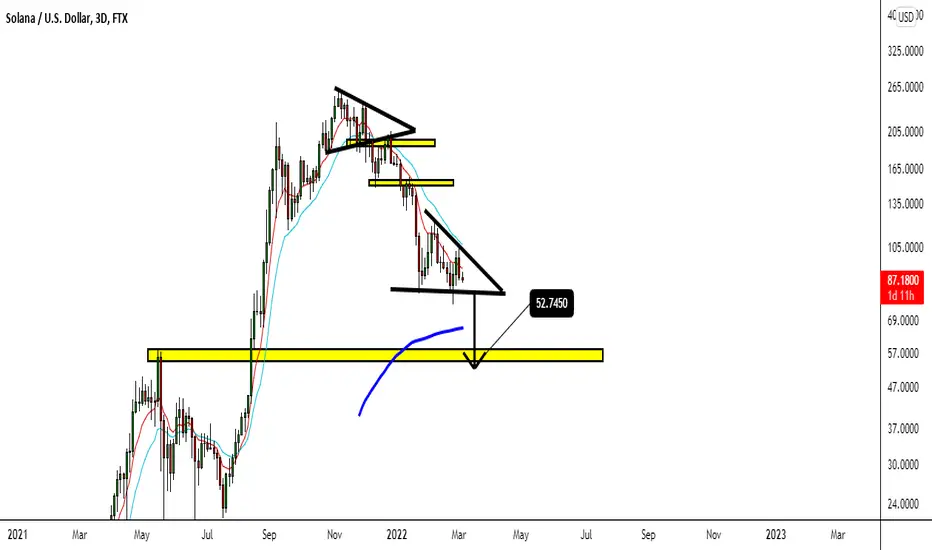
SOL/USD: Descending Triangle patternIn this outlook, Solana forming this descending triangle pattern, it's a bearish pattern and I have this clue that this cryptocurrency entry in the phase of bear market.
So, I predict that Solana could to hit down to $52 USD.
S&P 500: This could to send stock market to the another crashS&P 500 it's in the bearish movement that could to crash to 4,090 points or around 6% of depreciation of value. So, I don't convinced that this will make a key support as we're in times of war and the things has becoming worse for the stock market. But if you want to short S&P 500, noticed that you can to trade it.
But, I don't trade stock market as i trade more Forex and cryptocurrencies. But I know very well what happen in this situation in our stock market and how this affect this trouble of uncertainty.
Guys, I hope this idea support you very well and get an undertood of how the financial market work But, definitely, I see a crash and I don't convinced in that stock will climb up.

ADA/USD: Cardano toward $0.63 centsI will put a sell order limit at $0.91 cents in Daily timeframe as I believe that cryptocurrency will going to the bearish movement
My SL will be around $1.04 USD.
Guys, take your own risk management if you want to trade in short ADA, don't over leveraged to prevent to burn your trading account.
Good luck!!! This trade could to take several days until hit $0.63 cents.

ADA/USD: Cardano entry in this point of bear marketIn this analysis that I do. Based in my own perspective. Cardano entry in the possible crash that would carry to the bear market for this cryptocurrency.
First, I very interesting to look that we following this downtrend in Daily timeframe.
And in this screenshot, I see that Cardano made this pull back, but from this point, I see a different perspective that Cardano it's in serious trouble to recover above of $1 dollar and the price it's still around $0.84 cents. So guys, I planning to short Cardano around $0.88 cents that I add a sell order limit at that price with my SL at $0.97 cents and my own target will be $0.57 cents. So I trade by Daily timeframe because I discover that this will be a excellent opportunity for who want to short cryptocurrency and following the trend.
But I'm very sure that Cardano going to the bear market

ETH/USD: Bearish Rising WedgeEthereum formed this bearish rising wedge in H4 timeframe. Only, we need a pull back around $2,700 USD and wait to the next trade to entry in Ethereum
And also as update, as we completing this symetric triangle 100%, we hope that Ethereum crash around $2,000 USD per coin in the next days.
I hope that this idea will support you!!!

BTC/USD: Bitcoin could to hit 30kBitcoin continue in this downside possible perspective. But I have this in mind. If Bitcoin break down the $37,100 USD. I will going to shorting Bitcoin toward $30,000 USD.
I hope that this short idea hope you!!!

TSLA: Tesla going to the bearish movement to $616 USDIf you trade stock market. I have my perspective that Tesla it's going to the bearish movement that could to hit $616 USD in medium term as this situation got worse the situation of the global stocks market.
This it's my weekly timeframe, now if you want to short Tesla, remember the key zone it's around $616 USD.
This it's just my idea. But I'm a people that I don't trade stock market, I trade Forex, cryptocurrencies, Gold and Oil. But more common I trade a lot Forex and cryptocurrencies.

SOL/USD: Short positionI wqnt to open up a potentisl trade in Solana to short this cryptocurrency toward 60 dollar.
Good luck!!!
In the afternoon i wilk make an uldate of Ethereum and Sokana too.

ETH/USD: Bearish continuationEthereum it's moving in the downtrend and it's leading to the $2,360 USD approx.
As Ethereum forming a bearish channel, but broke down, my analysis fall. But that it's my update today and I'm bearish in Ethereum
This it's what I have like forecast a possible crash toward $1,800 USD. This could to put Ethereum in the deep bearish movement
Now, I found out a trade in H1 timeframe. As I use Fibonacci to identify the trend. So, I find up a good entry to short Ethereum toward $2,360 USD. My SL will be around $2,745 USD.

ADA/USD: The crash toward $0.40 centsI see a bear market right now in Cardano price. So, still await if you wan't to invest in Cardano. If you buy 1,000 ADA, just hold 1,000 ADA investing $400 USD when hit down $0.40 cents.
This it's my perspective in what I see!!!

ETH/USD: Elliot Wave Analysis IIIn this 2nd section, I enfocous to talk about in weekly timeframe and to recall. this it's a study of Elliot Wave Analysis to know what happen in the macrotrend.
We forming in this range 2 times of ABC patten. And that point it's consolidation of the market. So, we would need to know if this zone it's distribution that we could to begin the bear market if Ethereum doesn't support above $1,800 USD. At the moment, what I know it's that Ethereum it's leading to the $1,800 USD price, in that weekly demand zone. And more interesting it's that in the RSI we forming a bearish divergence as the buying force it's weakness in this bullish trend.

BTC/USD: Elliot Wave AnalysisUsing the Elliot Wave Analysis for this study. We could to look that Bitcoin can to end this bull rally around of the higher price $68,000 USD approx. But the trend it's very clearfully that we finish with the phase #5 of the Elliot Wave. Right now, we could to entry in the possible ABC correction in this longterm chart. But I can't to predict where Bitcoin will make th stop of the new lower price. But I can to show you this example and model that can to support for everyone. Also, it's very important to understand what phase we are in the market. But in another special analysis, I can to make how to identify a bear market vs. bull market using it to make a precise analysis in your way.

LTC/USD: Bearish Rising WedgeIn this update, I see that Litecoin show up a weakness of the price and don't made the pull back as I look more up a double top. But following the trend, it's bearish. But yesterday, I saw that Litecoin forming a bullish divergence but the price action fall. So, bears are continue dominate the market.
This it's the H4 timeframe and it's look bearish.
I'm in short in Litecoin from 124 USD approx and my SL at 130 AND MY TARGET 100

ADA/USD: Cardano into this downsideIn this trade, Cardano it's moving to the downside in H1 timeframe to following the sell.
You can to look in H4 becuase it's bearish. But now, we would need to hope a confirmation in the next few hours to know the result of the next candlestick in developing.
Good luck in this short position!!!

XAUUSD Bearish Week incoming?Hey Guys, this TA is my personal opinion for the next week. Dont take it as a financial advice, thats just my opinion!
Have a nice Weekend and I wish everything good luck for the incoming week! <3
Your Lukas

ETH/USD: Possible short in EthereumEthereum forming a bearish divergence making a higher low inthe RSI and higher high in price action. But also, Ethereum it's moving into his side but as weakness of the trend. So, I will hope that Ethereum break this structure as I indicate in this blue arrow model that I predict a drop to $2,800 USD. in that point it's important, but in case that Ethereum crash more, so the price could to hit $2,600 USD and also the previously level around $2,300 USD approx.
Ethereum price it's around $3,100 USD approx.
So, I hope that Ethereum make a drop and also, an alarm could be a good when Ethereum hit $3,040 USD. if Etherum hit $3,040 USD. An alamr will sound up and the next step it's hope a pull back around of $3,090 USD to entry in short position.
Just wait!!!
