EURJPY - Bearish Shark check-backLike many traders, I have high hopes for this trading setup. I even see this as a trade that will hit its First Target(TP1) even before its counterpart, USDJPY. But I was wrong about that, you can check the link at the bottom.
Don't get upset over this, because a check-back is pretty normal for a Shark Pattern and it's probably because this is on a 4-hourly chart and the USDJPY is on a 1-hourly chart. So it might not be because of the trend trading vs the counter-trend trading setup.
However, once the market touches 129.26(indicated with a blue arrow), I'm going to shift stops to entry and that it because it is a potential level that the market my stop and reverse against me. That's why checking back on the trade with unbias market sentiment is crucial to 1 success in trading. Well, if one fails to remain unbiased in his/her trade, then when the trade is engaged, just leave it alone.
Bearish Shark

USDJPY-Weekly Market Analysis-Sep21,Wk1On Thursday 26Aug21, I've shared a Bearish Shark setup on the USDJPY. I've also launched a poll in my telegram group you can access via my tradingview post at the bottom of this post. Many if not all the people who participated have voted the EURJPY over the USDJPY setup. Both of them are Shark Pattern and both of them are bearish setups too. The only difference is that the EURJPY setup is a Trend Trading setup and the USDJPY is a Counter-Trend setup.
To be honest, I have the same view too, but lucky for me, I didn't cherry-pick. I engage both of them and USDJPY is 10pips shy away from its first target (TP1), while EURJPY has its retest at the entry price.
We can have our preference but when the setup form, we shouldn't have our confirmation bias.
The link to both Bearish Shark analyses is at the link at the bottom.
At this moment the concern I have is this potential inverted Ascending Triangle which may sabotage my Shark Pattern trading setup. I've set my alert on the ascending trendline and the alert will trigger only when can candle touches the trendline and alert me when the candle close. This is how trading should be and not aimlessly staring at the chart.
If the candle respected the trendline and reverse at that point, I may exit my Final Target early and may reverse my trade(going long). This solely depends on how the candlestick closes and interact with the trendline.
There is other Harmonic Patterns on the 4-hourly chart but to keep it clean I've removed them. If you are interested to check what setup is there, you can check out the link at the bottom.

EURJPY - Bearish SharkA Bearish Shark Pattern formed on the EURJPY trade. The Shark Pattern is 1 of the trickiest pattern in the entire Harmonic Patterns collection.
It can have as many as 3 Potential Reversal Zone(PRZ) which is also known as the entry zone. I'm waiting for the candlestick confirmation for a trend trading opportunity that happens within the sell zone(go figure, clue: the completion is within the zone) but just a bit shy of touching the supply zone(red box)

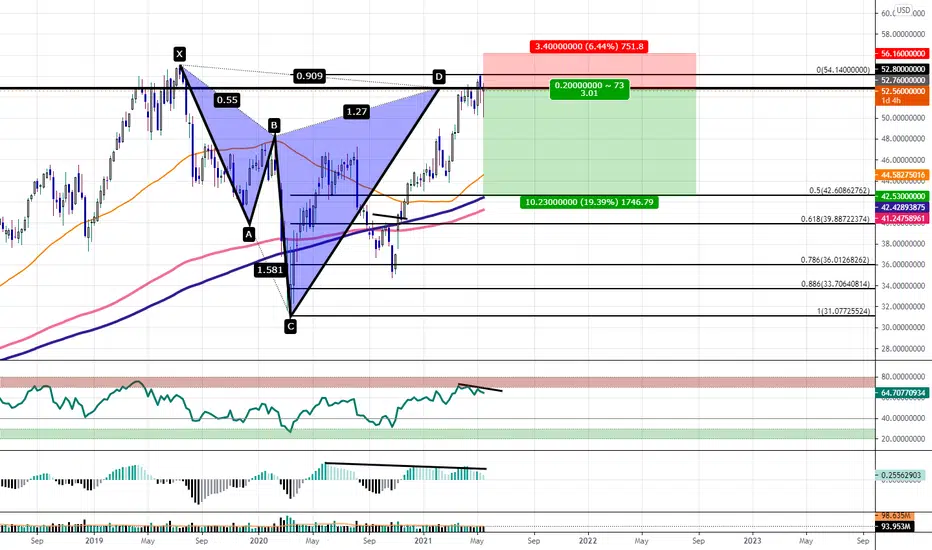
Bear Flag Breaking Down Below SupportWe could see a retrace down to 42400 upon bearishly breaking this consolidation.

USDJPY-Weekly Market Analysis-Aug21,Wk3A Bearish Shark Pattern complete at 111.76, but that would be my immediate focus. A consolidation zone between 109.59-109.35 would be the area I'm waiting for a Double Top with RSI Divergence for a buying opportunity.
Trading can be simple. Don't overthink.

GBPUSD-Weekly Market Analysis-Aug21,Wk3A Bearish Shark Pattern has shown up and is complete at 1.3952 which is nicely seated within the consolidation zone between 1.3947-1.3957.
However, that Harmonic Pattern will not be the immediate trading opportunity. What you can expect on Monday market open will be the sideway bounce setup between 1.3878-1.3799. A double top with RSI Divergence and a 3 point reversal would suffice.

4 Hour Bearish CypherLINK may potentiall6y reverse between the .786 and the .886 retrace as it shows Bearish RSI Divergence and appears to be is overbought territory.


GBPUSD-Weekly Market Analysis-Jul21,Wk2GBPUSD if you are looking for buying opportunity, you can observe if it respected 1.3800, you can consider a buying opportunity. For short-mid term shorting opportunities, you can wait for a shorting opportunity at 1.4009-1.3971 and if the candle break and close above 1.4009 the next shorting opportunity will be at 1.4184.

USDJPY-Weekly Market Analysis-Jul21,Wk1If you are worried about the Bearish Gartley Pattern(you can check the link at the bottom within my tradingview profile) for violated on the 4-hourly chart, worry not. Do remember that the Bearish Deep Gartley Pattern formed on the Daily timeframe and base on the 1-hourly chart, we have shorted the Bearish Shark Pattern. As long as the candle didn't break and close above the trendline(Profit Trendline) on the 1-hourly chart, you are pretty safe.

USDJPY - Bearish Shark checkbackA bearish shark pattern has formed up a few days ago, and this morning I've shorted this shark pattern at 110.95 and should you decide to engage it, you have not missed much. A break and close below the imagined trendline would enhance the trade furthermore and probably I will add more position depends on the candlestick formation.

Bearish CypherWe may see a bearish reversal between the 786 and 886. If it pushes to the 886 or even the 113 before reversing then we may instead get a bullish 5-0 move.

EURJPY - Bearish Crab check-backThis Bearish Crab Pattern is important because it came in line with the Bearish Shark Pattern on the Weekly chart. In the coming week, I'm waiting for a retest at 134.00 for a shorting opportunity as a counter-trend trade, it could be a trend reversal setup.

GBPUSD-Weekly Market Analysis-Jun21,Wk1If you have been waiting for the Bearish Bat shorting opportunity(chart at the bottom) and you had missed it, well, it looks like a better opportunity might present itself for a trading opportunity. After the candlestick pattern has confirmed, I will short the Bearish Shark Pattern at 1.4228 regions for a counter-trend or trend reversal opportunity.
Coincidently, my student has the same view on the GBPUSD market movement, you can check out his analysis below.

EURUSD-Weekly Market Analysis-Jun21,Wk1Well, if you are a Harmonic Pattern trader and you wonder if I have selected the wrong investment strategy, nope, I didn't.
On the higher time frame, there is a Bearish Shark Pattern(check the link at the bottom) and I'm waiting for a shorting opportunity on the Shark Pattern.
For traders who agrees with me, you have to be aware of a Bullish Butterfly setup on the 1-hourly chart(although it is likely to fail, you still have to be aware that it completes at 1.2123).

Weekly Bearish Shark with Bearish DivergenceIt's all clear in the chart; Shorting at the 1.27 and targeting the 50 percent retrace for profit taking, stops above the high.
NZDJPY - Failure Shark PatternThis looks like a regular shark pattern and it is a valid bearish shark pattern, but I'm seeing this harmonic patterns has a 90% chance of failure, meaning to say it is most likely to have a bull run than a bear run.
I've been trading harmonic patterns for 10years and on my personal observation when certain setup matches others, it will give a sign of the pattern succeed or fail.
While lots of traders love to show what happen when they hit profit, I love to share my thought process before the trade happen.

EURUSD-Weekly Market Analysis-May21,Wk3I'm waiting for the Bearish Shark Pattern checked back for a shorting opportunity as a counter-trend trade. I will be waiting at the lower-timeframe for candle confirmation to engage this trade.

GBPAUD - Bearish SharkWell, we have a bearish shark setup on the 1-hourly chart, will you short from a strong UK Pound movement? I will? What I needed is a pullback that is sufficient for me to shift my stop-loss to entry. Nevertheless, the Reward: Risk is acceptable.

Bearish Shark or Bearish Deep Gartley?Will this pair eventually be a bearish shark pattern or a type2 bearish deep gartley pattern? And all this will be determined by the candle close. Latest by Tuesday, 11May21 we will have an idea of this trading setup.

EURUSD-Weekly Market Analysis-May21,Wk2After a long wait, the bearish shark pattern is about to emerge. I'm waiting for a double top to form up on the 4-hourly chart at 1.2181.

EURJPY - Bearish SharkThe bearish shark pattern on the weekly chart has finally formed up(check out the link at the bottom), it took me months waiting for the formation and trading is all about patience.
Right now I'm waiting for the double top pattern to form on the 4hourly chart for an aggressive trade.
Could this be the trade of the year, I certainly hope so.

AUDUSD - Bearish Shark PatternIf you have watched the video analysis you would have seen that there's a potential head and shoulders formation on the daily chart; a confirmed bearish shark pattern on the 4-hourly chart and the emerging bearish shark pattern on the 1-hourly chart. I will wait either a bearish shark pattern on the 1-hourly chart to engage the trade or on the daily chart candle close to decide if I will engage the aggressive shorting trade on AUDUSD.
