Intraday Bearish Shark with Potential Hidden Bearish DivergenceBitcoin has formed a Bearish Shark Visible on the Hourly that is confluent with the Moving Averages and is Potentially Forming some MACD Hidden Bearish Divergence.
Bearish Shark

Bitcoin: 3 Falling Peaks In Harmonic RangeBTC is trading within a Harmonic Range today and while the Bearish Shark did perform well last night, ultimately price has come back up and created a Bearish Bat at the VAH while showing Bearish Divergence on Volatility. As the 89SMA approaches i'd want to see BTC come down towards and break the confirmation line to begin a move down to $16,500-$15,000 to complete the bearish wave down and start fresh on the new week.

Murderous Intent on GBPAUDI have a murderous intent on the GBPAUD, it is not because of revenge trade, heck, I don't even have any recent losing trades, and I've been trading for some time so I don't do that, but that is because I spotted something that many traders have missed out.
RSI Divergence on both the Daily Chart and 1-hourly chart. To top it up, on the Weekly Chart, the GBPAUD is on the Key Resistance Level.
As usual, there are a few ways to engage the trade, but I'm waiting for the candlestick pattern to retest 1.8214 for a shorting opportunity, so that it gives me a better Profit Factor.

GBPUSD-Weekly Market Analysis-Dec22,Wk3On the Weekly Chart, the candlestick paused and reversed on the Key Resistance Level, and because of that, I have a Bearish bias on the GBPUSD trade.
Two levels of trading opportunity present themselves on the 1-hourly chart.
Structure-based setup, where the resistance level sits at 1.2222 or a Bearish Shark Pattern trading setup that completes at 1.2329.

AUDUSD - Bearish SharkOn the bigger timeframe, shorting AUDUSD is considered a trend-trading setup. Hence, 0.6829 will be the level I'm waiting for a shorting opportunity by waiting for the Bearish Shark Pattern confirmation. A 3-bar reversal is essential in the setup.

EURUSD-Weekly Market Analysis-Dec22,Wk2The Overall Trend of EURUSD is a Bullish Trend. There are a couple of ways you can engage in this trade.
Wait for market retest at 5-0Pattern at 1.0515 for a buying opportunity or a shorting opportunity at 1.0581 by using the Type2 Bearish Shark Pattern as a counter-trend trade that could form a combo trade with EURUSD Bearish Crab Pattern on the Daily Chart.

AUDUSD - Bearish SharkA Bearish Shark Pattern setup coincides with the Daily Chart Bearish Bat Pattern. Both setups are on a retest of the level, and shorting it would consider a trend trading setup.

GBPAUD - Bearish SharkOn the daily chart, there is a kiss-of-death setup. What's kiss-of-death, well a term that was given to describe a retest of double top setup, came so close to violating it. And this is what makes this Bearish Shark pattern special.
I'm waiting for the market open and wait for a shorting opportunity.
Let us know if you prefer the current Shark Pattern setup or the one on EURUSD.

EURUSD-Weekly Market Analysis-Dec22,Wk1If you missed the trade ideas of EURUSD on Friday, this might give you a 2nd chance to engage in the trade. With that said, do your market analysis and not follow blindly.
What's nice about this trading setup, the three primary timeframes I'm looking at has all the bearish trading setup I need.
Daily Chart - Bearish Crab setup
4-hourly Chart- Ascending Channel with RSI Divergence on overbought region
1-hourly Chart, Bearish Shark Pattern retest

EURUSD - Bearish SharkFinally, a bearish shark pattern qualifies as a shorting opportunity. It has been a long waiting opportunity for this shark pattern trading setup.
As you know or may not know that Shark Pattern can have as many as three different trading zones.
What is needed is patience; failure to do that results in the loss of profits from trying to capture it and losing confidence to trade the next trading setup.

NZDUSD - Bearish SharkBearish shark trading opportunity on the daily chart.
watch closely on this trading setup on NZDUSD D1 chart I'm not engaging based on the Daily chart, if not I would have done so. I will check out the H1 chart in waiting for the opportunity

NZDUSD - Bearish Shark comboNZDUSD has a Bearish Shark Pattern on the intra-day and daily chart timeframe. My engagement will be on the intra-day timeframe; that's when the Shark Pattern completes at 0.6270. A minimum of 3-bar reversal must be seen on the intra-day timeframe before engaging in the trade.
I would stretch my targets to which of the daily chart patterns, giving me a lower risk with higher returns. You can't do this to all trading setups, and you have to understand the trend well before you could even consider doing that.

AVAXUSDT, 1HBINANCE:AVAXUSDT Potential Bearish Shark
Potential Reversal Zone:
BC Retracement (1.618 | 2.618)
Near: 13.79262
Far: 14.228
XA Retracement (0.886 | 1.13)
Near: 13.88285
Far: 14.1773

Shark Attack on NZDJPYA Bearish Shark Pattern completing at 86.76, I'm waiting for a 3-bar pattern confirmation to engage the trade within this sideway increase volatility.

NZDUSD - Bearish SharkA Bearish Shark Pattern is completed within the sell zone of the NZDUSD. It is a good trend trading setup that I'm going to jump in.
Granted, engaging on a daily timeframe could be intimidating for most traders, but I have an approach to engaging it.
The idea is to have lower risk with higher returns on each trade.

NZDUSD - Bearish SharkWell, this is how 1 of the ways I've engaged the trade with lower risk and higher returns. You have to have a clear understanding of trends, structures and filters before making such a decision.
If you have it all wrong, you will be burning money faster than ever.

AUDUSD - Bearish SharkWe have a potential Bearish Shark Pattern that is complete at 0.6466; for all trading patterns, a final chart confirmation is required.
What matters more to me in this setup is the 5-0Pattern completion. One of the side reasons is that the completion of the Bullish 5-0 Pattern happens within the Buy Zone.

AUDCAD - Bearish SharkThis kind of trading setup often worries me. Consolidation before completion, could the shark pattern have missed it by a bit?
Let's see!

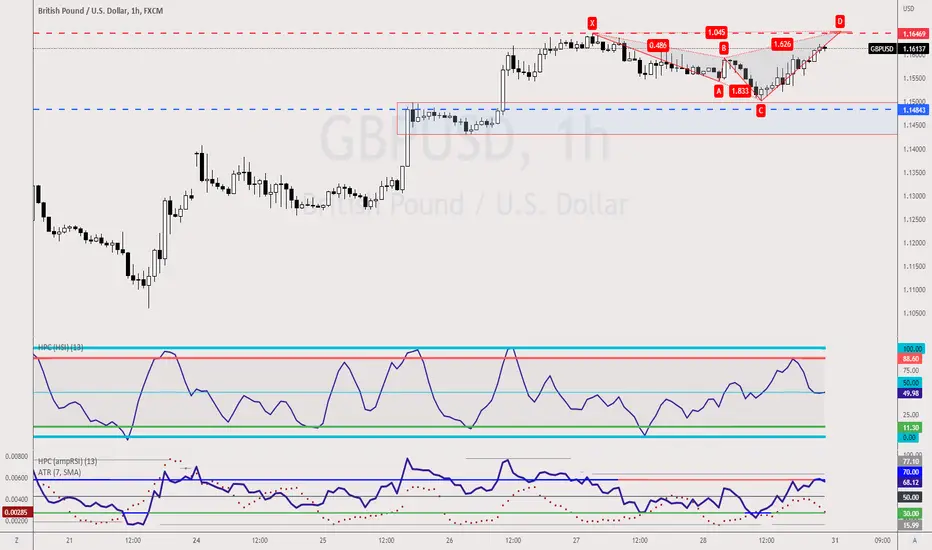
GBPUSD-Weekly Market Analysis-Nov22,Wk1A Bearish Shark Pattern completes at 1.1650 which coincide with my 4-hourly chart, sideway bounce setup, a classic trading setup that I've been trading on most of my trading life.
With that said, a candlestick pattern confirmation is still required.
SHARK - AS ABOVE, SO BELOWHello Traders, I am sharing this idea with you all not to give out directions to either sell or buy. You be judges of it. This is mainly for record purposes.
Personally, I think that shorting days are coming for this pair. So, the idea shows a Shark Patten - This came up because this aligns with previous analysis I did from Macro to Micro including Elliot Wave Count and Fibonacci Retracements.
Happy Trading.

GBPUSD-Weekly Market Analysis-Oct22,Wk4GBPUSD has a completed Bearish Shark Pattern, which does not necessarily mean you have missed the trade. You could wait for a retest of the Shark Pattern at 1.1388

Hourly Bearish Shark on Ethereum ETH recently hit profit taking targets of a Bearish Deep Gartley and it has now come back up a decent amount and formed a Potential Bearish Shark. This time i'd expect ETH to Fully Square Up the Range and really give us a nice down move if this Shark starts to play out.

EURUSD - 5-0 PatternAs you know, the Shark Pattern can move. That makes it the most dangerous harmonic patterns of all, but also the most rewarding ones.
