GBPCHF: Bearish Structure Aligns for Potential Sell Setups!Greetings Traders,
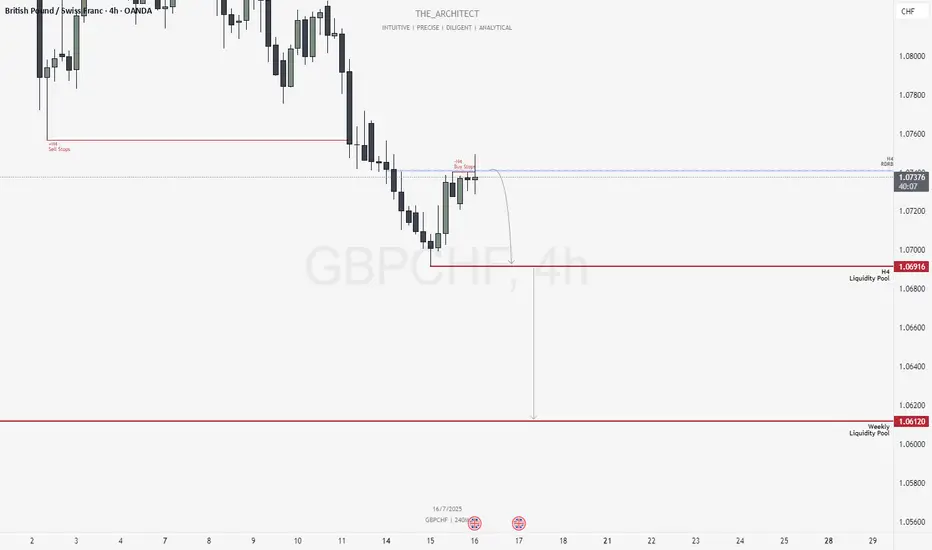
In today’s analysis of GBPCHF, we observe that the institutional order flow is currently bearish, and as such, we aim to align with this bias by identifying selling opportunities from key institutional resistance zones.
Higher Timeframe Context:
Weekly TF:
The weekly timeframe, which serves as our macro bias, is firmly bearish. This sentiment is reinforced on the H4 timeframe—our intermediate structure—which is also delivering consistent lower highs and lower lows. The alignment between these two timeframes strengthens our conviction to trade in the direction of institutional bearish order flow.
Key Observations on H4:
Re-delivered & Re-balanced Price Zone: Price has retraced into a previously balanced area that has now been re-delivered into, signaling institutional interest. Rejection from this zone adds to our bearish bias.
Buy Stop Raid: Price action has swept H4 buy stops in this area, providing confirmation that smart money may have used this liquidity for order pairing into short positions.
Entry Zone: The current rejection suggests a high-probability shorting opportunity from this region, provided confirmation on the lower timeframes.
Trading Plan:
Entry Strategy: Await confirmation at the current H4 resistance for short entries.
Targets: First target is the H4 liquidity pool located at discount prices. The longer-term objective is the weekly liquidity pool, which represents the primary draw on liquidity.
Continue to monitor price action closely, maintain patience for confirmation, and manage risk according to your trading plan.
Kind Regards,
The Architect 🏛️📉
Bearishstructure
CADJPY Breakdown Following Structural FailureHey Guys,
Today, we are trading the CADJPY live. Earlier this week, I highlighted 110.48 as a critical level to monitor, as it marks the reset point (Structure 4) of the last completed H1 bearish wave structure.
Key levels of interest for further downside movement:
109.56
109.06

Sell Laurus Labs cmp 431 target 380 stop 455Technically this stock has bearish structure on a hourly chart indicating weakness and fall to come in coming days. Fundamentally the recent quarters were extremely bad and it can easily correct to 380 levels. Big people seems to be distributing stocks on a higher levels, whenever demand become weak, the stock can easily correct 5% plus in a single trading session. So strongly recommend to aggressively short this stock and wait for big fall.

AUDUSD LONGFX:AUDUSD
AUDUSD broke bearish structure on the 1H chart. On the Daily chart, price tested on the strongest support level.
Waiting for a retest to go bullish on AUDUSD

AUDUSD LONGFX:AUDUSD
AUDUSD broke bearish structure, tested at resistance turned to support, bearish engulfing candle for a bullish setup

AUD/USD Technical AnalysisAfter the Ukraine war started Australian dollar made an attempt to break the daily market structure to the upside as Australia is a top commodity country, but failed to break structure and found resistance at the 0.76 area and formed a double top. Since then the price went back to a downtrend and formed another low. I expect the price to follow the Fibonacci extension levels and move even lower on the medium-term outlook. For better entry prices lower time frame analysis will be appreciable.

AUD/USD Technical AnalysisOn the monthly timeframe, AUD/USD prices are keeping the downward structure after creating a double top around 0.80 and bouncing off the bearish trendline several times. In the medium-long term, unless any unpredictable events happen, I expect the price to fall to the pre-covid area which is around 0.57.

GBPUSD ShortOANDA:GBPUSD
GBPUSD broke support and retested with a bearish engulfing candle in an overall bearish structure

BTC-W1-SHOOTING STAR !WEEKLY (W1)
Failure of the upside breakout of the weekly clouds triggered a SHOOTING STAR (reversal pattern !) !
In addition, the last weekly closing level @ 42'077 was also below the Tenkan-Sen (42'524) which is also an additional
bearish signal calling for a trend reversal towards the bottom of the clouds and potentially lower.
Next support to look at in this time frame are the following :
S1 : 40'922
S2 : 39'400 (39'552 is the double top target mentioned in my yesterday's analysis !)
S3 : 37'877
S4 : 35'710
Ongoing price action is showing a breakout attempt of the former uptrend support line (to be confirmed on a weekly basis, of course).
Nevertheless, there is still a remaining positive point : the Lagging line is still above the weekly clouds and above the Tenkan-Sen...
DAILY (D1)
Below :
1) the clouds
2) the Tenkan-Sen
still above :
1) the Mid Bollinger Band (the Barometer) @ 40'470
2) the ongoing daily uptrend support line (40'190)
3) the Kijun-Sen @ 39'400 (S2 on weekly)
Watch the clouds and the Bollinger Band as leading indicators !
4 HOURS (H4)
DOUBLE TOP STILL IN PROGRESS (mentioned yesterday, see related idea below) with the clouds still in support.
A breakout of the bottom of the clouds (40'900) also S1 on weekly chart would put the focus on lower levels previously mentioned
in both weekly and daily analysis.
ONLY A SUSTAINABLE MOVE ABOVE 43'500 WOULD NEUTRALISE THIS PERSISTING ONGOING DOWNWARD PRESSURE !!!
As usual, watch and monitor closely shorter intraday time frame to get more clues which will validate or invalidate the implications
previously mentioned.
Be sure, if you act tactically in countertrend to adopt a disciplined trading strategy (Risk Reward ratio) and in placing stop loss (trailing) accordingly.
Have a nice trading week.
Ironman8848 & Jean-Pierre Burki

SP500 MF-W1-BEARISH ENGULFING PATTERN !Last weekly candle triggered a BEARISH ENGULFING PATTERN !
Indeed, the failure to :
1) Recover above the Mid Bollinger Band
2) Hold above Kijun-Sen and Tenkan-Sen
is confirming this persisting downward pressure in this weekly time frame.
Looking ahead, it is likely to see an ongoing downside move with temporary recovery attempts in a countertrend
tactical move only...
Such kind of tactical rally, should, as already mentioned several times, be monitored closely with a disciplined RR (Risk Reward) approach.
STRATEGIC TARGETS REMAINS THE FOLLOWING :
1) Retest of former low @ 4186.50 (also roughly the weekly top clouds zone and the 23.6% Fibonacci retracement of the 2'174-4'808.25 BIG RALLY or + 121 % !)
2) The bottom of the weekly clouds which also coincides with the 38.2% Fib ret @ 3'802
3) the 50% Fibonacci retracement @ 3'491.25
4) and the 61.8% Fib ret @ 3'180.25
Do you think, such kind of correction is possible ?
Honestly speaking, I think so !
Why ?
The answer is pretty simple :
Watch from where the SP500 came from (2'174) and after a performance of more than 120%, a minimum correction of 38.2% should, at least, occurs and even 50% towards 3'491.25 !
And...this would not affect the long term (monthly) uptrend.
LAST BUT NOT LEAST, AS A GENTLE REMINDER, THE MONTHLY KIJUN-SEN IS ALSO AT 3'491.25 AND ONLY A CLEAR BREAKOUT OF THAT SUPPORT LEVEL WOULD DESTROY THE ONGOING LONG TERM BULLISH PICTURE.
By the way, if you like my analysis and if you find any added value on your trading activities, please do not forget to like it and for those who do not follow me yet on Trading View, please do not forget
either to add Ironman8848 in your following list.
And for those who do not have access to Trading View yet (from my personal point of view, the best charting application available at the moment) please do not hesitate to use the following link to sign up :
www.tradingview.com
Many thanks in advance.
Have a nice weekend
Ironman8848. & Jean-Pierre Burki

BTC-H4-EN ROUTE FOR 39'552 !Today, we are going to look at the 4 hours chart which is showing several (at least 5 !) interesting things
1) Double top in progress
2) RSI bearish divergence
3) Doji top, followed by a bearish engulfing pattern
4) Breakout of the Mid Bollinger Band
5) Lagging line cross under the Kijun-Sen
and last but not least, currently the BTC is already in the middle of the clouds in this 4 hours time frame.
So what next ?
On the UPSIDE , levels to watch now are the following :
1) Tenkan-Sen @ 42'387
2) The Mid Bollinger Band @ 43'159
3) The top of the clouds @ 43'526
and only a clear and sustainable recovery above 43'500 would temporary neutralise this persisting downside risk and postpone "for a while" this downward pressure...
On the DOWNSIDE, next supports are the following :
1) 50% Fibonacci retracement @ 41'060
2) Psychological 40'000 level
3) 61.8% Fibonacci retracement @ 39'929
4) DOUBLE TOP TARGET @ 39'552
GLOBAL PICTURE REMAINS HEAVY !!!
Looking briefly at longer time frames, it is not encouraging either :
DAILY (D1)
1) DOUBLE TOP in the clouds
2) Currently below the clouds
3) Tenkan-Sen broken
Nevertheless, still :
1) above the Mid Bollinger Band (@ 40'228)
2) above the ongoing support trend line (@ 40'000)
3) above the Kijun-Sen @ 39'400
4) the Lagging line is still stlightly above the Tenkan-Sen
INTERESTING TO NOTE THAT THE LEVELS PREVIOUSLY MENTIONED IN THE 4 HOURS ANALYSE ARE CORROBORATING THOSE MENTIONED ON THE DAILY ANALYSIS !!!
WEEKLY (W1)
A SHOOTING STAR is in progress (wait for weekly closing level) to validate or invalidate such kind of reversal pattern !!!
Weekly Tenkan-Sen @ 42'524
CONCLUSION FOR THE WEEKLY TIME FRAME :
A failure to close, above the clouds and the Tenkan-Sen would put additional selling pressure for the upcoming week with a focus on the weekly clouds bottom @ 37'360 which is
also, roughly the former weekly downtrend line.
Looking lower, IN THIS WEEKLY TIME FRAME there is not significant support area until the psychological 30'000 area ahead of the VERY, VERY, VERY, VERY IMPORTANT 28'600 SUPPORT LEVEL !!!
Have a nice Sunday.
By the way, if you like my analysis and if you find any added value on your trading activities, please do not forget to like it and for those who do not follow me yet on Trading View, please do not forget
either to add Ironman8848 in your following list.
And for those who do not have access to Trading View yet (from my personal point of view, the best charting application available at the moment) please do not hesitate to use the following link to sign up :
www.tradingview.com
Many thanks in advance.
Ironman8848. & Jean-Pierre Burki

NQ1-D1-WARNING TRIANGLE-TARGET @ 12'862Yesterday's price action, second consecutive long black candle, which firstly confirmed the previous BEARISH ENGULFING PATTERN (Feb 10th) and secondly
broke, on a closing basis the base of a triangle pattern.
Global picture is not encouraging for the upcoming week and this triangle pattern gives a technical target @ 12'862 which is roughly the same level of the first strategic target
I was calling for @ 12'894 in my previous analysis.
The weekly clouds support area (in overlay on this daily chart) will be the next zone to look at very carefully as a failure to stay above the weekly clouds first and above the former low
@ 13'706 would clearly open the way for the target previously mentioned (12'894-12'862).
RSI is converging to the downside too and the lagging line is also pointing to further downside.
After the recent decline, seen the last 2 days, we may see a pullback which is expected to be only a corrective move in a established broad bear trend calling for lower levels.
ONLY A CLEAR AND SUSTAINABLE RECOVERY ABOVE 15'000 (which means, above the cluster of TS,MBB and KS and last but not least above the top of the triangle resistance line) WOULD FORCE TO A VIEW REASSESSMENT OF THIS ONGOING DOWNSIDE RISK AND WOULD TEMPORARY NEUTRALISE THIS PERSISTING DOWNWARD PRESSURE.
Indeed,if such kind of rally should occur, as you can see on this daily chart the next barrier resistance will be the daily clouds zone currently around the 16'000.
Interesting to note the current thickness of the clouds (which means a clear fragility and which, in case of a strong and powerful reversal could be broken easily.
in addition watch also the shape of the daily clouds projection which are pointing to the downside and which in a couple of days will be around the 15'250-15'000 area, which also coincides with the former high (doji) reached on Feb 2nd and with the zone to be broken to stabilize the situation.
4 HOURS (H4)
Last closing level is below the Mid Bollinger (see my previous analysis), the KS and the TS.
Also below the clouds as the Lagging line too.
RSI is converging to the downside
No sign of bullish divergence yet in this H4 time frame.
WATCH PRICE ACTION ON SHORTER INTRADAY TIME FRAMES IN ORDER TO DETECT EARLY TACTICAL REVERSAL SIGNAL WHICH MAY GIVE YOU SHORT TERM COUNTERTREND TRADING OPPORTUNITIES WHICH ONCE AGAIN SHOULD BE MONITORED IN APPLYING A DISCIPLINED RISK REWARD RATIO IN PLACING STOP LOSS ACCORDINGLY.
WEEKLY PICTURE : WARNING !
Looking briefly, at the weekly chart, you can see that this last weekly price action triggered a BEARISH ENGULFING PATTERN after having failed to recover above both
the Tenkan-Sen (15'182) and the Kijun-Sen (15'236).
Weekly clouds support between 14'127 and 12'914
.
If you like my analysis, please do not forget to like it and for those who do not follow me yet, please also add Ironman8848 on your following list.
Last but not least for those who do not have a Trading view access ( the best application charting application available !), use this link to sign up :
www.tradingview.com
Have a nice weekend and have fun.
All the best.
Take care
Ironman8848 & Jean-Pierre Burki

NQ1-100-MF-ONGOING DOWNTREND !WEEKLY (W1)
Last week price action is showing a failure to recover and hold above both Tenkan-Sen @ 15'182 and the Mid Bollinger Band @ 15'577 which, for the time
being is confirming that the recent recovery was a corrective move only in a broad new bear trend.
Look at the shape of the last candle and make your conclusion !
RSI below 50, @ 43.62
Lagging line is in the middle of the uptrend channel, slightly above the TS.
So, in this weekly time frame there are 2 levels to look at :
UPSIDE : 15'200
DOWNSIDE : CLOUDS SUPPORT AREA (14'127-12'914)
BY THE WAY, MY FIRST STRATEGIC TARGET IS AND REMAINS @ 12'894
DAILY (D1)
The failure 3 days ago to confirm the upside breakout of the secondary downtrend line, the MBB and the KS, (doji confirmation =uncertainty !) triggered
this reversal in pushing down again the Nasdaq to retest the Tenkan-Sen (14'545), which for the time being acted as the daily support.
This ongoing downside price action is expected to continue over the upcoming trading sessions, calling for 14'350 ahead of the daily congestion bottom reached
at the end of January between 13'706 and 13'830 which also coincides with the top of the weekly clouds support area (in overlay on the daily chart).
RSI below 50, @ 43.20
Lagging line below the clouds and the TS.
On this daily time frame, a sustainable recovery above the Mid Bollinger Band (14'945) would temporary neutralise the ongoing downside risk and a breakout on a daily basis
of the Kijun-Sen (15'136) would reopen the door for higher level towards the daily clouds resistance area.
4 HOURS (H4)
Watch closely the clouds support area (14'550-14'380) as a failure to hold above this zone would, firstly, put direcly, the focus again on the former congestion bottom of end of Jan (13'830-13'706) ahead of
lower levels.
1 HOUR (H1)
Below the clouds and the Mid Bollinger Band
Caught between the cluster support of TS & KS and MBB.
On this hourly time frame, watch the following levels (hourly closing basis !) :
UPSIDE : Hourly clouds (14'727-14'858)
DOWNSIDE : 4 hours clouds (14'540-14'212)
Ironman8848 & Jean-Pierre Burki

NQ1 100 MF-D1-DOJI EVENING STAR !DAILY (D1)
Following the recent rally seen over the last couple of days, yesterday's price action triggered a "DOJI EVENING STAR" which closed slightly above
the Mid Bollinger Band..but as this kind of pattern is usually bearish, the Nasdaq opened today with a gap and roughly at the level of the ongoing uptrend
support line.
Today's price acton should be monitor very closely as a failure to recover above the Mid Bollinger Band (15'013) on a daily closing basis would add further selling pressure
calling for a move towards the first significant support level @ 14483 (TS); a daily closing level below 14483 would, again, put the Nasdaq below the former downtrend resistance line
and therefore increase the selling pressure accordingly, towards the weekly clouds support area (in overlay on the Daily chart( 13'975-12'903)
RSI failed to recover above 50, being currently @ 43.50.
Lagging line reversed too.
THE STRATEGIC TECHNICAL TARGET REMAINS @ 12'894 !
Only a sustainable move above 15200 would force to a view reassessment of the expected ongoing bearish scenario.
4 HOURS (H4)
Currently, still above the H4 clouds but already below TS and MBB in a new ongoing downtrend (in this H4 time frame)
The Lagging lane is again below the clouds .
Watch the clouds as the next support area (14'680-14'210);
38,2% Fib ret @ 14'714
50.0 % Fib ret @ 14'545
61.8% Fib ret @ 14'377
and 78.6% Fib ret @ 14'136 (roughly the bottom of the H4 clouds zone )
RSI slightly above 50 @ 50.77
1 HOUR (H1)
Currently in the clouds !
A failure to stay within the clouds and quickly recover above it would add conviction for further downside towards the levels
previously mentioned in H4
In this short term time frame the 15'000-15'200 area should be clearly broken on a closing basis; otherwise, as already mentioned
the downward selling presure will accelerate the move !
Ironman8848 & Jean-Pierre Burki

BTC-D1-MID BOLLINGER BAND. MY BAROMETERDAILY (D1)
The Mid Bollinger Band remains a very good indicator which I always consider as "MY BAROMETER" !
The Bitcoin failed to recover and close above the Mid Bollinger Band and as a result, yesterday's price action triggered
a long black bearish candle which closed (36'923), below the Tenkan-Sen (37'398)
In this daily time frame, as long as the Bitcoin does not recover and hold sustainably on a daily closing basis above the Mid Bollinger
Band, currently @ 38'690, downward selling pressure will remain !!!
A successful upside breakout of the MBB would cleary open the way for the psychological 40'000 level (38.2% Fib ret @ 40'206 ahead of 50% Fib ret @ 42'524)
4 HOURS (H4)
Failure to hold above the H4 clouds (uncertainty highlighted yesterday !) triggered a reversal price action which firstly broke the former uptrend support line and then
went further down towards the H4 clouds support area where it is traded currently, roughly in the middle of the clouds.
Global picture remains heavy and a failure to quickly recover, both above the clouds and the former uptrend support line which became now the new resistance line would trigger
further selling pressure, calling for lower levels towards the 36'000 area first (bottom of the H4 clouds) ahead of the 35'000 (last daily closing level) and lower towards the former low
@ 32'950
1 HOUR (H1)
The DIAMOND pattern I mentioned yesterday worked and its technical target of 37'300 has been filled.
Currently below all, clouds, KS, MBB and TS !!!
RSI is trying to recover in a sideways price action.
Watch TS (@ 37'156) as the first resistance in this short term time frame as a sustainable move above this level would temporary neutralise the ongoing downward selling pressure.
Do you like my analysis ?
Do you find any additional value to your trading strategies ?
If your answers are YES, please do not forget to like it and for those who do not follow me yet, please also add me on your following list.
Many thanks in advance.
Have a great trading day.
All the best
Ironman8848 & Jean-Pierre Burki

BTC-STRATEGICALLY WATCH THE WEEKLY CLOUDS !Firstly we are going to analyse what happened last week !
Indeed, the failure to recover, at least, above the middle level
of the previous candle (long black candle) confirmed that, the " BEARS " keep their advantage over the " BULLS ", at least,
for the time being !
In addition, a shy weekly closing @ 37'942 slightly above the weekly clouds bottom level (@ 37'360) is also showing a growing uncertainty and support fragility.
So what next ?
WEEKLY (W1)
NO SECRET... WATCH THE CLOUDS !
Indeed, the weekly clouds area (37'360 - 42'570) should be seen as a very good indicator for the upcoming trading sessions, as a breakout of one of those levels would have the following
implications :
ON THE UPSIDE :
A weekly closing above 42'570 (also the level of the Tenkan-Sen !) would confirm a bottom in place, calling for higher levels towards the psychological 50'000 area (Mid Bollinger Band (50'782) and Kijun-Sen or
Base line (50'975)
ON THE DOWNSIDE :
A weekly closing below 37'360 (weekly clouds bottom zone) would open the door for, firstly the former low @ 32'950 ahead of the psychological 30'000 support level; do not forget that the STRATEGIC TECHNICAL TARGET
REMAINS AT 28'600 WHICH SHOULD BE SEEN AS A VERY, VERY, VERY IMPORTANT LEVEL AS IT COULD BE :
A ) The double top trigger level which if broken (on a weekly closing basis) would have great heavy bearish implication in opening the door for much lower levels !!!
B) A potential double bottom, which if the BTC hold would give nice buying opportunity
DAILY (D1)
Ongoing downtrend still alive, caught between Tenkan-Sen (35'948) and Kijun-Sen (38'703) !
Watch the Lagging Line which is still, currently far below the daily clouds.
Ongoing downside price action on the RSI (countertrend corrective move only, seen so far !)
Watch both Tenkan-Sen and Kijun-Sen levels to get more clues about further development on a Daily basis.
A failure to stay and hold above the Tenkan-Sen would be the first warning signal, calling for lower levels, previously above mentioned.
On the other hand, a clear breakout of the Kijun-Sen which is also, currently, roughly the level of the downtrend resistance line would add further support, calling for higher levels
4 HOURS (H4)
The clouds... once again did its job perfectly well :-)in rejecting several upside breakout attempts !!!
Currently testing the bottom of the clouds... watch carefully price action over the coming hours, as a failure to hold above the bottom of the clouds (36'595) would also be an additional warning signal,
calling for lower levels.
Important to take note that the Kijun-Sen (H4) is at 37'126 which should also be considered as a very important support level !
1 HOUR (H1)
Already below the clouds !
I repeat it again...watch the clouds !
Have a nice afternoon and take care
Finally, if you like my analysis and if you find it add value on your trading strategies, please do not forget to like it and if you do not follow me yet, please add me on your following list too.
Many thanks in advance.
Kind regards
Ironman8848. & Jean-Pierre Burki

BTC-D1/H4-PERSISTING DOWNWARD PRESSURE!Yesterday's recovery price action, triggered on a closing basis, a "SHOOTING STAR". Indeed, after a failure to
recover above the bottom of the weekly clouds and above the daily Tenkan-Sen, the BTC closed @ 36'829.
Such kind of price action is, once again confirming this ongoing persisting downward pressure which is clearly showing
a mode of SELL ON RALLY and not yet a buy on dips, having in mind, of course, a STRATEGIC VIEW.
Nevertheless, it is quite clear that in this strategic and persisting downtrend price action there are plenty of tactical countertrend
trading opportunities which should be monitored accordingly in applying a strict Risk Reward approach !!!
DAILY (D1)
Yesterday's shooting star (similar scenario seen in Dec 24th and 27th) is weighing on the BTC which is likely to go lower in this daily time frame; first level
to watch is @ 35000 ahead of former low @ 32'950
Strategic target remains @ 30'000 ahead of the VERY, VERY, VERY IMPORTANT SUPPORT LEVEL @ 28'600 (former low of June 2021 and also double top trigger level !!!)
4 HOURS (H4)
Once again the clouds worked perfectly well in rejecting the upside breakout attempt (38'946) !
Since this rejection, the Bitcoin went down towards a low of 35'774, (50% Fib Ret filled @ 35'947) a couple of hours ago and is currently
trying to recover, caught, actually between the Kijun-Sen (35' 948) and the Mid Bollinger Band (36'398).
If the Mid Bollinger Band is broken on H4 closing basis, the next resistance level to watch is the Tenkan-Sen & Conversion line @ 37'240 ahead of the most important area to break,
which is once again the CLOUDS RESISTANCE AREA (37'650-38910); and last but not least the ongoing downtrend line resistance, currently @ around 40'300.
1 HOUR (H1)
Hourly clouds, for the time being hold and a downside breakout of the bottom of hourly clouds (@ 35'500) would open the door for lower levels (35'240 61.8% Fib ret ahead of 34'233 78.6% Fib ret extension).
CONCLUSION .
Monitor closely price action on the hourly chart and watch the clouds which will show you the direction :-)
Have a nice trading day
Ironman8848 & Jean-Pierre Burki

BTCUSD-W1-UNDER SELLING PRESSURE !Last weekly closing level @ 36'293, below the clouds and the ongoing weekly downtrend resistance line which
is confirming this persisting selling ongoing selling pressure, still in a mode of "SELL ON RALLY" and not in a "Buy on dips" yet !
WEEKLY (W1)
Last week price action triggered a long black candle which closed for the first time (since March 2020 !) below the clouds !!
Such kind of implication should not be underestimated and should be clearly seen as an important warning confirmation signal, calling for further
downside towards the psychological 30'000 support level ahead of the former low of 28'600 reached on June 2021.
RSI indicator still converging to the downside !
Last but not least 28'600 is a VERY, VERY, VERY IMPORTANT SUPPORT LEVEL, as it is the MAJOR DOUBLE TOP TRIGGER LEVEL !!!; therefore a breakout of
this level would accelerate the downtrend move towards lower levels...(former clouds congestion support 27'000-23'000).
DAILY (D1)
Yesterday's recovery attempt is currently neutralised by the today's price action which is showing a long black candle in progress (watch today's closing level) as there is
a potential bullish divergence in progress which also should, of course, be confirmed, on a daily basis closing level.
The Lagging line should also be watch at very carefully.
RSI in oversold territory (bullish divergence, YES or NOT, confirmation will be given at the end of today's trading session !)
4 HOURS (H4)
Currently in a sideways price action caught between 34'000 on the downside of the channel and 36'575 on the top of the channel.
Below the clouds, the Kijun-Sen, the Mid Bollinger Band and the Tenkan-Sen.
Watch also the Mid Bollinger Band, currently @ 36'045, in this H4 time frame which should always be seen as a good indicator and considered as a Barometer
1 HOUR (H1)
Hourly clouds are working perfectly well in rejecting upside breakout attempts... so far.
A sustainable breakout of the hourly clouds would be the first signal calling for further upside.
A failure to do it, will just confirm the ongoing bearish and persisting price action calling for lower
levels previously mentioned.
Have a nice week
All the best and take care
Ironman8848 & Jean-Pierre Burki

Bitcoin Massive Bear Structure?Following VWMA on 6 hr time-trame, the bearish structure follows the George Lindsay 3 Peaks & Domed House.
While this is not a daily chart, the framing is strikingly similar.
Serious divergence in overall market, resulting in likely major macro-economic correction impacting all markets in 2022.
Macro factors likely driving plunge further past long-term center channel:
- All assets since 2003 valuation +1,100%
- PPI (all commodities) has doubled since 2000
- S&P500 +300% since 2011
- M1 money supply +7,300% from 1976
- M2 velocity down about 50% from 2000
- DJIA +180% from 2011
- DXY (USD index) down 23% from 1986

BTC - STILL BELOW KS @ 32960 !Today we are looking at 2 time frames : D1 and H4
D1 :
BTC reached an intraday high so far @ 32'930 still below the first significant resistance level (32960 /KS) on D1 and
also currently still below MBB @ 32724.
No change in my view , watch carefully 32'960 and 31237 on daily closing level.
As mentioned, a breakout of one of those level would open the door, respectively :
on the upside, towards the very thick clouds resistance area (33650-44000 !!!)
on the downside, focus will be towards the 30'000 level and lower.
My strategic target remains @ 27'169
H4 :
For the time being the top of the clouds rejected two breakout attempts; potential double top in progress !!!
Interesting to note that the top of the clouds coincides roughly with the level of KS on D1 and therefore, price action over the current and coming H4 period (s) should be watch at very carefully.
Have a nice trading day and all the best.
May your long goes up and your short goes down :-)
Take care
Last but not least, if you like my analysis and you find that it bring you an added value on your trading strategies, please like my ideas and for those who did not follow me yet
do not forget to add Ironman8848 on your following list. Many thanks in advance.

BTC - D1 - FAILURE TO CLOSE ABOVE KS @ 32960 !Today, we are going to look at the daily time frame and especially at the yesterday's price action which has been very interesting.
Indeed, KS (32'960) worked, once again perfectly well as the important resistance level to break coupled with
the failure, to also breakout on the upside the MBB (32'822).
In addition, the downtrend channel is still intact.
Therefore, today's closing will be very important and closing levels to watch at are the following :
ON THE UPSIDE : 32'960. (KS)
ON THE DOWNSIDE : 31237 (TS)
A sustainable move either above 32'960 or below 31'237 would open the door for the following targets :
ON THE UPSIDE :
BOTTOM OF THE CLOUDS AROUND 33'700 (IMPORTANT TO NOTE THE THICKNESS OF THE CLOUDS WHICH ARE CURRENTLY VERY THICK WHICH MEANS
VERY DIFFICULT TO BREAK ON THE UPSIDE !!!
ON THE DOWNSIDE :
FOCUS WILL BE AGAIN ON THE FORMER LOWS (BELOW 30'000) WHICH ALSO COINCIDES WITH THE BOTTOM SUPPORT LINE OF THE ONGOING DOWNTREND CHANNEL.
CONCLUSION .
DOWNTREND STILL INTACT, RECOVERY WENT SLIGHTLY HIGHER THAN EXPECTED, WHICH PROVIDED BETTER SELLING OPPORTUNITY CALLING FOR MY STRATEGIC
TARGET OF 27'169

BTC - GLOBAL OVERVIEW M1 : Still in a broad bear trend. Monthly pivot level @ 34372
W1 : Same than M1, any recovery should still be seen as a corrective move only and not as a strategic trend reversal yet !
D1 : Clear downtrend channel in place, below TS,KS and MBB. Only a move above KS @ 32'960 would neutralise for a while
the current downside selling pressure. First significant resistance level on that time frame is @ 31318 (TS)
H4 : INTERESTING TO NOTE THE SHORT TERM RECOVERY FROM ITS LOW REACHED @ 29300 YESTERDAY TOWARDS A HIGH SO FAR
OF 30'950, SLIGHTLY ABOVE THE KS (30'868) AND 50% FIBONACCI RETRACEMENT (32242-29300) @ 30877.
LOOKS LIKE A SELL ABOVE 30'800 AND TOWARDS 31'318
H1 : Clouds worked perfectly well as an important resistance level on this time frame. Watch carefully upcoming period (s) price action, which
will validate or invalidate a potential upside clouds breakout.
M30 : Above the clouds, looks a little bit tired...
M15: Same than M30, watch TS (30'802) as very short term support level which will corroborate my H4 view above mentioned
M5 : Potential very short term double top (30'950), trigger @ 30'655
CONCLUSION :
No change in my bearish expected scenario, calling for my first strategic target @ 27'169, which is the 61.8% Fib ret (3850-64'895)
BTC remains a SELL on rally and any tactical long exposure should be protected with a tight trailing stop loss in a very disciplinated Risk & Reward
approach
Have a nice trading day
All the best and take care
Last but not least, if you find my analysis as an added value for you, please do not forget to like my ideas and for those who do not follow me yet, please add
Ironman8848 to your following list, Many thanks in advance. :-)

BTC - H4 - FALLING WEDGE & DOWNTREND CHANNEL...Today we are looking at the H4 time frame where you can clearly identify a falling wedge & downtrend channel !
BTC is currently below the clouds resistance area (33500-34000) in this 4 hours chart and also below 2 important levels which are, respectively :
1) MBB @ 32'822
2) Kijun-Sen @ 33'133
and slightly above Tenkan-Sen @ 32'384 (very shy !)
So what next ?
Well, I do not change my view about further development to come which is calling for further downside towards, firstly to the former low @ 31'589 and if it is the case, I would suggest to watch carefully on intraday time frames, at the technical indicators and mainly to the RSI to potentially detect some bullish divergence (s) which could trigger a tactical recovery supported by the base of the falling wedge pattern.
A failure to hold above the support line of this pattern would then confirm further downside in the cards calling for 30'300 ahead of 30'000 as already mentioned in the past.
My strategic target remains 27'169, this level being the 61.8% Fibonacci retracement of the big 3850-64895 rally; once this level will be reached, situation will be reassessed :-)
On the upside, first significant resistance @ 33'500-34'000 and only a sustainable move above 34'000 would force to a view reassessment of my expected bearish scenario.
All the best and take care
If you like my analysis and if you find this is an added value for you, please do not forget to like it and for those who do not follow me yet, please add Ironman8848 to you following list, Many thanks in advance,
Kind regards
Ironman8848
