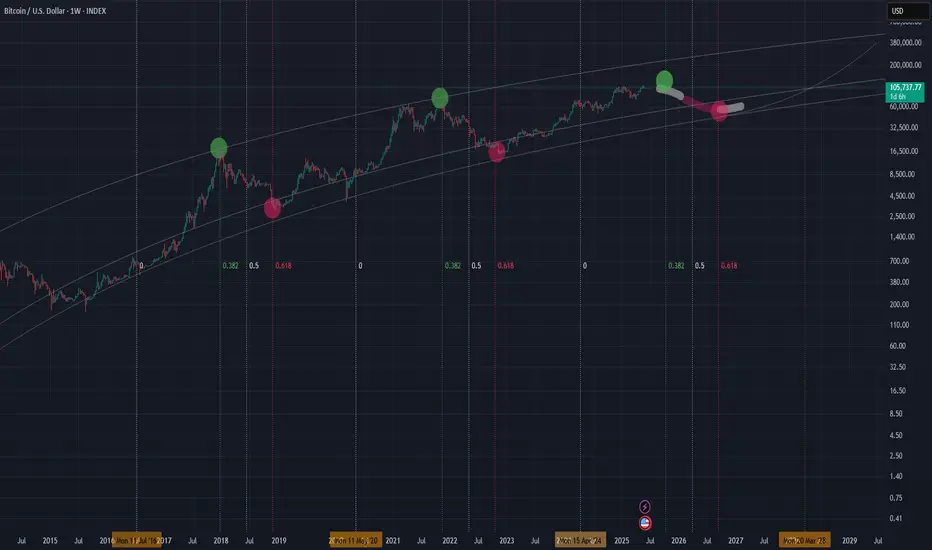
Trend Base Fib Time suggesting getting out before October 2025!I have been warning you that time is running and a few months left before things start cooling off. This tool is trend base fib time , measured from one halving till the next one. I assumed halving in 2028 at some point in march so this result in a target of October to be the month matching with the 0.382 when peaks use to be found. The 0.618 would be the one for catching the bottoms around Sep 2026. Secure some gains and buy back at next bear market lows close to 40k. Cheers
Bearishtrend
Crypto bull market might be ending pretty soonI am warning you that we might seeing the last days of the bull market. SO FAR histogram is printing the first red candle(we need to verify once June ends). Look what happened with btc once LMACD crossed above 0. Winter is coming.

AJA's Gold view. The Bear is in charge for now.Just the start of the Bearish move.
Like I analysed. For now, we're selling till 3315.
Check my last analysis. What do you think?

US & Global Market Breakdown | Profits, Losses & Bearish TradesIn this video, I break down the current state of the US and global economy, and why I believe we’re heading into a bearish phase.
📉 Fundamentals:
I cover the key macroeconomic factors influencing the markets — including Trump’s proposed new tariffs, slowing GDP growth, and ongoing supply chain constraints. These all point toward increasing pressure on the global economy.
📊 Technical Analysis:
I go over the major indexes and highlight their recent behavior. We’ve seen reactions from resistance levels, contraction patterns forming, and a significant volume dry-up — followed by today’s spike in volume, which occurred right at resistance. These are potential signs that the market may be shifting toward a bearish trend.
That said, we could still just be witnessing a deeper pullback within a longer-term uptrend. Markets are unpredictable, and no one knows for sure — which is why it’s important to always do your due diligence.
💰 I also review the profits and losses I’ve taken on recent bullish trades, and why I’ve now positioned myself in select short opportunities based on what I’m seeing.
If I’m sharing this, it’s because I’m personally investing my capital based on my conviction — so always use your own judgment and risk management when making decisions.
If you found value in the breakdown, leave a like, comment, and subscribe for more timely updates.

RSI suggesting BTC top prices?I have my doubts and personally believe this cycle might still extend till later this year. But according to the RSI technicals this might be the top or one of them. MACD is applied on the RSI indicator. MACD has crossed what signals a possible reversal of the bullish trend.

BTC/USDT – Retest in Play After Breakdown!Bitcoin broke below its 4H ascending trendline and is now showing signs of a retest at the broken trendline zone.
It tried to break the immediate resistance of $105,100 but couldn't sustain it.
📉 Breakdown confirmed
Key Levels:
Resistance: $105,968 | $108,941
Support: $101,539 | $97,205
Bearish Target remains near $97K if rejection holds
Watch how the price reacts here — rejection could lead to further downside. A break back above $105K may invalidate the move.
#Bitcoin #BTCUSDT #CryptoTrading #TechnicalAnalysis #TrendlineBreak #Retest #BearishSetup #PriceAction

Time to Cut down on Sugar ? Reasons for being bearish on sugar for 2025 season with target price of 15 :
1) Head and Shoulders pattern bearish breakout on Raw sugar below 17 on the monthly timeframe. Price is now trading below the lows of 2022 highlighting potential oversupply of sugar for 2025 season.
2) Recent Unica reports suggesting increase in sugar production in centre-south Brazil.
3) Brent oil is trading below 64 as on date which weakens ethanol pricing thereby leading to farmers diverting more cane towards sugar production
4) USDBRL currently at 5.66 and any depreciation leading above 6 will make sugar exports more favorable leading to increase in supply and price correction.
This view will get negated if price reclaims the level of 18.

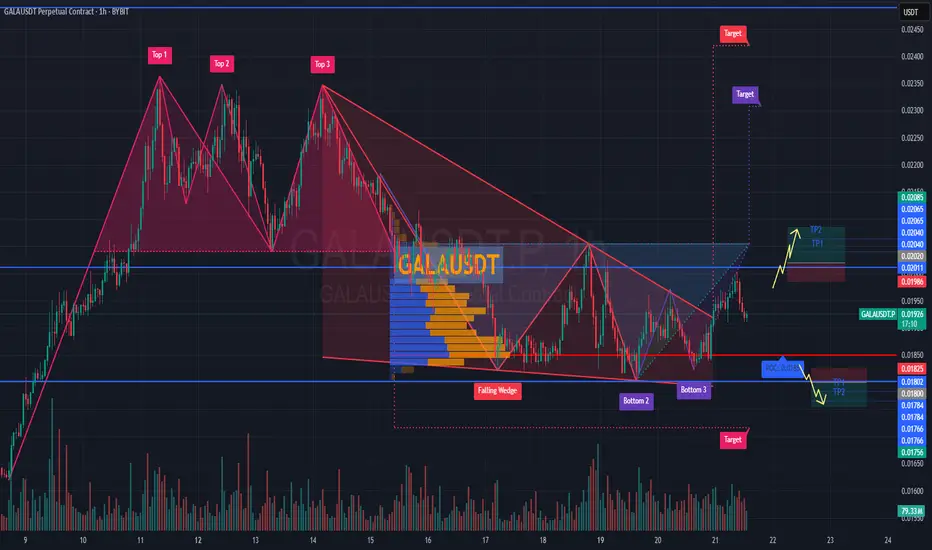
Forecast for #GALAUSDT📉 Forecast for BYBIT:GALAUSDT.P (1H TF)
🕒 Current Situation: The price is in a key decision zone near POC $0.01851, consolidating after a breakout from the Falling Wedge pattern.
➡️ The direction depends on the reaction to this area.
✅ Overview:
➡️ A Triple Bottom (Bottom 1-2-3) pattern is visible — a bullish signal.
➡️ Price broke out of the wedge and is now retesting.
➡️ Two scenarios remain: LONG if support holds or SHORT if it breaks.
📢 Bullish sign: candle wicks down + rising volume on bounce.
🧭 Watch price action and volume near $0.0185–0.0190.
************************
📈 LONG SCENARIO - Conditions: Holding above $0.0190
Entry: BYBIT:GALAUSDT.P from $0.02020
🛡 Stop loss: $0.01986
🎯 TP Targets:
💎 TP 1: $0.02040
💎 TP 2: $0.02065
💎 TP 3: $0.02085
📍 Confirming bullish strength after wedge breakout.
**************************
📉 SHORT SCENARIO - Conditions: Break and close below $0.0185
Entry: BYBIT:GALAUSDT.P from $0.01800
🛡 Stop loss: $0.01825
🎯 TP Targets:
💎 TP 1: $0.01784
💎 TP 2: $0.01766
💎 TP 3: $0.01756
📢 Confirmation: high volume + multiple closes below POC.
⚠️ Losing $0.0185 reactivates the bearish structure toward $0.01700.
🚀 Conclusion: We are in a decision zone.
📍 Hold above POC = bullish setup.
📍 Breakdown = bearish setup.
📢 Wait for confirmation with volume and price reaction BYBIT:GALAUSDT.P
Wyckoff distribution on FET/USDI noticed this Wyckoff distribution pattern that has formed on the 1h time frame for FET/USD and it convinced me this might be a good time to step out and wait.
The crypto market has been going sideways since last week now and we didn't really get a strong rebound after the selloff a few days ago. Even with the positive Macro news it's starting to feel like there's just not enough buyers around right now to push BTC and everything else to higher highs. My advice is to be cautions now and wait for a correction, then enter at more favorable prices.

Possible Move For NZD JPYLooking at the Daily, 1hr and 15m charts. I feel moves will continue to be bearish. Heading into fill the 15m FVG. Possible small move up from here before continuing down to fill the Daily FVG and aiming for the next big price zone of around 83.413. Let's see.

Gold - All eyes on Wednesday 08 May - FED🟡 Gold Traders: Nothing Matters Until Wednesday! ⏳💤
Hey traders! 👋
This week, all eyes are on Wednesday... and everything before that? Mostly noise.
Let me break it down for you. 👇
📊 Technical Outlook
Gold is chilling above a key resistance level right now.
Trendlines suggest we won’t see any major moves before Wednesday unless big news drops. 📰
🕐 Asian session is kicking things off above resistance.
If bulls show up there, we could break Trendline 1 (Image below) and head towards the $3300 🎯 target.
📉 RSI across multiple timeframes? Pretty neutral.
If Asia trades flat or slightly bearish, gold might range between $3210–$3250.
Break below $3201, and things could get shaky... but the European session might push us back above that support.
U.S. session on Monday? Likely a sideways snoozefest 😴 (unless surprise news hits).
🎯 Trade Setup (Mon–Wed)
I’m looking to play the range between:
$3261 (Trendline 2) 🔼 and $3169 (Trendline 4) 🔽
That’s a comfy $90 window I’m aiming to trade before Wednesday's fireworks. 🚀
🔮 After Wednesday – The FED Factor 💣
Here’s the real catalyst:
Wednesday, May 7 at 2:00 PM EST – FOMC Rate Decision
If the FED cuts rates (not likely, but possible under pressure), gold could tank hard. 💥
I’m talking a potential drop to $3150 or lower 🕳️📉
That’d be a -$90+ move easy.
FED has been holding the line 💪, resisting pressure (especially from Trump back in the day), but if the economy flashes red, that rate cut might come sooner than expected.
🧠 Final Thoughts
FED paused hikes, but left the door open for 3 rate cuts this year.
Until we get more clarity, no strong bullish signals on gold.
My bias stays: Bearish unless proven otherwise. 🐻💬
Stay sharp out there, and watch those sessions. Wednesday’s the real deal! 💼📉
And last but not least, look at this and let us know what you think about please:
Some would say its impossible but as we know, gold can do everything!
-------------------------------------------------------------------------
This is just my personal market idea and not financial advice! 📢 Trading gold and other financial instruments carries risks – only invest what you can afford to lose. Always do your own analysis, use solid risk management, and trade responsibly.
Good luck and safe trading! 🚀📊

USD/MXN Mirrors 2017 Reversal; Elliott Wave Pointing Lower Back in 2016–2017, we first saw a very sharp recovery on USD/MXN, but when Trump took office in January 2017, the market reversed strongly lower, falling all the way from 22 to 17.60, lost nearly 20% . That very similar pattern is now becoming visible again with 2024–2025 price action. Last year, after Trump won the US election, we saw significant depreciation of the Mexican peso, but since he has officially taken office in January, we’re seeing a complete reversal—just like in 2017.
In fact, the Mexican peso has been gaining nicely over the past few months, likely based on speculation that Trump will find the agreement and trade deals with other countries, particularly related to tariffs. Since no one really benefits from trade wars, it’s not surprising that even Trump’s recent remarks reflect an acknowledgment of the global situation being unsustainable, especially when it comes to CHINA-US trade.
With that in mind, markets in general are likely to recover, and we’re already seeing some nice rebounds. And when stocks are in recovery mode, commodity currencies—including the peso—tend to perform well.
Looking at USD/MXN specifically, we’re seeing a strong reversal down from February highs, just like in 2017. The current drop hasn't even retraced 38.2% of the 2024 rally yet, which suggests more downside is likely—ideally toward the 19.00 area, maybe even 18.00 by year-end.
From an Elliott Wave perspective, it's useful to zoom in on smaller time frames. The structure doesn’t look like completed impulse yet, so technically there can be more weakness coming. Resistance for wave four rally sits around the 19.77–19.84 zone, which aligns with Fibonacci projections for wave four, as well as swing lows from March and April.
This area could serve as a nice resistance of the current bounce, especially if the Fed delivers any dovish remarks this week. No rate cuts are expected, but even a hint at future cuts could send the US yields lower, which would weigh on the dollar and support risk assets—meaning commodity currencies could outperform.
In that case, USD/MXN could ideally fall back below 19.50.
Elliott Wave analysis also helps define clear invalidation levels, very important when it comes to potential trade setups. In this scenario, 20.16 is a key level to watch. A break above it would overlap with the start of the current move and signal that the bears are finished for now, thus I would need to adjust the view accordingly.
Grega

CONFUSION SETS IN.....Hello! You are looking at a 6 hour chart, here.
Starting out, we can see the 100 day moving average starting to ascend above the 14 day moving average, which indicates bearish momentum is building!
On the other hand, we can also see what appears to be a bullish pennant forming, which indicates bullish momentum to the upside.
As a disclaimer, I have not taken into account volume or any oscillators, but it appears this pair will be bullish for the short term, but bearish in the long term.
Depending on whether you are a long term or short term trader, I personally like what I am seeing from this 6 hour chart! Let me know if this was helpful for you! I love to read comments. Thank you for reading. Trade wisely.

Fall Down to $70 ApproachingWith the RSI above average since mid-April 2025, the trend has been steadily rising up to $82 per share even breaking the highs from late February and March.
Price projected onto both (A and B) Inside pitchforks is well above the median line. In the pitchfork A the price is even directly touching the upper parallel line.
Reversal near the highest achieved price this year on 21st February is probable
Based on these indications, we can expect a fall to around $70 somewhere in the middle of May.
Key details:
RSI over "overbought" level
Price in both Inside pitchforks near the upper parallel line
Longer uptrend = breakdown necessary

USDCHF: More Bearish Order FlowSimilar to USDJPY , USDCHF has exhibited a change of character, initiating a bearish order flow for the week. Price has reached a key point of interest where a potential continuation to the downside could occur. The DXY is reflecting similar behaviour, supporting the bearish outlook.
An entry position has been established, and now it is a matter of monitoring the trade and allowing the market to develop accordingly.

#WALUSDT continues its bearish momentum 📢 As long as the price stays under $0.6000 — short BYBIT:WALUSDT.P bias remains valid.
📢 Watch for further weakness!
📉 SHORT BYBIT:WALUSDT.P from $0.5794
🛡 Stop loss: $0.6000
🕒 Timeframe: 1H
✅ Overview:
➡️ The chart shows a clearly formed and broken Bearish Rectangle, confirming a short setup after price exited the range to the downside.
➡️ The $0.6090 support level has turned into strong resistance.
➡️ Entry at $0.5794 follows a textbook breakdown and retest structure.
➡️ Target area aligns with the volume-based support near POC $0.515, offering solid R:R.
🎯 TP Targets:
💎 TP 1: $0.5725
💎 TP 2: $0.5665
💎 TP 3: $0.5600
📢 Bearish structure confirmed with increased volume.
🚀 BYBIT:WALUSDT.P continues its bearish momentum — downside potential remains active!

Lighten Up! After a rounding bottom where it looked as though the bulls were forming a base, we now see a long bearish red candle hinting at the bears denying a bullish breakout. I wouldn't close positions here, but I would lighten up on longs. Follow me for more simple to understand expert analysis. Thank you for reading. Now get out there and trade! :)

Trump back off and so does the EUROWith the recent news of Trump backing off of Tariff enforcement and his decision to not fire the FED chair, the the EURO waterfalls back down fast as the bears takeover! I'm holding off until I can find reliable support and looking at a price target around 1.26'ish.

Why This Bearish Trend Is Actually a Bullish Opportunity?Understanding the Multi Timeframe Analysis – Part 2 of 2
Alright from the prior post we talked about how the corrective move on the 4H timeframe turns out to be a bearish trend on the 1H chart. Now, let’s dive deeper into that 1-hour chart.
In this 1H chart, we can observe a trend shift from bullish to bearish.
Before the red arrow, we can clearly see a bullish structure:
Blue arrows continue to form higher lows, and
Orange arrows form higher highs (except one minor failure, which still maintains the bullish structure because price doesn’t break the previous low).
But everything changes after the red arrow:
Orange arrows fail to create new highs,
Blue arrows start forming lower lows,
→ confirming a bearish reversal on the 1H timeframe.
So… How Can We Use This Bearish Trend as a Bullish Opportunity?
Here's where it gets interesting — instead of seeing the bearish trend as a threat, we use it for better entry with an improved risk-reward ratio.
But here’s the catch – some conditions must be met:
Make sure the bigger timeframe (4H) still supports a bullish trend.
Wait for price to drop lower than the last blue arrow (prior low).
Look for bullish divergence + candlestick confirmation before entering.
Once you get the signal, you can place your stop loss below the confirmation candle to limit your risk.
What If Price Breaks the Orange Arrow (Prior High)?
If price invalidates the bearish structure by breaking the previous high, that means:
The 1H bearish trend is over.
The pullback on 4H timeframe is done.
And price is likely resuming the main bullish trend.
So, whether price goes lower or higher — you’re ready either way.
Alright, that’s my take on using multiple timeframes—hope it helps clear up any confusion you had! Let me know your thoughts in the comments. See you in the next post!

Markets next move will depend on its interaction with Key LevelsGold Analysis
MSS & FVG+Breaker Zone
Gold has given an MSS (Market Structure Shift) and touched the FVG+Breaker Zone, followed by a downward move. Given the current market structure, potential areas to watch for a stop and potential upside pump could be:
Possible Downside Targets:
1. $3321 liquidity level
2. Higher Time Frame (HTF) PD Arrays
Potential Upside Pump
If the market reaches these areas, we might see a pump upwards, driven by liquidity and market structure.
Key Levels to Watch:
- $3321 liquidity level
- HTF PD Arrays
Market Direction
The market's next move will depend on its interaction with these key levels. A potential bounce from these areas could signal an upside pump.
Let's monitor the market's movement and adjust our analysis accordingly.

$OM MANTRA coin analysis Hi 👋🏻 it's me your " Raj_crypt0 " ..... 💚
will BINANCE:OMUSDT next KRAKEN:LUNAUSD
" Yes , I hope so - 90% new High not possible
I hope it's not possible "
coin already got squeezed at $5/5.5 in weekly to 3 month time frame as weakness we can observe
Upcoming downtrend 📉 target 🎯 is - $0.1
$0.1 / 0.0875 ...... 🎯 Support 💪🏻 let me meet u there 😂
" U have a question ⁉️ does ' alts season ' & ' BULL RUN ' completed - obviously 🙄 ' NO ' "
CRYPTOCAP:TOTAL haven't reached 5T 🎯 - still season was around corner
" Some coins complete early bull , some late _&_ some on time " nothing much ✔️

Idea for Mon 14 Apr - Gold Short – Bear in a Bull OutfitOANDA:XAUUSD
Gold has been heavily influenced by recent developments in the trade war.
A 90-day pause on tariffs (excluding China) and the exemption of smartphones and computers from tariffs were announced on friday.
These headlines may temporarily calm markets and give stocks room to rise — which typically puts pressure on gold. If Dollar is rising again, could be a side effect too.
This could lead to a short-term pullback in gold prices.
A price gap was formed around $3175.51 during the opening session on Thursday, April 10th.
After a small bounce, i expect gold to move downward to fill that gap.
A potential support level is sitting near $3156, which could act as a bounce zone.
"Next week it’s a bear inside a bull outfit."
Despite a broader bullish structure, we could see the week start with a correction. A classic gap-fill setup for the short-term traders.
RSI and MacD are on top levels, but for how long?
-------------------------------------------------------------------------
This is just my personal market idea and not financial advice! 📢 Trading gold and other financial instruments carries risks – only invest what you can afford to lose. Always do your own analysis, use solid risk management, and trade responsibly.
Good luck and safe trading! 🚀📊

''Altseason 2025''Welcome back dearest reader,
I will probably get alot of backlash from bitcoin maxi's for writing this post, i have read and heard it all by now. I'm not disregarding their opinion on bitcoin and i think it will do well, but not as well as some altcoins which i have monitored.
First the technical part:
~Bitcoin has seemingly formed a double top pattern with now on the weekly a gravestone doji (confirming this sunday). Looking at previous action from 2019 and 2020, these have been topping indicators and indicate a bearish reversal which in turn will be bullish for altcoins.
~ MFI --> massively overbought.
~ Stoch RSI --> nearly at 100! Screaming for a reversal.
Over the past months everyone seemed to think ''this is the top, only to see dominance rise further and alts bleeding''. It is possible that BTC.D doesn't correct immediately, but i do suspect an altseason to be really close.
Sentiment: When everyone... i mean EVERYONE is bearish. ''Alts to zero'', ''bitcoin is the only good coin'', ''Ethereum is dead''. This has historically been the perfect time to buy. And that time is now.
''But, there are over 13 million altcoins now!''
Yes this is true, i don't think all of them are going to do well, stick to the ones available on big exchanges. Those have 400 different ones on average. From those i have covered some allready which i think are going to do well, it's worth your time to look at those ideas.
Any questions?
Ask.
~Rustle
