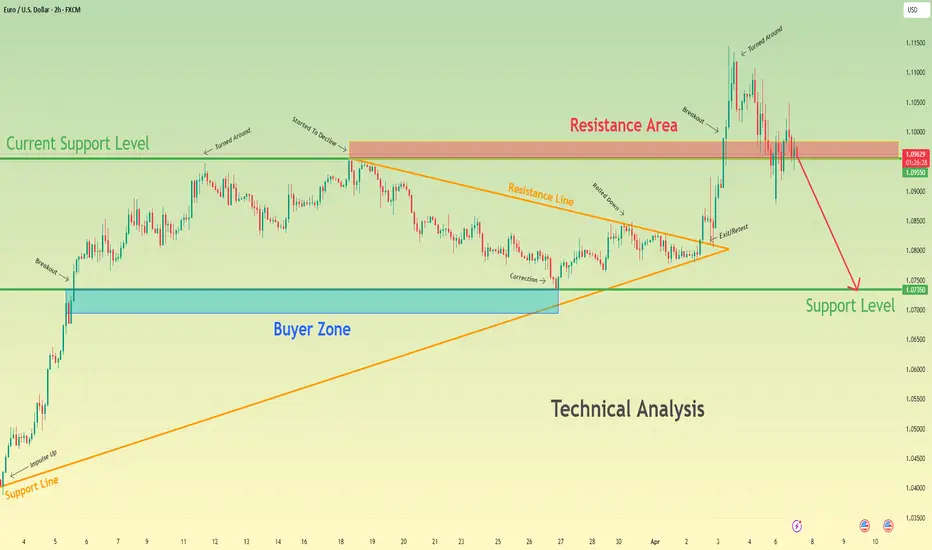
Euro will break current support level and drop to 1.0735 levelHello traders, I want share with you my opinion about Euro. Recently, the price completed a pennant pattern, which resulted in a breakout to the upside. This breakout, however, didn’t gain much ground - the movement quickly lost momentum inside the resistance area between 1.0955 - 1.0985 points, where Euro sharply turned around. The reversal from this zone wasn’t unexpected, considering this level had already acted as resistance earlier. What followed was a clean break below the current support level at 1.0955 points, which shifted the market structure back to bearish. Now the price is trading lower, and the bearish impulse looks set to continue. My expectation is a further decline toward the support level at 1.0735, which also aligns with the buyer zone between 1.0695 - 1.0735 points. This level may act as the next potential area of interest where buyers could attempt a defence. The invalidation of local support, weakness after the breakout, and strong supply reaction from resistance all point to a high probability of continuation down toward TP 1 - 1.0735 level. Please share this idea with your friends and click Boost 🚀
Bearishtrend
Nasdaq Enters Correction Territory Do we go Deeper
Monthly analysis done on the NQ with the ambition to connect with current price activity and gauge a deeper technical understanding on if this is just the start of a bigger correction for the year ahead . Tools used in this video Standard Fib , TR Pocket , CVWAP/ PVWAP Incorporating PVWAP and CVWAP into trading strategies allows for a more nuanced understanding of market dynamics used to assess trading performance and market trends.
Date and price range and trend line .
Some research below regarding the previous correction that I reference the technicals to in the video .
In November 2021, the Nasdaq reached record highs
However, concerns over rising inflation, potential interest rate hikes by the Federal Reserve, and supply chain disruptions led to increased market volatility. These factors contributed to a correction in the Nasdaq, with the index experiencing notable declines as investors reassessed valuations, particularly in high-growth technology stocks.
VS Today
March 2025 Correction:
As of March 2025, the Nasdaq Composite has faced another significant correction. On March 10, 2025, the index plummeted by 4%, shedding 728 points, marking its third-worst point loss ever, with only earlier losses during the COVID-19 pandemic surpassing this.
This downturn has been attributed to several factors:
Economic Policies: President Trump's announcement of increased tariffs on Canada, Mexico, and China has unsettled markets, raising fears of a potential recession
Inflation Concerns: Investors are closely monitoring upcoming consumer-price index (CPI) reports to gauge inflation trends, as higher-than-expected inflation could hinder the Federal Reserve's ability to lower interest rates, exacerbating stock market declines
Sector-Specific Declines: Major technology companies, including Tesla, have experienced significant stock price declines, contributing to the overall downturn in the Nasdaq
Comparison of the Two Corrections:
Catalysts: The November 2021 correction was primarily driven by concerns over rising inflation and potential interest rate hikes. In contrast, the March 2025 correction has been influenced by geopolitical factors, including new tariff announcements, and ongoing inflation concerns.
Magnitude: While both corrections were significant, the March 2025 correction has been more severe in terms of single-day point losses. The 4% drop on March 10, 2025, resulted in a loss of 728 points, marking it as one of the most substantial declines in the index's history.
Investor Sentiment: Both periods saw increased market volatility and a shift towards risk aversion. However, the recent correction has been accompanied by heightened fears of a potential recession, partly due to inconsistent government messaging regarding economic prospects.
In summary, while both corrections were driven by concerns over inflation and economic policies, the March 2025 correction has been more pronounced, with additional factors such as new tariffs and recession fears playing a significant role.

No Signs of the Bull ArmyDow Jones Update : The correction appears likely to continue, testing the 40,045–40,467 range. Subsequently, the index is expected to rebound toward the 40,714–40,945.
Additionally, it is worth noting the gap in the 41,173–41,629 range—perhaps the market may find its way there.

EUR/GBP (1H) – Rising Wedge Breakdown & Short Trade Setup1. Overview of Market Structure
The EUR/GBP pair is forming a Rising Wedge Pattern, a well-known bearish reversal formation, which suggests that the current uptrend may soon reverse into a downtrend. The price has been moving within a tightening range, making higher highs and higher lows, but the upward momentum appears to be weakening.
A breakdown from this wedge is a strong bearish signal, indicating that sellers are gaining control, and a significant price drop is expected.
2. Chart Pattern: Rising Wedge – Bearish Reversal
A Rising Wedge is a pattern that occurs when price moves upward within a contracting range. This pattern typically forms after an uptrend and suggests that bullish momentum is slowing down.
Characteristics of the Rising Wedge in This Chart:
The price has tested the upper resistance zone multiple times, but each attempt has resulted in a rejection.
The lower support trendline has been tested frequently, showing that buyers are losing strength.
The breakdown of the wedge signals a strong bearish move, with price expected to drop toward key support levels.
This pattern becomes valid once the price breaks below the lower trendline, confirming the bearish outlook.
3. Key Technical Levels & Zones
A. Resistance Zone (0.84853) – Strong Supply Area
Marked as a Resistance Zone, where price has struggled to break through.
Sellers have stepped in around this level multiple times, preventing any further bullish movement.
Acts as a major stop-loss level for bearish trades, as a breakout above this zone could invalidate the setup.
B. Support Zones (Potential Take-Profit Targets)
1st Support Level (TP1) – 0.82539
This level has previously acted as strong support, where buyers have entered the market before.
A short-term pullback or consolidation may occur here.
2nd Support Level (TP2) – 0.81332
This is the final bearish target, marking a key demand zone from where price has bounced in the past.
If bearish momentum continues, price could reach this level, making it an ideal take-profit zone for swing traders.
4. Trading Strategy & Execution
A. Entry Strategy
A short trade is ideal after the price breaks below the rising wedge pattern. There are two possible entries:
Aggressive Entry:
Enter immediately after the breakout of the lower trendline, anticipating strong downside momentum.
Higher risk as price might retest the trendline before moving down.
Conservative Entry:
Wait for a retest of the broken trendline before entering short.
This confirms the breakdown, reducing false breakout risks.
B. Stop-Loss Placement
Stop-loss should be placed just above the resistance zone (0.84853).
This prevents being stopped out by minor pullbacks before the actual move happens.
C. Take-Profit Targets
TP1: 0.82539 (First major support level – potential profit booking area)
TP2: 0.81332 (Final bearish target – strong demand zone)
5. Risk Management & Trade Management
Risk-to-Reward Ratio (RRR)
This trade offers a high RRR, making it an attractive setup.
The stop-loss is small compared to the potential downside move.
Trailing Stop Strategy
A trailing stop can be used to lock in profits as price moves lower.
If price reaches TP1, move stop-loss to breakeven to secure capital.
If price reaches TP2, close the trade for maximum profit.
Exit Strategy
Exit early if price fails to break key support zones.
Monitor price action around TP1 & TP2 for signs of reversal.
6. Sentiment Analysis & Market Context
Bearish Confirmation:
Breakdown from the wedge signals bearish sentiment in the market.
If price fails to sustain above support zones, further downside is likely.
News & Fundamentals:
Major economic events or interest rate decisions could impact EUR/GBP volatility.
Traders should check for UK & Eurozone news before entering the trade.
7. Conclusion – Bearish Outlook
The Rising Wedge breakdown is a strong short-selling opportunity.
Confirmation is key: Enter short after the breakdown, use proper risk management, and aim for TP1 & TP2.
If price invalidates the pattern by breaking above 0.84853, the trade setup should be reconsidered.
This setup provides a high-probability bearish trade with a well-defined stop-loss and risk-to-reward ratio.

Gold (XAU/USD) – Rising Wedge Breakdown & Bearish SetupOverview
Gold (XAU/USD) has been in a strong uptrend, making consistent higher highs and higher lows. However, the price action has formed a Rising Wedge Pattern, which is typically a bearish reversal formation. This pattern suggests that the bullish momentum is weakening, and a potential sell-off could follow.
The recent breakdown of the wedge structure confirms the bearish bias, and sellers are now in control. Based on price action analysis, we can anticipate further downside movement toward key support levels.
📊 Technical Analysis – Rising Wedge Breakdown
1️⃣ Understanding the Rising Wedge Pattern
The Rising Wedge is a bearish pattern that occurs when the price consolidates within an upward-sloping channel but shows signs of exhaustion. Here’s how it developed:
Higher Highs & Higher Lows: The price consistently formed higher peaks and troughs, indicating an uptrend.
Declining Bullish Momentum: As the wedge progressed, price action became increasingly squeezed, showing reduced bullish strength.
Breakout Confirmation: Once the lower trendline of the wedge was breached, it confirmed that buyers were losing control and that sellers had stepped in.
2️⃣ Key Levels & Market Structure
🔵 Resistance Level: The upper boundary of the wedge around $3,150 - $3,163 acted as a supply zone, where sellers pushed prices lower.
🟠 Support Level: The lower boundary of the wedge, around $3,100 - $3,120, initially provided demand but eventually failed to hold.
🔻 Breakdown Confirmation: The price broke below the wedge, which is a strong bearish signal.
🎯 Trade Setup & Strategy
3️⃣ Bearish Trading Plan
Given the breakdown of the wedge pattern, the setup favors a short (sell) trade. Here’s how to approach it:
📉 Sell Entry:
The ideal short position is initiated after a confirmed break of the wedge’s support level.
📍 Stop Loss (SL):
A tight stop-loss is placed above the previous resistance at $3,163.67, ensuring risk is controlled if the trade goes against the bias.
🎯 Take Profit (TP) Targets:
TP 1: $3,080.66 – First major support level, where buyers might step in temporarily.
TP 2: $3,057.33 – Extended downside target, offering a greater risk-to-reward ratio.
4️⃣ Additional Price Expectations
Retest of the Wedge Breakdown: The price may pull back to the broken wedge support before continuing downward.
Stronger Bearish Momentum: If selling pressure remains strong, price could fall even lower, breaking TP 2.
Invalidation Level: If price climbs above $3,163, the wedge breakdown would be invalidated, signaling that bulls have regained control.
📌 Conclusion & Market Sentiment
🔹 Rising Wedge Breakdown Signals Further Downside – The market structure suggests that sellers are gaining control.
🔹 Sell Setup with Risk-Managed Approach – With a defined stop-loss and two profit targets, this trade offers a favorable risk-to-reward setup.
🔹 Gold’s Short-Term Bearish Outlook – The chart confirms a potential correction, and price may drop towards $3,080 and $3,057 if the bearish momentum continues.
📊 Final Thought:
This is a high-probability short trade based on classic technical analysis. Traders should monitor for confirmation retests and manage risk accordingly. ✅
Would you like any refinements or additional insights? 🚀

EURJPY Double Top - Bearish Reversal Ahead Toward Target!🔍 Chart Analysis: Identifying the Double Top Pattern
The EURJPY (Euro/Japanese Yen) 1-hour chart shows a classic Double Top pattern, which is a strong bearish reversal formation. This pattern occurs when the price reaches a significant resistance level twice but fails to break above it, indicating a potential shift from bullish momentum to bearish control.
1️⃣ Top 1: The first peak formed as buyers pushed the price higher, but strong resistance forced a pullback.
2️⃣ Top 2: The price attempted to break the same resistance level again but failed, forming a second peak at approximately 164.165, confirming that sellers are overpowering buyers.
3️⃣ Neckline (Support Level): The critical support level around 160.000 acted as a trigger for the bearish move. Once this level broke, the double top pattern was confirmed.
📌 Key Levels and Market Structure
🔹 Resistance (164.165): The highest level where sellers dominated, preventing further upward movement.
🔹 Support/Neckline (160.000): This level acted as a crucial pivot. Once broken, it signaled a trend reversal.
🔹 Take Profit Levels:
TP1 – 159.036: This serves as the first profit target, aligning with a prior demand zone.
TP2 – 157.200: The full projected downside move based on the double top pattern.
🔹 Stop Loss (SL): Above 164.165, ensuring a risk-managed approach in case of trend invalidation.
📉 Trading Strategy: How to Trade This Setup?
1️⃣ Entry Confirmation:
The ideal entry was after the price broke the neckline at 160.000 and retested it as resistance.
A breakdown candle with high volume confirmed seller dominance.
2️⃣ Stop-Loss Placement:
A stop-loss above 164.165 provides room for price fluctuations while protecting against false breakouts.
3️⃣ Profit Targets:
TP1: 159.036, securing partial profits.
TP2: 157.200, completing the double top measured move.
📊 Market Psychology & Price Action Insights
The double top pattern reflects a shift in market sentiment from bullish to bearish.
The repeated rejection at 164.165 signals a lack of buying strength, increasing the probability of a downward move.
The breakdown of the 160.000 neckline confirms that sellers have taken control.
The price action also shows a lower-high formation, reinforcing bearish momentum.
✅ Conclusion: Bearish Bias Until 157.200
This setup strongly favors short positions, as long as the price stays below 162.500.
A break above 164.165 invalidates the bearish setup, signaling a potential reversal.
Until then, the market remains bearish, with TP1 & TP2 as achievable downside targets.
💬 What’s your outlook on EURJPY? Drop your analysis below! 👇

AUDJPY SELLSOANDA:AUDJPY can definitely sell off to the 93.250 area. Daily double top, daily 61.8% retracement and H1 support broken. I'd look for price to make another LH before entering sells.

BTCUSD BEARISHBTCUSD is currently bearish and look like it will continue dropping. the 72,000 area does seem like a feasible target.

#AUCTIONUSDT shows continued buyer weakness📉 Short BYBIT:AUCTIONUSDT.P from $16.370
⚡️ Stop loss $16.735
🕒 1H Timeframe
⚡️ Overview:
➡️ The POC (Point of Control) is located at $17.734, indicating the highest volume area and now acting as a strong resistance.
➡️ Price BYBIT:AUCTIONUSDT.P continues to trade below the accumulation zone, confirming sellers' control.
➡️ After a local bounce, the chart shows a breakdown below $16.370 — this triggers a potential short setup.
➡️ Target zones are set near previous reaction levels, making them suitable for profit-taking.
🎯 TP Targets:
💎 TP 1: $16.165
💎 TP 2: $16.040
💎 TP 3: $15.850
📢 Watch for solid confirmation below $16.370 — this would strengthen the case for downside continuation.
📢 If price moves back above $16.735, the short setup is invalidated.
BYBIT:AUCTIONUSDT.P shows continued buyer weakness — downside movement is expected if pressure remains.

Bitcoin (BTC/USD) Trade Idea – Short Setup on 15-Min ChartMarket Context:
Bitcoin has been in a clear downtrend, forming lower highs and lower lows on the 15-minute timeframe.
The price recently rejected from the 0.786 Fibonacci retracement level at $84,510, indicating strong selling pressure at that zone.
A new low was formed at $83,532, confirming continued bearish momentum.
Trade Setup:
Type: Short (Sell)
Entry Zone: $84,000 - $83,800
This zone represents a potential pullback area where sellers might re-enter the market.
The Fibonacci retracement and previous price action confirm resistance in this region.
Stop Loss : $84,240
A stop loss above $84,240 is placed to invalidate the trade if Bitcoin gains bullish momentum beyond the recent swing high.
Profit Targets:
Target 1: $82,575
This aligns with the 1.0 Fibonacci extension level, a common take-profit zone.
Target 2: $81,775
The 1.414 Fibonacci extension, further confirming a continuation of the trend.
Target 3: $81,380
The 1.618 Fibonacci extension, marking a deep continuation move where price might find stronger support.
Risk-to-Reward (RR) Analysis:
The setup offers a high RR ratio, making it a favorable short trade.
The trade allows for tight risk management while targeting a significant move in price.
Confluence Factors Supporting the Short:
Bearish Trend: Price is making lower highs and lower lows.
Fibonacci Retracement Resistance: Rejection from key levels.
Liquidity Grab & Pullback: Price may retest resistance before continuing downward.
Risk-Reward Favorability: Targets align well with market structure.
This setup offers a solid momentum-based short opportunity with clearly defined risk levels and take-profit zones. Traders should monitor the entry zone reaction before confirming the short position. 🚀

Bitcoin Weekly Forecast | Rising Wedge Breakdown & Bearish MoveIntroduction
This Bitcoin (BTC/USD) 1-Day Chart Analysis highlights a critical market development: the breakdown of a Rising Wedge pattern, signaling a potential bearish trend. After reaching a new all-time high (ATH) resistance, BTC has shown weakness, confirming a possible reversal. This analysis covers key levels, trend structure, trading setups, and market psychology for traders looking to capitalize on this move.
1️⃣ Understanding the Chart Structure
Rising Wedge Pattern – A Classic Bearish Reversal
A Rising Wedge is a bearish technical formation that develops when prices rise within a narrowing range. It typically features:
✅ Higher Highs & Higher Lows: Suggesting bullish momentum, but the price action becomes weaker over time.
✅ Converging Trendlines: Showing a loss of buyer strength as each rally fails to make significant new highs.
✅ Volume Decline: As the wedge matures, volume decreases, confirming reduced buying interest.
✅ Breakdown Confirmation: A sharp drop below the lower trendline validates the bearish move.
In this case, BTC followed all the classic wedge characteristics, and its breakdown has initiated a potential major correction.
2️⃣ Key Levels & Market Dynamics
🔵 Resistance Level + All-Time High (ATH) (~$110K-$115K)
BTC reached its ATH resistance zone but failed to hold above it.
The red arrow indicates the rejection at the top, where strong selling pressure emerged.
Bulls attempted multiple breakouts but failed, leading to a reversal.
🟢 Support Zone (~$78K-$80K) – Weak Retest Before Breakdown
The price initially bounced off this support but struggled to hold gains.
The blue support level highlights a key zone where BTC found temporary stability.
A weak rally followed, but the price got rejected again, confirming the bearish trend.
🔻 Major Bearish Target (~$48,920)
Using the measured move theory, the projected drop extends to $48,920, a strong historical support.
The black arrow points to the expected downward trajectory.
3️⃣ Trading Setup & Risk Management
🔽 Bearish Trade Setup (Short Position Strategy)
For traders looking to short BTC based on this pattern, here’s an optimal trade setup:
🔸 Entry Point: Around $85K-$90K (post-retest of breakdown)
🔸 Stop Loss: Above $100K (invalidation of the bearish setup)
🔸 Take Profit Targets:
TP1: $75K (minor support)
TP2: $60K (psychological level)
TP3: $48,920 (final bearish target)
Alternative Scenario – Bullish Recovery?
If BTC reclaims $100K+ with high volume, the bearish thesis is invalidated, signaling a continuation of the uptrend.
A break above ATH ($115K) would confirm new bullish strength.
4️⃣ Market Sentiment & Psychological Factors
📉 Bearish Sentiment Strengthens:
Rising Wedges often cause a bull trap, where buyers expect new highs but get caught in a reversal.
Current price action suggests sellers are gaining control.
⚠️ Key Risks for Traders:
False breakdowns can occur if BTC sees unexpected bullish news.
Keeping an eye on fundamental developments (ETF approvals, macroeconomic conditions, etc.) is essential.
Conclusion – BTC Heading for a Deeper Correction?
Bitcoin’s Rising Wedge breakdown strongly suggests a continued bearish trend.
Short opportunities are ideal below $90K, with downside targets near GETTEX:48K -$50K.
If BTC regains $100K+, bearish outlook is invalid.
📊 Trading Recommendation: Monitor price action closely and adjust risk management accordingly!
Would you like me to tweak any part of this analysis? 😊

Possible Similarities to 2022 Bear Market QQQ Weekly Chart. Very similar structure and price action to the run up and subsequent bear market of 2022. Plan is to sell into strength and possibly look for longs off deep support levels. If this scenario unfolds it will require adaptability and will present difficult trading scenarios that will punish hesitation and chasing. Great opportunities for long term investors off deep support levels such as 200 SMA on higher timeframes. A pull back to 450 would be the first target and the 21 EMA on the Monthly chart and the 89 EMA on the Weekly. Look for possible put options 7-21 DTE.

#HIVEUSDT is maintaining a bearish structure📉 Short BYBIT:HIVEUSDT.P from $0.2424
🛡 Stop loss $0.2455
🕒 1H Timeframe
⚡️ Overview:
➡️ The POC (Point of Control) is at 0.2527, marking the area with the highest trading volume and now acting as major resistance.
➡️ The 0.2455 level serves as local resistance — price has already started to decline from that zone.
➡️ Price BYBIT:HIVEUSDT.P is steadily moving lower and staying below volume clusters, confirming the bearish structure.
➡️ A breakdown below $0.2424 could lead to acceleration toward target zones.
🎯 TP Targets:
💎 TP 1: $0.2399
💎 TP 2: $0.2379
💎 TP 3: $0.2366
📢 Watch for confirmation of the $0.2424 breakdown — it’s key for continuation.
📢 If price reclaims $0.2455, the short setup becomes invalid.
BYBIT:HIVEUSDT.P is maintaining a bearish structure — expect quick target reaction if the signal confirms.

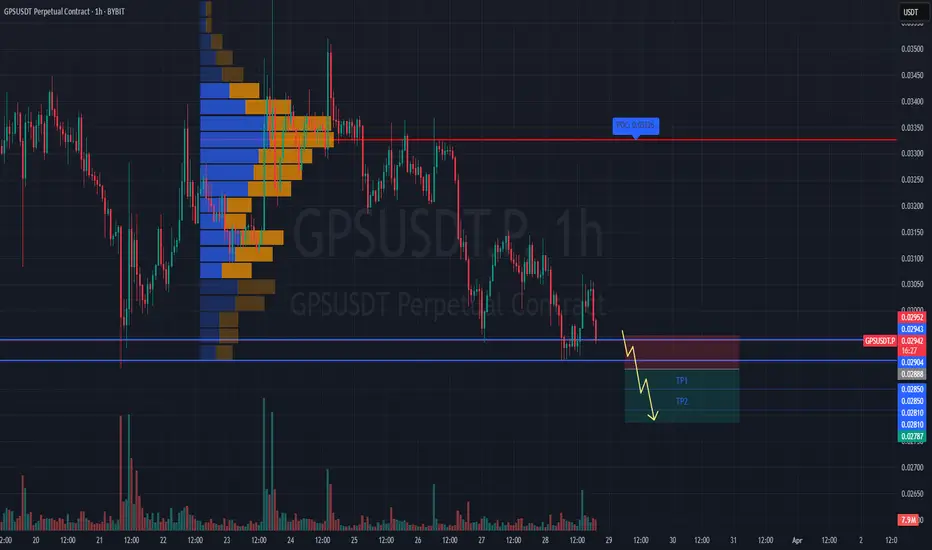
#GPSUSDT is forming a bearish structure📉 Short BYBIT:GPSUSDT.P from $0.02888
🛡 Stop loss $0.02952
🕒 1H Timeframe
⚡️ Overview:
➡️ The main POC (Point of Control) is at 0.03326, marking the highest volume zone and a major resistance above the current price.
➡️ The 0.02952 level acts as local resistance and an ideal stop placement.
➡️ Price BYBIT:GPSUSDT.P has already tested the $0.02888 support — a confirmed breakdown could trigger stronger downward momentum.
➡️ Volume is increasing on the decline, supporting the sellers' pressure.
🎯 TP Targets:
💎 TP 1: $0.02850
💎 TP 2: $0.02810
💎 TP 3: $0.02787
📢 Watch for a clean break of the $0.02888 level — it could be the entry trigger for this short setup.
📢 If price pulls back above $0.02952, the short scenario becomes invalid.
BYBIT:GPSUSDT.P is forming a bearish structure — continuation to the downside is expected if support fails.
BTC to 42k 2025 possibly lower
### 🔎 **1. Sentiment & Behavioral Data**:
- **App Rank + Google Trends Overlay**:
Elevated app rank + Google Trends spikes historically mark **local tops or overheating**, often preceding significant cool-downs.
- Current period mirrors previous euphoric cycles.
- RSI (monthly) also elevated → supports reversion.
---
### 🧊 **2. Macro Liquidity Conditions**:
- **BTC vs Global Liquidity Index**:
- Historically tightly correlated.
- Current divergence: **BTC is at ATH territory**, while **Global Liquidity Index is still suppressed**.
- Suggests **unsustainable move**, and vulnerability if liquidity tightens.
---
### 🏦 **3. ETF Flow Structure**:
- **Monthly Flows:**
- Net positive ($780M), **but cooling**.
- Feb had negative net flows (~ SEED_TVCODER77_ETHBTCDATA:4B out), March stabilizing but still tepid inflows.
- Sign of **diminishing marginal demand** from institutional flows → could fail to support current prices if retail demand slows.
---
### 🔥 **4. Liquidation Heatmap (Hyperliquid)**:
- **Heavy liquidation clusters**:
- Between **$86K - $90K** → currently being tested.
- **Liquidity vacuum below ~$80K** with significant liquidation levels → ideal for a **"liquidity hunt" wick** if downside opens up.
- Reinforces potential **swift downside mechanics** via cascading leverage.
---
### 📈 **5. Technical Structure & Smart Money Concepts**:
#### BTCUSD (Weekly View):
- Price hitting **regression model’s upper red band** (mean reversion zone).
- Momentum indicators (MACD, ST Oscillator, Squeeze) all **bearish divergent**.
- Fair Value Gaps (FVGs) below ($66K– GETTEX:52K ) + large Weekly OBs → **magnet zones**.
#### BTCUSDT.P (Perpetual Futures):
- RSI and volume profile show clear **bearish divergence**.
- Weekly CHoCH (Change of Character) + potential **lower high forming**.
- Price sitting in **high liquidity zone** with **weak support below**.
#### BRN/BTC Ratio:
- Shows **macro risk-off positioning** still in play (low oil/energy relative to BTC).
- Risk that this reverses → capital rotation *out of crypto* and into commodities.
---
### ⚠️ **Conclusion: Near-Term Bearish Bias**
Your thesis is still anchored in the **broader structural bull market**, but the current **micro-structure is highly vulnerable** to a **mid-cycle correction**, driven by:
- Overheated retail metrics.
- Bearish divergence across momentum tools.
- Depleting ETF inflows.
- Liquidity + liquidation setups ideal for **fast downside moves**.
- Macro conditions (liquidity and cross-asset risk ratios) not supportive of continued vertical price expansion **without correction**.

(XAU/USD) Sell Setup |Bearish Move Expected Towards Key SupportAnalysis:
The price has experienced a strong uptrend but is now showing signs of resistance near the 3,054.161 level.
A support level is identified around 3,000, which has been tested multiple times.
A potential sell setup is indicated after the price retested a resistance-turned-support zone around 3,027.737.
The target for the downside move is marked at 2,942.844, aligning with a previous support level.
If bearish momentum continues, a further decline toward 2,915.859 is possible.
Trading Idea:
Sell Entry: Around 3,027-3,030 after confirmation of rejection.
Stop Loss: Above 3,054 (recent resistance).
Take Profit Targets:
TP1: 2,942
TP2: 2,915
Market Sentiment:
The price is reacting to key levels, and if it breaks below 3,000, it could accelerate the bearish move.
A break above 3,054 would invalidate the short setup and could push the price higher.

“IDX Composite Index: Assessing the Depth of the Downtrend”The IDX Composite Index is expected to remain under pressure, forming wave of wave A. The nearest corrective target for the index is projected in the 5,879–5,975.
This outlook aligns with prevailing market sentiments, as Indonesia’s economic and political landscape has yet to support a trend reversal. Additionally, global sentiment remains negative, further weighing on the index.

Gold (XAU/USD) - Head & Shoulders Breakdown & Bearish MoveOverview of the Chart & Market Context
The 1-hour chart of Gold (XAU/USD) reveals a classic Head and Shoulders (H&S) pattern, a well-known bearish reversal formation. This pattern suggests that the recent uptrend has lost momentum, and a potential downside move could be in progress.
Currently, the price is testing the neckline, which serves as a key support level. If a decisive breakdown occurs, it could confirm further bearish momentum, leading to a sharp decline toward the projected target price of $2,995.
Key Technical Analysis & Levels
🔹 Resistance Level & Reversal Zone (~$3,055–$3,060)
The price attempted to break this resistance but faced strong rejection, forming the head of the pattern.
The area was tested multiple times, confirming that sellers are in control.
This level acts as a supply zone, preventing the price from moving higher.
🔹 Support Level (Neckline of H&S Pattern at ~$3,025–$3,030)
This level represents the critical neckline, which has been tested multiple times.
If price breaks and sustains below this support, the H&S pattern will be validated, signaling a deeper drop.
A successful retest of the neckline as resistance could provide an optimal shorting opportunity.
🔹 Projected Target Price (~$2,995)
The expected downside move is calculated using the measured move technique, measuring the distance from the head to the neckline.
This target aligns with previous structure support, increasing its significance.
Detailed Breakdown of the Head & Shoulders Pattern
📍 Left Shoulder Formation
The market experienced an initial bullish push, reaching a local high, but sellers entered and pushed prices down.
This formed the first lower high, hinting at potential weakness in the bullish trend.
📍 Head Formation
After retracing from the left shoulder, buyers made another attempt to push prices higher.
The price formed a new peak, but it was unable to sustain the breakout above the resistance level (~$3,055–$3,060).
A sharp sell-off followed, reinforcing that sellers are dominant at higher levels.
📍 Right Shoulder Formation
The price attempted another rally but failed to break the left shoulder’s high, creating the right shoulder.
This failure confirmed a gradual loss of bullish strength.
After forming the right shoulder, the price began to drop toward the neckline support.
📍 Breakout Confirmation & Bearish Price Action
The price has now broken the neckline (~$3,030), indicating an early-stage breakdown of the H&S pattern.
If the breakdown holds, further downside movement toward $2,995 is likely.
A retest of the neckline as new resistance would be an ideal entry point for short positions.
Trade Setup & Risk Management
📌 Potential Short Trade Setup:
Entry: After a confirmed break and retest of the $3,030 neckline.
Stop-Loss: Above the right shoulder (~$3,045–$3,050) to minimize risk.
Take-Profit: Around $2,995, aligning with the measured move.
📌 Risk Factors & Market Conditions:
If the price fails to hold below the neckline, it could indicate a false breakdown and a possible bullish reversal.
Macroeconomic data (such as interest rates, inflation, and geopolitical tensions) may impact gold prices.
Traders should watch for volume confirmation – increased selling pressure strengthens the validity of the breakdown.
Final Thoughts & Market Outlook
📉 The Head and Shoulders pattern signals that gold is losing bullish momentum, with a potential drop toward $2,995.
🔍 A break and retest of the neckline as resistance would confirm further downside movement.
⚠️ However, a failed breakdown could lead to a recovery, so traders should wait for confirmation before entering trades.
💬 What do you think about this setup? Are you going short on gold? Drop your thoughts in the comments below! ⬇️

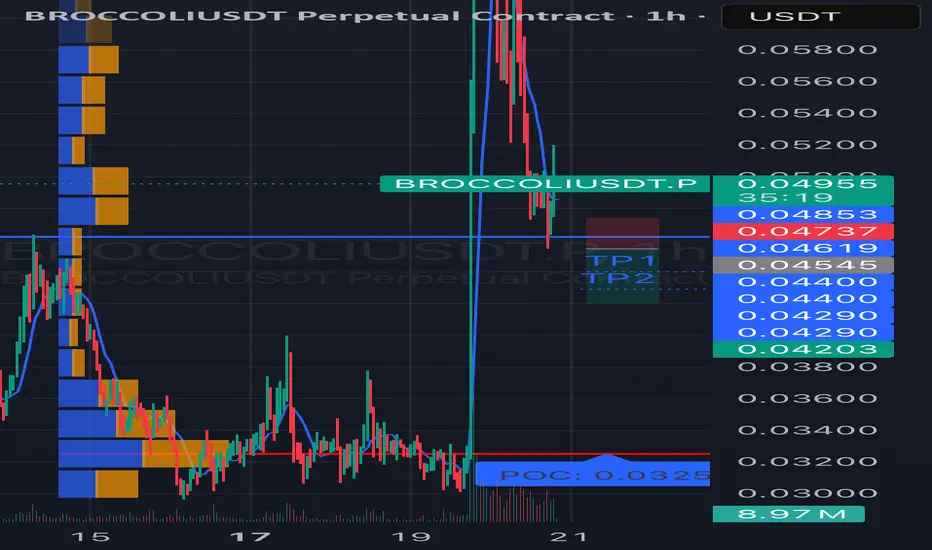
#BROCCOLIUSDT is showing bearish potential SHORT BYBIT:BROCCOLIUSDT.P from $0.04545
🛡 Stop Loss: $0.04737
🕒 Timeframe: 1H
⚡️ Overview:
➡️ BYBIT:BROCCOLIUSDT.P is showing bearish momentum on the 1-hour timeframe after a significant drop from $0.06000 to the current consolidation zone of $0.4203–$0.4885.
➡️ The price recently tested the $0.04545 level (a possible retest of a broken support, now acting as resistance), which could serve as an entry point for a short.
➡️ The volume profile on the left shows strong buyer interest at $0.0325 (POC), which acts as a key support level. However, the lack of significant buying volume at current levels suggests potential for further downside.
➡️ The price structure remains bearish: lower highs and lows are forming after the drop.
➡️ The RSI (14) indicator on the 1H timeframe is presumably around 45 (based on price action), indicating neutral momentum with room for a downward move.
🎯 Take Profit Targets:
💎 TP 1: $0.04400
💎 TP 2: $0.04290
💎 TP 3: $0.04203
⚡️Plan:
➡️ Entry: Sell below $0.04545 after the 1-hour candle closes below this level to confirm the rejection from resistance.
➡️ Stop Loss: Set at $0.04737, which provides a 7% risk from the entry point and protects against a potential breakout.
➡️ Risk/Reward Ratio: From 1:2 (for TP1) to 1:5 (for TP3), making this trade attractive from a risk management perspective.
➡️ After the drop, the price has stabilized, indicating possible consolidation or accumulation.
➡️ Resistance zone: $0.04885 (upper boundary of the current range).
Technical Indicators:
➡️ The chart shows candles in red and green, reflecting bearish and bullish movements.
➡️ After the sharp decline, the price has formed lower highs and lows, but in recent hours, there’s an attempt at recovery.
📢 A price rejection below $0.04545 with increasing selling volume increases the likelihood of reaching the targets.
📢 The $0.04400 and $0.04290 levels may act as areas for partial profit-taking, so monitor price action in these zones.
📢 Risks: If the price breaks above $0.04885, it could signal a false breakdown and a potential reversal to the upside. In this case, consider reassessing the position.
📊 The decline in BYBIT:BROCCOLIUSDT.P aligns with cautious sentiment in the crypto market.
📊 As of March 20, 2025, BYBIT:BTCUSDT.P is trading around $90,000, showing signs of consolidation, which may pressure altcoins like BYBIT:BROCCOLIUSDT.P
BYBIT:BROCCOLIUSDT.P is showing bearish potential on the 1H timeframe.
⚡️A confirmed rejection below $0.04545 is your signal to act!
USD/JPY - Breakdown Confirmation & Potential DeclineUSD/JPY - Breakdown Confirmation & Potential Decline
Chart Overview:
The USD/JPY price action has broken down from a previously established ascending channel.
A lower high formation suggests weakening bullish momentum, indicating a potential continuation of the downtrend.
The key support zones are marked below, with the price likely to move towards these levels if bearish momentum persists.
Technical Analysis:
Breakdown Zone: The price has breached the lower trendline of the ascending channel, confirming a bearish breakdown.
Resistance Levels: The price faces resistance around 0.0067786 - 0.0068488.
Support Targets: Possible downside targets at 0.0066848, 0.0066012, and 0.0065720.
Bearish Confirmation: A retest of the breakdown level followed by rejection strengthens the bearish outlook.
Trade Consideration:
Bearish Bias: A short position could be considered if the price fails to reclaim the broken trendline.
Stop Loss: Above the breakdown zone to avoid potential fakeouts.
Target Levels: Lower support zones for potential take-profit areas.
Conclusion:
The breakdown from the rising channel suggests a shift in market sentiment, with a bearish move likely. Traders should monitor price action for further confirmations.

Bearish Scenario If FOMC News Favors BearsFOMC interest rate news is due in less than 2hours .
I Stayed out of the market waiting since last Thursday just to wait for FOMC news because the market will almost always goes into consolidation days before this news due to its significant impact. So its usually a good idea to avoid getting chopped in the sideways action unless you like donating money to the market instead of waiting for a new trend to emerge or a continuation of the on-going trend.
After todays fomc news, we will know if we will resume dumping everything, or we'll evaluate potential short term bullish scenarios. For now, my recent BTC short analysis is still intact. I already took profit on all 8 short positions i was in on various coins i shorted along side BTC. If the FOMC news favors the bears, i'll be looking to re-enter shorts in the range 86.4k to 91k.

#AVLUSDT continues its downtrend 📉 Short BYBIT:AVLUSDT.P from $0,4060
🛡 Stop loss $0,4136
🕒 1H Timeframe
⚡️ Overview:
➡️ The main POC (Point of Control) is 0,4201
🎯 TP Targets:
💎 TP 1: $0,4015
💎 TP 2: $0,3975
💎 TP 3: $0,3945
📢 Monitor key levels before entering the trade!
BYBIT:AVLUSDT.P continues its downtrend — watching for further movement!

GBP/USD - 4H Chart Analysis & Trade Setup
Market Overview:
GBP/USD has been in an uptrend, forming a rising channel structure.
The price is now testing a resistance zone, potentially indicating a reversal.
Technical Analysis:
Trend: Bullish (but approaching key resistance)
Resistance Level: 1.29720 - 1.30000 (Highlighted Zone)
Support Level: 1.24906 (Potential target)
Stop Loss: 1.30970 (Above resistance)
Pattern: Rising Channel Breakout Setup
Trade Idea (Short Setup):
🔴 Sell Entry: Near 1.29720 (Resistance rejection confirmation)
✅ Target: 1.24906 (Major support zone)
⛔ Stop Loss: 1.30970 (Above resistance to avoid fakeouts)
Conclusion:
GBP/USD is testing key resistance and may face bearish rejection.
A break below the channel confirms bearish momentum towards 1.24906.
Traders may consider short positions with a defined risk-reward setup.
📉 Bearish bias unless price breaks above resistance.
