XRP, what are you doing?
There is a good chance price starts to move sideways. A weekly SIBI has formed at 2.59-2.89 and might be the resistance to keep price sideways.
If price does not, I foresee a possible bear retracement occurring.
Multiple FVGs are below current price (2.34). A 4HR SIBI rests at around 2.45-2.46. If price does go up, that SIBI might be the resistance to hold prices from elevating upwards.
Based on what the charts are showing me, we might be headed to another sell-off.
Reason for this assumption is due to the 1-day liquidity zone that sits at $1.77. Also keeping in mind that the bottom 1/3 of the weekly FVG has still been untouched.
If I was analyzing this chart without experiencing yesterday's (2/2/25) sell-off, I would say that we wouldn't get that low into the FVGs. But yesterday was crazy, and I did not think we could get into those gaps. So I am giving more respect to those gaps with this analysis.
Bearishtrend

AAVEUSDT Breakdown Imminent ? Bearish Setup AAVE/USDT perpetual contract on the 2-hour timeframe presents a descending channel formation in the. The price has been respecting the upper and lower trendlines, showing multiple rejections at both levels. Currently, the price is testing the lower boundary of the channel, and a breakdown could trigger further downside momentum.
The short setup suggests a bearish continuation if the price breaks below the lower trendline. The entry point is positioned around the 264.57 level, with a stop-loss placed above the recent swing high to manage risk. The take-profit zone is projected toward 221.84, aligning with the next significant support level.
Key factors to consider
The price is forming lower highs and lower lows, confirming the downtrend structure.
The red zone represents the stop-loss area, ensuring risk management in case of reversal.
The blue zone marks the potential profit-taking region, which aligns with a strong demand zone.
If a breakdown occurs with strong bearish volume, it could accelerate the move toward the target zone.
A potential retest of the broken support level could offer additional confirmation before further downside.
Traders should monitor volume and market sentiment before entering the trade, ensuring that bearish momentum supports the continuation of the trend.

Large Bearish idea for current Bitcoin cycle.On the Daily chart very noticeable Double Top ~$107k. Certainly, short term move towards 93k. Afterwards probably the decision to make that will change the outlook of the next 1-2 years.
$85-86k could mean as first support. Then with the break of it, reaching low 70s and high $60s (~530 day downtrend will be near complete). If it were to continue tumble close to $55k (which I don't think it will), I am personally not going to hasitate for a long time to grab as much as I possibly can.
I'm convinced we'll be more than alright after this big Bear Trend.

BTC's exhausting rangingBINANCE:BTCUSDT
Bitcoin's ranging made me tired!
look at this chart! It's gonna go below 100k once again and only support it has, is around 102k.
if the support is lost, we can see it reach around 96k once again.
⚠️ Disclaimer:
This is not financial advice. Always manage your risks and trade responsibly.
👉 Follow me for daily updates,
💬 Comment and like to share your thoughts,
📌 And check the link in my bio for even more resources!
Let’s navigate the markets together—join the journey today! 💹✨

BANKNIFTY FUT SEEMS NEGATIVEHello All,
I am Back with one of Important Idea that too just before of Budget.
Idea is on BankNifty Fut.
As past few days market has given some relief and price moved up by approx. 4%.
But........
As per my opinion, BankNifty has not turned Positive yet.
BankNifty Fut: Daily Timeframe
CMP: 49,862.00
Support: 48,600.00 - 48,100.00
Resistance: 49,900.00 - 50,200.00
Important Factor: Bullish Divergence between : 13th to 27th Jan, 2025.
- Because of that Bullish Divergence BankNifty gained almost 1,900.00 points from bottom.
Here is the catch, after gaining 1,900.00 points even RSI is still below 50 Mark line.
Assumption: I feel Price has absorbed effect of Bullish Divergence and ready to free fall.
Target 1: 48,600.00 - 48,100.00 (at 1st support zone)
Target 2: 46,500.00 - 46,200.00 (at 2nd support zone)
Disclaimer: This script is solely my attempt to predict BankNifty based on my analysis. It is not intended as financial advice, and I am not asking anyone to trade based on this information. Trading involves substantial risk and is not suitable for every investor. Always conduct your own research and consult with a financial advisor before making any trading decisions.

Bearish trends in the days ahead. Hello,
To all my folks who are trading forex. Right now everything has been going crazy with all the news across the world.
One thing can be sure is the USD is reigning supreme. With a guy sitting at the big White House in DC. Be rest assured he wants to be first at everything. He wants US first in everything. It’s only a matter of time before things start to reflect certain aspects of that. Especially the USD.
So let’s take a look at what the EUR has been doing for a while! What it has been doing for a long time is falling.
Things will continue to be that way. If we extend the times on the chart to 4hrs, day, week and even month. You can see that things are looking to trace back to low’s that haven’t been hit in years.
Of course, things will always have to retrace, you will have your support and resistance levels. That’s a gimme. It’s what we do at those levels is what will define these future trades.
At this time. It’s time to throw the towel in and admit. We are in a EUR/USD downtrend for a long time to come.
As always, research your entries, confirm your strengths and look for opportunities to trade smarter. If you enjoy this publish idea, please follow and boost this up.
- Thank you

BTCUSDT Short Swing trade.Hello everyone, i want to share my price prediction at Bitcoin.
The week started with strong sell which activated buyers but i think buyers is not more strong, price tested well 2h FVG and Fibonacci Strong sell zone after New York session open.
Price is into consolidation, and if we look higher timeframe Bitcoin losing buyers with my strategy here is my short position setup.
Open Short position at - 102500
Stop Loss at - 104500
Take profit - i will follow trend if i will be right.
Always manage your risk!!! don't risk more than 2.6% of your balance in this trade.

Short on BTCHi everyone
I want to open a short position on BTCusdt
After a heavy bearish pattern , btc has had a price correction in its downtrend.
what do you think about ma analysis ?

CADJPY Downtrend Analysis: Bearish Momentum ContinuesThe CADJPY remains in a strong downtrend after completing its first wave structure to the downside. The corrective wave offered no signs of a trend reversal, confirming the sellers’ dominance.
Yesterday, during the Tokyo session, a new bearish wave structure began, breaking below the first wave's momentum low. Wave 2 formed as a correction to Wave 1, creating an opportunity to look for short trades below 108.614. A break below 107.65 (momentum low) is expected, with a Fibonacci target of 61.8% as a likely end for the current wave.
Key levels to watch:
Entry: Below 108.614
Target: 107.65 and Fibonacci 61.8% level
Stop Loss: Above 109.05
Selling above 109.05 is not recommended.
Like, comment, and share your thoughts. Happy trading!

GBP USD Entry Setup 1 hour timeframe Entry confirmation Doji and Close below
Sell GBP USD
SL: 1.23858
TP: 1.22633
Risk: 30 pips
Target 90 pips
RR: 1:3 🔥⏰

CAD/JPY Rising Channel Breakdown Looms Bears in Play !Rising Channel Formation
The price is trading within a rising channel, indicating a potential bullish continuation or a reversal depending on how the price reacts near the channel's boundaries.
The upper boundary of the channel acted as resistance, where a rejection occurred, leading to a short setup.
Golden Pocket Zone
Around the 108.660–108.491 level, a "Golden Pocket Zone" is marked, indicating an area of potential caution due to increased market indecision.
This zone aligns with Fibonacci retracement levels or historical pivot points.
Support Levels
A Good Trading Zone is identified between 107.248–106.780, which represents a potential support area for price reversal or consolidation.
Wicks Pivotal Point near 105.851–105.817 serves as a critical demand zone where significant buying interest might reemerge.
Short Position Setup
Entry Signal: A Sell signal was triggered near the channel's resistance line, supported by a failure to break higher. The price also exhibited a rejection at a critical resistance level within the Golden Pocket Zone.
Profit Levels
The Peak Profit 0.22% label indicates a modest gain so far, suggesting a potential continuation if the price breaks below the channel support.
A prior Peak Profit 2.96% was achieved on a similar short setup from a lower level, confirming the bearish potential within the structure.
Target Levels
First target: 107.248, aligning with the Good Trading Zone.
Second target: 106.780, which is the bottom of the Trading Zone.
Extended target: 105.851, Wicks Pivotal Point, for a more aggressive short.
Stop-Loss Placement
A stop-loss should be positioned above the Golden Pocket Zone (around 109.000) to protect against false breakouts or unexpected bullish momentum.
Technical Patterns and Indicators
Rejection Candlesticks
The price formed bearish rejection candles near the channel's upper boundary and the Golden Pocket Zone, indicating strong selling pressure.
Trendline Confluence
The lower boundary of the channel intersects with the 107.248 level, adding confluence for a possible bounce or further breakdown.
Momentum Analysis
The price appears to lose upward momentum after several failed attempts to make a higher high, suggesting sellers are gaining control.
This short position aligns with the current market structure, leveraging resistance levels, a rejection from the upper trendline, and bearish momentum. However, traders should exercise caution near the identified support zones and adjust stop-loss levels based on intraday volatility. A clear break below the Good Trading Zone could open the door to extended downside potential toward the Wicks Pivotal Point.

EURCAD ChartThere is Bearish trend, no any divergence on RSI. Price is Sync with RSI. On LH there is Inverted Hammer along with bearish Engulfing Candle. Instant sell on CMP and SL should on previous LH.

FINNIFTY FUT SEEMS NEGATIVEHERE, I am sharing my idea on Fin Nifty Fut at closing of 15th January, 2025.
Important points are as below:
1) STRONG DEMAND ZONE is at 22,000 TO 21,750.
2) NEXT DEMAND ZONE is at 21,400 to 21,275.
3) STRONG SUPPLY ZONE is at 23,100 to 23,550.
4) Clear bounce back from 22,500 level.
5) Long term view is BEARISH
RSI WITH SMA: RSI is still below it’s moving average but has crossed oversold level from below to above on 14th Jan. trading session.
- We can expect further upside trend till our supply zone that is: 23,100 – 23,550.
- As mentioned earlier, long term view is BEARISH, if Fin Nifty fails to breach this supply zone and start’s falling, it will be good opportunity to sell.
- 1st target: 22,000 – 21,750
- 2nd target: 21,400 – 21,275
This is simply my attempt to predict Fin Nifty, I am not asking anyone to trade based on this idea.

Be Careful Now!Crypto Trading Fam,
It's time for me to put out a note of caution. I have been bullish but a few days ago while doing my video, I spotted this pattern mid-session, hoping I would be wrong. Looks like I was not. The H&S pattern has now formed. This means we have an 85% probability that we'll drop to our next support of 75k. Yikes!
Now, 15% of the time a H&S pattern can fail. We can only hope this will be the case. But while hoping, prepare your SLs. Could get ugly for those alts!
✌️ Stew

ULTRATECH FUT BEARISH VIEW at closing price on 6th Jan 2025Here I am sharing my views on Ultratech Cement Futures Chart.
A) There is a STRONG SUPPLY ZONE at 11,800 - 11,900.
B) There is Mild to Moderate Demand Zone at 11,400 -11,300.
C) RSI with SMA: In today's trading session RSI crossed it's 50 mark level and turned bearish
- RSI is now below it's SMA (Bearish)
D) If we observe today's candle properly, we can sell initial rise towards supply zone and price corrected sharply from mentioned supply zone, thick body and short wicks adds weakness in Ultratech Cement Chart.
E) prices may hold at 11,400 - 11,300 levels, once this level is broken we can see sharp decline towards next Demand Zone, which is also our Target.
F) Target 1: 11,400 -11,300
Target 2: 10,800 - 10,650
This is only my attempt to predict Ultratech Cement, I do not recommend trading or investing based on above study.

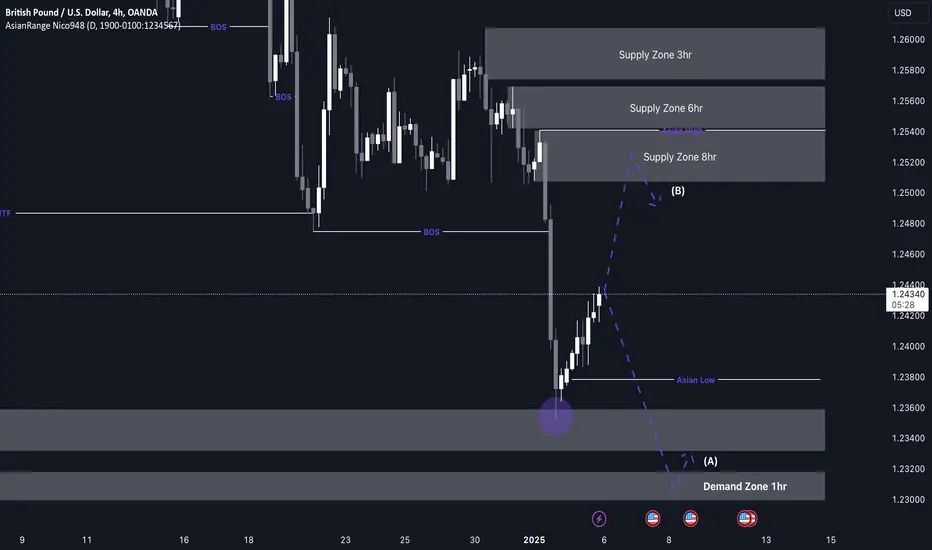
GBP/USD Shorts from 1.25200This week, my analysis for GBP/USD (GU) suggests a potential move higher to complete a corrective phase, as the pair has experienced heavy bearish momentum recently. Once the price reaches my point of interest (POI), which lies within the confluence of three key supply zones, I’ll be looking for signs of a slowdown in that region.
I’ll wait for the price to form a redistribution pattern in this area, signaling an opportunity to align with the overall bearish trend. Since GU is already in a bearish trend, it’s ideal to capitalize on this movement and target the underlying liquidity below.
Confluences for GU Sells:
The price has shown a Change of Character (CHOCH) and multiple Breaks of Structure (BOS) to the downside.
Several unmitigated supply zones remain, which are likely to be tapped.
Significant liquidity below, along with imbalances that need to be filled.
The Dollar Index (DXY) is bullish, supporting the bearish case for GU through correlation.
Note: If the price drops first before retracing upward, I’ll look for a buying opportunity around the 1-hour demand zone at 1.23000.
EURUSD SHORTS Am monitoring Eurusd for a Selling opportunity around 1.03410 level, once i receive any bearish confidence the trade will be executed
Disclaimer Alert: these are just charts to watch, keep in consideration the news, the best entry, the risk management and price action confirmation. Trade is reactive not predictive.

The Two Archetypes of TradersIn the trading world, markets move in cycles, and bearish conditions are no exception. Here's an educational breakdown of how traders can navigate these challenging times:
1. The Long-Term Holders (Investors)
Mindset: Patience is their superpower.
Goal: Accumulate assets during bearish trends by buying at key support levels and holding for future gains.
Approach: Use the WiseOwl Indicator to identify areas of strong support and potential accumulation zones for strategic entries.
2. The Intraday Traders (Short-Term)
Mindset: Adaptability and precision are crucial.
Goal: Profit from short-term price movements, capitalizing on market volatility.
Approach: Utilize the WiseOwl Indicator to pinpoint bearish momentum for short entries and clear exit levels, ensuring optimal risk management.
Educational Example: WiseOwl Strategy in Action
Let’s analyze Solana (SOL) on the 15-minute timeframe during a bearish market:
Trend Identification: The WiseOwl Indicator highlights a confirmed downtrend with clear bearish signals.
Entry Points: Short trade signals are generated at moments of significant bearish momentum.
Risk Management: Stop loss and take profit levels, calculated using ATR-based logic, ensure disciplined trading.
Takeaways for Traders
📉 Bearish Markets:
Holders focus on identifying value areas for accumulation.
Intraday traders capitalize on market volatility with precise entries and exits.
Happy trading! 🚀
#WiseOwlIndicator #TradingEducation #BearMarket #SOLAnalysis #CryptoTrading

theta sell midterm"🌟 Welcome to Golden Candle! 🌟
We're a team of 📈 passionate traders 📉 who love sharing our 🔍 technical analysis insights 🔎 with the TradingView community. 🌎
Our goal is to provide 💡 valuable perspectives 💡 on market trends and patterns, but 🚫 please note that our analyses are not intended as buy or sell recommendations. 🚫
Instead, they reflect our own 💭 personal attitudes and thoughts. 💭
Follow along and 📚 learn 📚 from our analyses! 📊💡"

"ALTCOINS: HOLD OR SELL? BTC Dom at a Critical Turning Point!🚀 Hey Traders! 👋
If this analysis resonates with you, smash that 👍 and hit Follow for premium setups that actually deliver results! 💹🔥
🔥 Market Recap
Last night, we witnessed a massive liquidation cascade across the entire crypto market. Altcoins took a heavy hit, with many dropping 20-30% overnight, wiping out billions of dollars.
🔑 Key Takeaway:
This is why I always stress—never trade leverage without a stop-loss. Protect your capital first. Hope you all followed this golden rule!
📊 Market Outlook: Where Are We Heading?
BTC Dominance:
Breaking down from a rising wedge on the weekly time frame—a classic bearish signal.
Currently retesting the breakdown zone, indicating a potential sharp decline ahead.
🌟 What This Means:
If dominance drops further, spot altcoin holdings will likely surge.
This is the time to accumulate, not panic-sell.
💎 Opportunities Ahead
Many altcoins are retesting key support levels after breaking out on the daily time frame:
FET, W, PEPE, LTC, APT, RENDER, and more.
Patience is key here. Hold onto your spot bags and use this dip as an opportunity to accumulate strong projects.
🚀 The Road Ahead
Over the next few days, we anticipate a strong recovery across the market, with alts pumping hard. Stay calm, stick to your strategy, and ride this wave.
💬 Your Move:
What’s your strategy for this phase? Are you accumulating or waiting for more clarity? Drop your thoughts in the comments below—we’re in this together! 🌊🔥
👉 Follow us for more timely updates and winning trade setups. Let’s crush it! 💪

NQ making ATH and looking more and more Bearish by the dayJust some simple easy stuff anyone can do. Chart is pretty self explanatory, let me know if you have any questions.

NVDA out of gas?H&S on the daily with 132.67 as the neckline. We also have another H&S that has played out and was followed by a double top, now failing once again under support. I'm in puts now with a stop-loss at 133. This is also where i would flip bias for potential squeeze at 133 after a backtest of 132.67

Polycab India Ltd. - Short Position SetupAnalysis for Short Position Condition:
1.Key Breakdown Level:
₹7,282 is a critical horizontal support level. A decisive breakdown below this level could trigger a bearish move.
2.Volume Profile Analysis:
Below ₹7,282, the volume profile shows limited buying interest until ₹6,997, suggesting a potential drop to this level.
Further weakness could see the stock test ₹6,746, where significant buying activity has previously occurred.
3.Trendline Breakdown:
The stock is trading within an ascending channel. A breakdown below ₹7,282 will confirm the failure of this channel, indicating a trend reversal.
4.Moving Averages:
The 20-day EMA is currently acting as dynamic support near ₹7,282. A breakdown will likely push the stock toward the 50-day EMA around ₹6,997.
The 200-day EMA near ₹6,746 is a long-term support level to monitor.
5.RSI (Relative Strength Index):
RSI is neutral but could head toward oversold levels if the breakdown occurs, strengthening the bearish view.
6.Volume Confirmation:
Watch for an increase in sell-side volume during the breakdown for confirmation.
Trade Plan for Short Positions:
Entry Trigger: Below ₹7,282.
Targets:
Target 1: ₹6,997
Target 2: ₹6,746
Stop Loss: Above ₹7,438 (previous high near resistance).
Risk-Reward Ratio: Ensure an ideal ratio of at least 1:2 for the trade.
Alternate Scenario:
If ₹7,282 holds and the stock bounces, the immediate upside resistance is ₹7,654, above which the stock may resume its bullish trend.
