NZDCAD ForecastD1 - The price which is moving higher has reached a key resistance zone formed by the 100% fibonacci expansion level of the first wave at 0.89197 and 0.89 psychological level, bearish divergence.
H4 - Bearish divergence.
H1 - Bearish divergence followed by a bearish trend pattern in the form of three lower highs, lower lows.
Expecting further continuation lower after pullbacks.
Bearishtrendpattern

EURGBP ForecastD1 - The price tested and false broke the 0.91 psychological zone. Bearish divergence.
We also have the 61.8% (0.90920) fibonacci expansion level of the first wave coinciding in the same zone, which makes this area a key resistance zone for us. The price is currently holding below this key resistance zone.
H1 - Bearish trend pattern.
Expecting further continuation lower after pullbacks.

Bitcoin ForecastD1 - Bearish divergence.
H4 - Bearish trend pattern followed by double wave correction. Price has broken below the most recent uptrend line.
H1 - Bearish trend pattern, expecting further continuation lower.

EURJPY Short Term ForecastH4 - Bullish trend pattern. Expecting the correction to continue lower further.
Price still has room lower towards the two key support zones.
The first support zone is formed by the 61.8% (119.581) fibonacci expansion level of the first wave and the 50% (119.370) fibonacci retracement level of the bullish trend pattern.
The second support zone is formed by the 100% (117.993) fibonacci expansion level of the first wave and the 61.8% (118.172) fibonacci retracement level of the bullish trend pattern.
H1 - Bearish trend pattern followed by double wave correction. Expecting further continuation lower towards the key support zones.

Oil ForecastD1 - Dark cloud candle pattern, bearish divergence.
H4 - Price has broken below the big and small uptrend line, bearish divergence.
H1 - Bearish trend pattern, expecting further continuation lower after retraces.
Invalidation - This bearish view is valid until the price holds below the 61.8% (39.17) fibonacci retracement zone. If the price moves higher, breaks and holds above this level in one straight leg then this bearish view will be invalidated.

USDCHF Short Term ForecastH4 - Price is moving inside a range and is respecting it so far.
Price is maintaining the lower highs and is currently breaking below the low at 0.96642 level.
H1 - We had the first leg in the form of a bearish trend pattern followed by double wave correction and the breakout of the most recent uptrend line.
We may now expect further continuation lower towards the bottom of the H4 range.

GBPUSD Short Term ForecastH4 - Bullish trend pattern, correction is happening currently. Price still has room lower towards the important support zone.
H1 - Bearish trend pattern, correction is happening currently.
Until the invalidation level at 1.24906 holds, I expect further continuation to the downside.

SP500 ForecastD1 - Price respected an important resistance zone and is holding below it, bearish hidden divergence.
H4 - Price has broken below the most recent uptrend line, bearish divergence.
H1 - Bearish trend pattern, until the two key resistance zones shown in the chart holds my view remains bearish here.
If the price moves higher in one straight leg, breaks and holds above the 61.8% (2826.3) fibonacci retracement level then this bearish view will be invalidated.

Gold Short Term ForecastH4 - Price respected the important resistance zone and is currently moving lower, bearish divergence, uptrend line breakout.
H1 - Price has broken below the bottom of the range, currently it is moving inside a bearish channel, bearish trend pattern.
I expect bearish continuation in the short term.

Dax ForecastD1 - Bearish hidden divergence
H4 - Bearish divergence, if the price moves lower and breaks below the uptrend line then it would be a good bearish sign for us.
H1 - Bearish trend pattern, if the price moves lower and breaks below the low at 10164 we may then expect pullbacks and further continuation lower.

Oil ForecastD1 - No bullish divergence that hints that the bearish trend is over. We may expect one more push lower until a bullish divergence is created.
H4 - Bearish trend pattern, currently it looks like a correction is happening in the form of some sort of a range.
H1 - If the price moves lower, breaks and holds below the uptrend line we may then expect further continuation lower.
Note: Due to the Corona virus impact there is less transportation around the world so I expect the Oil prices to drop lower further.

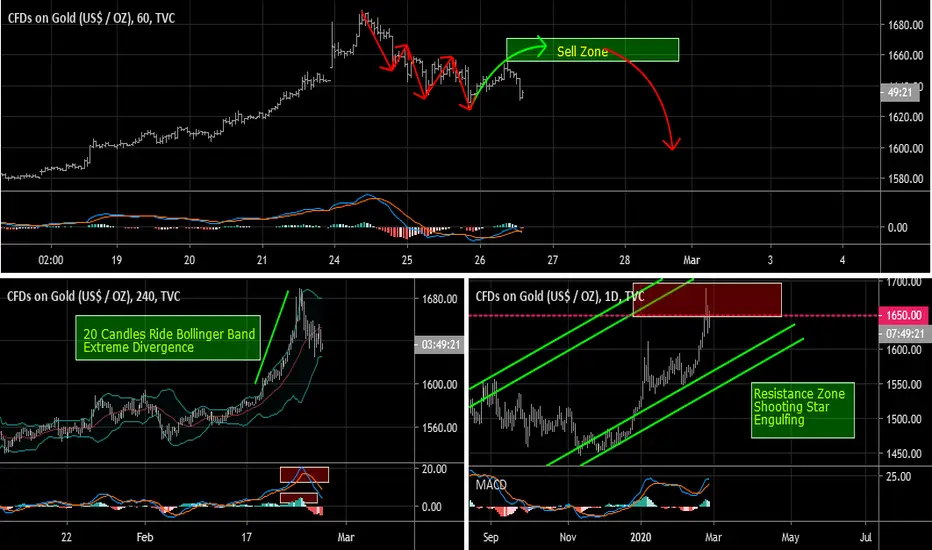
Gold Short Term ForecastD1 - Price is holding below an important resistance zone formed by the top of the bullish channel and the psychological level 1650.
H4 - 20 candles ride in Bollinger Bands, Extreme divergence
H1 - Bearish Trend Pattern, until the sell zone shown in the chart holds my view remains bearish here.
Ethereum Short Term ForecastH4 - Uptrend line breakout, lower lows.
H1 - Bearish trend pattern, bearish hidden divergence, we have two important sell zones.
Until these two sell zones hold my short term view remains bearish here.

NZDCHF ForecastW1 - Price still has room lower towards the bottom of the bearish channel.
D1 - Potential bearish hidden divergence.
H4 - Bearish trend pattern, currently it looks like a correction is happening.
We have two important resistance zones that has formed based on the fibonacci retracement levels of the bearish trend pattern and the fibonacci expansion levels of the first wave we have.
Until these two resistance zones hold my view remains bearish here.

Dax ForecastD1 - Bullish trend pattern, bearish convergence, currently it looks like a correction is happening, price still has room lower towards 38.2% - 50% fibonacci retracement zone.
H4 - Bearish trend pattern, currently it looks like a pullback is happening, until the 61.8% fibonacci retracement level holds my view remains bearish here.
Invalidation - If the price breaks and holds above the 61.8% fibonacci retracement level in one straight leg then this bearish view will be invalidated.

AUDUSD Sell IdeaD1 - Price broke below the bottom of the channel.
H4 - Bearish trend pattern, price has created lower lows between the last two lows based on the MACD indicator.
We may now look for pullback towards the sell zone marked in the chart and then we may look for bearish setups with bearish evidences around this sell zone in order to join the bears.

NZDCHF Sell IdeaW1 - Price is holding below the downtrend line, bearish hidden divergence.
D1 - Bearish convergence, price broke below the most recent uptrend line.
H4 - Bearish trend pattern, looks like the pullback that we were looking for happened, bearish hidden divergence.
We may now start looking for more bearish setups with more bearish evidences in order to join the bears.
