bitcoin, it is until its notbearish market structure remains
sfp of the previous lower high
until this changes we remain in bearish territory
no one wants capo to be right but until this is broken he could very well be right "biggest bull trap ever" - would give him legendary status if we descend to lows now
Imagine 15k May, 12k August not sure where 100mma would be by then as its slowly creeping up, maybe 150ema could prove an ultimate bear target (over to you to look at time frames) ;-)
Bearmarket

VIX: VOLATILITY CYCLES / POINT OF CONTROL / RAISING THE CEILING DESCRIPTION: In the chart above I have provided a SEMI-MACRO analysis of VIX a volatility index on the 4 hour timeframe. This is a brief update on VIX as we have had some interesting momentum taking place.
POINTS:
1. Deviation of 7 points continues to stand and justifies Supply & Demand Pocket Placement.
2. RSI is currently OVEREXTENDED but PRICE ACTION continues to exhibit compressed behavior by only GRAVITATING around 20 POINTS.
3. MACD signals that past cycles have at least seen 2.00 POINTS on MACD'S deviation from Median but has only seen 0.50 since the beginning of this VOLATILITY CYCLE.
IMPORTANT: With a new ceiling confirmed by price actions recent upward momentum it is safe to say that if price action surpasses 23 we will come to see elevated VOLATILITY for SPY, SPX, ES1! or NQ1!. I would consider a BULLISH & BEARISH scenario when it comes to VIX but no recession has ever come to an end without VIX first touching 40 POINTS but here it is.
SCENARIO #1: In a BULLISH scenario for VIX we see an eventual RETEST of 19 followed by further consolidation and a BREAK of 23 POINTS by MARCH 8th.
SCENARIO #2: In a BEARISH scenario for VIX we come to see a break of 19 POINTS to the downside followed by an inevitable RETEST of the 8 YEAR TREND LINE & would elongate capitulation due date.
FULL CHART LINK: www.tradingview.com
TVC:VIX
CBOE:VIX


Correction I see for bitcoin This is how I see bitcoin right now and don’t say we are bottomed, we aren’t bottomed yet and yet the winter is already over but the bear market is not over yet.
As you can see CPI Data is almost 7% and the inflation is still over 6%.
Even so we should expect the long drop follow along with a downtrend, down to 14 or 15K then finish up the correction to mid-Recovery up to 31 or 32K; then the bear market should finish up during the bitcoin halving in 2024 and expect the Feds pivot and cut rates; so the liquidity won’t have an issue.
10K is still the bear market target for bitcoin bottom somehow most of us said could go a lot lower than 10K we will see.
We won’t see a bullrun starts around 2024
Bitcoin right now is still Volatile; the buys will be short and the sells as well please be very careful and don’t get too greedy.
What bottom you see for bitcoin ?

BTC Outlook 2023 - 2027BTC Outlook 2023-2027 (Revised)
I think its almost confirmed with high confidence that this rally is bear market rally, not a rally of a new cycle that ends the BTC bear market. 25k is already its highest peak, it will going sideway for a while before resuming the drawdown to a lower level. Q1 2023 is one month left before it ends. This rally is the corrective move of wave 4 of the 4th cycle ABC move. After we have the truncated bull market of 2021, now we also have a truncated bear market. Its a textbook Elliot Wave cycle but its just not the ideal one. But it is the ideal one to model the current cycle.
We can see that the peak of the current rally has touch multiple important moving averages. That's it, the unbreakable wall of the rally. Next move we will see again another massive drawdown, the wave 5, the last wave of the ABC move. My prediction is that BTC will be asking for a major support between 12-14k liquidity area, touching 1M 100 SMA and 50% of Fibonacci retracement level, and surely a weekly bullish divergence will be formed, and that would be the best time to buy before a new cycle started. Approximately the bottom will be formed around Q2-Q3 of 2023, but I think Q3 is preferable considering the macroeconomic condition.
The identification of almost-confirmed-with-high-confidence wave 4 of ABC move also stating that the current cycle has been going a time period of more than 4 years tradition and still counting due to a longer bear market. The first time that BTC breaking this tradition after going 3 Elliot Wave cycles and 3 halvings.
For the next cycle, we will have the first wave peaking between 32-37k, the 3rd wave peaking at around 2021 ATH and for the 5th wave, the blow off top will be around 130-170k.
Let see if this post will age really well in the coming years.

Short GoldXAU/USD
- Being on a bearish trend, in the H4.
- H1 analysis and execution, I will be shorting if the price breaks my support zone. Which is been holding the price for the past days.

UniSwap's waterfallFibonacci's ratios show a constant decrease in the trend as bearish scenario.
We might get another 10% deeper if BTC decreases drastically.
1H candlesticks show more aggresivenes than in 4H, but still it is in the
Fib's ratio.

Bitcoin looks ready for a runBitcoin reacted at the 886 level as shown in last outlookbut came right back up, ignoring every potential sell zone in its way and is now about to break the area.
Some kind of "disbelief" move is very likey to happen at this point with a quick rally to 30k as a very important psichological level and has many fibonacci confluence.
Overall market sentiment still seems to be bearish, the more people doubt this move, the higher it will go.
Still thinking the bootom is yet to be put, if we break 30k i might change my mind.

Bitcoin to 13k? Drop incoming!Big resistance on 28k
Fibonacci returns the same 28k resistance
I expect btc to bounce from 28k to 13k zone, we are still in a bearish market, we can't hold these markets.

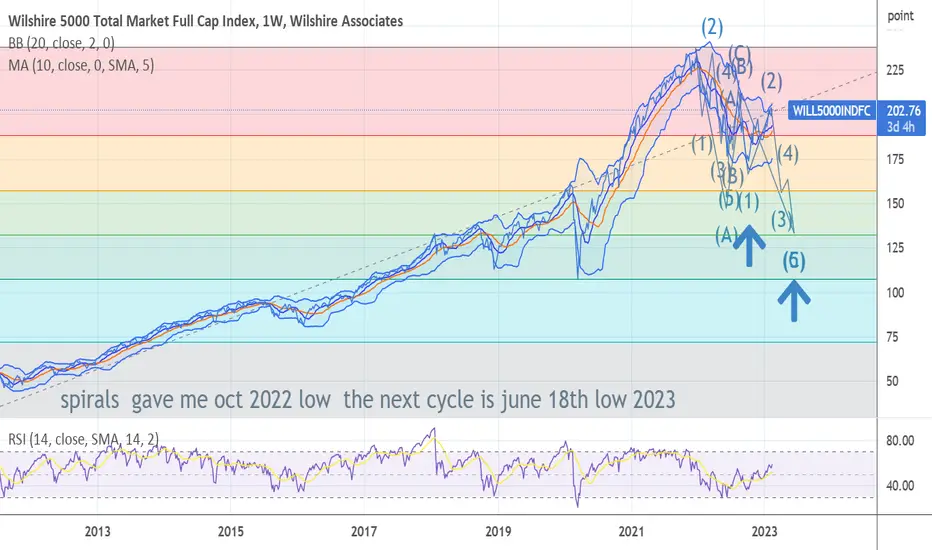
25 year monthly study of ESAnnotations included on the chart:
This chart is essentially demonstrating just how far the market is capable of pulling back. The chart includes key levels and the years of notable highs / lows as well as + / - rejection boxes showing where price pivots as well as how perfectly, years later, price is capable of traveling far distances to perfectly tap back into an old rejection block. Most notably the 2020 pullback that perfectly filled the small rejection block created when price was finally able to make a break above in 2016.

Bitcoin looking for shorts around 25500$ region to 26000$Waiting for 25k resistance to get hit , and then i will see for a good entry around 25k or 26k ,wide stop loss since i am trying to catch a 15% drop .

STILL 100 % of track NEXT LEG OF THE BEAR IS ABOUT TO START I am now getting another major sell model long term sp 500 to total Long term bonds is been given in my models I personally have moved into 6 month and 1 year till bills today I manage six large trusts And told my group to shift All funds into insured accounts I will be moving to 50 to 75 % % short on any rally into 4183 and 100 % at 4212/4222 or on a stop of 3988 . sp 500 to bonds ratio is near BELL RINGING now as of today I see the lows of dec and oct taken out I have two targets based on the cycle low projection 3510/3490 . . I came up with in dec 2021. target is 3390/ is the alt the main target is 2785/2985 the decline should be in time cycle march low 2024 and should unfold in another clear 5 waves .. BEST OF TRADES ! WAVETIMER
Testing Rejected Price has been rejected of the broken support strong now resistance. Too much resistance above, I don't think this one is coming back.

XAUUSD: Gold Sells Weekly- Bearish
Daily- Doji
4HR- bullish
1 HR - Bullish
potential fake out
looking for sells at 1831.767 bearish closure / BREAKOUT
NEWS: 2 USD RED FOLDERS
:2 USD ORANGE FOLDERS

Can a bear market end without capitulation?We haven't seen a big sell-off or capitulation.
VIX didn't go above 35.
Is this bear market going to end without a capitulation?

Quick BTC outlook!Here's a quick look at the 6 hr. BTC chart. As we can see, the price broke below the broadening wedge and is currently testing the support zone. We should expect much lower prices if the price breaks below the support zone.
There are some unfilled Fair value gaps between 20k and 18k. These gaps tend to get filled at some point! Also, the DXY is expected to rally from its current level - when the DXY goes up, the BTC price will go down!
I firmly believe the bottom will be close to the 10-12k area. We have yet to see the last capitulation, IMO, yet! Trade Safe!
-------------------------------------------
What's a Fair Value Gap?:
A fair value gap is the difference between a financial instrument's theoretical value and market value, such as a derivative or security. It can indicate a misprizing opportunity for traders to profit by buying or selling at the misprized level. In other words, there is a gap in the price in which some open orders still need to be filled. The price will return to fill the orders.
-------------------------------------------
If you like the content, then make sure to comment and like the post :D
Follow me for daily profitable trading setups.
BTC dictates the market. If BTC falls, then Alts will drop as well. Trade safe!

DXY - BTC correlation Looking forthe dollar to get stronger here in the next few weeks which would contribute to the crypto market finally bottoming out.
March will be a pivotal month, thinking is when the bottom will come.

Great Bear of 22/23 Ain't Over: Fat Lady Didn't Sing YetReal simple idea. All the Happy enthusiastic FOMO and BTFD tech stonks still trading at 700x PE. All Happy BS.
You BTFD here you gonna get a nasty surprise, surprise, surprise. This monthly view shows where RSI goes in a real Bear.
NB: U R HERE... U R NEXT! This won't happen overnight, it will be a painfull grind with some terrific knifedowns.
Real Bears last for >500 days. Y2K Dot-Com was >900 days. Great Finance Crisis was 17 months, >500 days. Now at day 400.
BIggest Bear in history to follow longest Bull run ever. Stonks went up for 12 years with a few correections.
Big reset is overdue, 2/3 of the reset comes in last 1/3 of the Bear. Final move coming soon if so.
Get ready to get skeered. Worst still yet to come imo. We neeed VIX >40 and capitulation, panic selling to call bottom.
Long TL points at 3200. We will see. Next 90 days gonna be an amazing ride if this idea is on target. GLTA

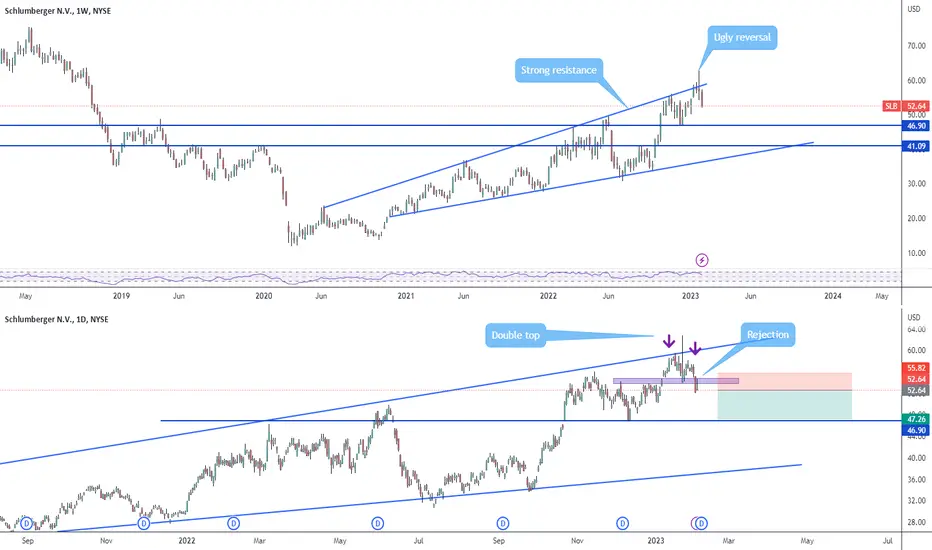
Ugly reversalTop chat in the weekly time, bottom chart in the daily timeframe,. Looks that price is heading to the $47 support level. It may drop to the bottom of the channel but the energy sector still strong. I take profit at 47, then I'll see.
BITCOIN to 12k zone. SHORTWe are starting the fifth and final wave for BTC, this pump was just a retracement. Bitcoin 10k to 12k target is still likely. Recession is just starting, we have a whole more year of bearish market. NFA

BTCUSDT Correction development scenario of bear market terminusBTC just made a pullback to neckline of the major Head and Shoulders formation on macro. Now, the price action is abandoning the distributive structure with weak volume, due to a micro H&S.
Points of interest
We can see on this chart levels to be watch in a potential swing downward. BTC has been trading in a choppy structure, consolidating within a ending diagonal. The potential drawdown till FEB close tends to be form a monthly bearish Harami candlestick pattern, which is highly reliable on higher timeframes.
This pattern can be consider highly reliable. A Harami bearish just play out on the last weekly close (1W) and tends to be form on 1M, in which is a rare case. In bear markets, this pattern is an important reversal signal after a rally of relief, indicating an intermediary point for an 2nd and final swing leg-down. On this chart, you can see that the potential throw-over of actual consolidation (choppy structure / breakout of Harami) is in confluence w/ a expected final swing leg-down of an expanding ending diagonal.

BTCUSDT Potential Harami bearish on 1MA Harami bearish, candlestick reversal pattern, is about to occur on 1M chart twice after the All-Time-High event. If this projected drawdown plays out. This indicate a strong bearish signal. Harami is highly reliable in bearmarkets, in which pattern is a signal of top price. A Harami bearish just played on 1W chart. This replication on monthly chart will signal potential lower low, i.e. the bottom 15k of moonbois is nothing but a dream.
Greater timeframe, greater reliability.
The micro price action is performing like a final phase (E) of distribution pattern of Wyckoff method.
Now, on hourly chart, we can see a Head and Shoulders top formation targeting local demand. Also, an Alternate Bat harmonic pattern can occur, projecting price more drawdown, as we can see on chart.
Abandoned Baby bearish candlestick pattern is also performing on H4.
Oscillator Fisher Transform bearish.
Elliot Wave Method ]
Bitcoin seems to be ready to ride a route-off of this choppy bear market, as in a turn-point to made the 5th wave of an expanding ending diagonal, in which a bearish impulsive wave can occurs to throw-over this broadening wedge structure. This indicate potential lower low.
According to my wave count, Bitcoin is about to accomplish this actuall supercycle, making a wave 4 of an expanding ending diagonal, in which one more supercycle may complete this potential pattern, which a new ATH can surpass 200k. The 5th wave of the ending diagonal, which will be the next bullrun supercycle to complete the wave I of the Grand Supercycle, don't needs to touch the upper trend-line. For the validation of this pattern, the bottom of this actuall bearmarket needs to be accomplished, completing wave 4. Then, the shape of the channel will be definetly drew. If this market respect Elliot Wave rules, a severe bearmarket will occurs to made the Wave II of Grand Supercycle.
From a chart pattern perspective, this peak can be consider a pullback to Head and Shoulders neckline in confluence with the back-test to anchored VWAP from ATH. Indicating turn-point.
Fibonacci
Historically, In all corrections, BTC retraced either 88.6% of the same measured Fibonacci retracement, decreasing more than 80% in it's price from each new all-time-high. As we can see applied on this chart, a drawdown either 50% can be expected.
Pivot levels
Stablished pivot levels from the sum of HH+HL+Close:3 from the choppy sectors selected. in a fractal manner, the pivot level is a potential area of interest to re-entry. The price can shakeout in this range due to the anchored VWAP from candle of 13-Jun'22 reaction, thus I've pinpoint these levels to be watched.
Harrmonic pattern prediction
In prediction, a Partizan 2.4 harmonic pattern can be formed on this speculative bottom region, lead price above to 40k supply region.

BTCUSD Pullback to Neckline Accomplished. 50% drawdown expectedSigns of reversal, market structure choppy. Flat correction in consecutive double three zig-zags on the upper boundary of a macro diagonal after an complete impulsive wave; lower highs with decrease of volume, showing lack of confidence by the buyers-side, as shown on Weis Wave Volume indicator; overbought condition.
Harmonic patterns: potential bearish Crab leading to supply. If price action don't reach this area breaking volume POC, a least a back-test to VWAP from the higher high can be occur, leading by an 3-Drives pattern. High possibility of a POC back-test @ preferencial 14,6% Fibonacci retracement zone. Plus AB=CD bearish projection leading to the micro demand zone.
Strong hidden bearigh divergence on CCI oscillator.
Short position swing perspective: if price broke weekly pivot level @ 21009 with strength, possible intermediary target @ 18229 support. The price can retrace to the pivot.
MACRO
Weekly price action: the price made a strong bearish candlestick pattern Harami Cross.
The price is trading in a broadening structure like a ending diagonal formation.
Weekly scenario: price pulled back to neckline from the major Head and Shoulders back-testing the VWAP from ATH. In a potential fractal from the 1st test of this VWAP, in which the same Harami Cross performed in an overbought condition, showing that a strong supply was reached.
In addiction to the fractals, I've selected the local choppy structure and calculated the pivots by the sum of high+low+close:3, resulting in a key level exposed, in which price retraces before continue the decline in an impulsive bearish leg-Down.
Expectation: possible lower low if a throw-over occurs in a breaking of the expanding diagonal structure. this can be lead price to touch the same 88,6% Fibonacci level as occurred historically in all corrections. Therefore, a drawndown of 50% to the 11k level seems strongly possible,
---------------------
Bitcoin is about to complete it's first Wave 1 Grand Super Cycle bull run, in which actual point seems to be forming a ending diagonal of 5th impulse wave.
