Cycle Bottom Indicator [CBI] - Log Chart [UPDATE 07]For those still following at home, a final update before we get our enviable cross on our custom coded Cycle Bottom Indicator first live test.
As per previous posts, indicator has been fitted using the past two prior cycle bottoms with a 3 day tolerance.
Bearmarket

#bitcoin $BTC printind the end of this bear market?BTC has been trending downwards for more than 200 days, and is currently printing a bullish engulfing candle on the weekly timeframe!
if we close this candle above the previous candle's open price, which is about $21038 , we can expect an uptrend to start, which is what happened last time we had a bullish engulfing candle at the end of a downtrend: last year, in July
let's hope we close above 21k tonight!!
could this be the end of the bear market?
I think it might be, but we of course need some more confirmation to be sure it really is
let me know what you think about this idea! personally opened a BTC long :)

BTC Daily TA Cautiously BullishBTCUSD Daily cautiously bullish. Recommended ratio: 70% BTC, 30% Cash. *Cryptos (mainly altcoins like ONE, XTZ and GRT) are bullish over the weekend as almost all financial markets attempt to continue the relief rally with (dire) hopes of finding a bottom.* Price is currently trending sideways at $21500 as it continues to test $20k psychological (and critical) support. Volume is Low and currently on track to favor sellers for a second consecutive session. Parabolic SAR flips bearish at $18845, this margin is neutral at the moment. RSI is currently trending sideways at 47, just below the descending trendline from January 2021 at ~50 (critical resistance); if rejected here (confirmed) it would be bearish. Stochastic remains bullish and is currently trending sideways at max top in the 'autobahn zone'; this is bullish. MACD remains bullish and is currently testing -869 minor resistance, if it breaks above this level then the next resistance is at 313. ADX is currently trending down at 33 as Price continues to push higher, this is mildly bullish. If Price is able to continue up here above $22k (transfer from altcoin gains), then the next likely target is a test of $24181 minor resistance . However, if Price breaks down here, it will it will likely retest $19417 support before potentially testing the uptrend line from April 2017 at ~$15k as support for the first time since September 2020. Mental Stop Loss: (one close below) $20k.

Bitcoin Weekly Chart FractalAlways forward looking.
$BTC December PA looks to be a close approximation of the past 4 weeks of behavior on the weekly chart.
The late November markdowns repeated at the beginning of June.
In November the heavy markdowns were followed by a soft green candle, a hard red candle, then a strong green candle... similar to the past 3 weeks of price action we've seen from mid-June through early July.
Given key support levels around $17.5k and $13.5k lining up relatively closely to the percentage declines realized late December, early January.
The bearish price action is tied to the broader markets, there will be bear market rallies.
This looks interesting and worth keeping an eye on.

$SPX breaking downtrendS&P 500 index looks to be finding its footing. It just broke through the 20-day moving average with gusto. The 20-day MA is a good gauge for shorter-term momentum.
This all hangs on being able to hold above the 20-day MA, if so, the next test will be at 3,978, which is approximately right where the downtrend line and the 50-day moving average meet. If it can break through this downtrend line and hold above it while making higher highs, we could be saying bye-bye to this bear market.
Oddly enough this is also right where the gap that is yet to be filled is.
Those of you that don't think stocks can do well during a recession have not read your history books or done your due diligence. I am not in the recession camp though. I am in the "definition for recession is no longer relevant in today's financial world" camp. Yes, based on the old technical textbook definition, 2 negative GDP quarters in a row=recession.
I think we are going to still have the next roaring 20s, I'd put my money on a rally/rage into the end of the year then an economic boom when some of the macro and geopolitical bugaboos get solved with time.
Happy to discuss and answer questions.
Thanks,
Tiger

BTC: Rallies keep failing?!Bitcoin
Intraday - We look to Sell at 21398 (stop at 22002)
Daily signals are bearish. We look for a temporary move higher. Early optimism is likely to lead to gains although extended attempts higher are expected to fail.
Our profit targets will be 19909 and 19509
Resistance: 20720 / 21000 / 21500
Support: 20000 / 19500 / 19000
Please be advised that the information presented on TradingView is provided to Vantage (‘Vantage Global Limited’, ‘we’) by a third-party provider (‘Signal Centre’). Please be reminded that you are solely responsible for the trading decisions on your account. There is a very high degree of risk involved in trading. Any information and/or content is intended entirely for research, educational and informational purposes only and does not constitute investment or consultation advice or investment strategy. The information is not tailored to the investment needs of any specific person and therefore does not involve a consideration of any of the investment objectives, financial situation or needs of any viewer that may receive it. Kindly also note that past performance is not a reliable indicator of future results. Actual results may differ materially from those anticipated in forward-looking or past performance statements. We assume no liability as to the accuracy or completeness of any of the information and/or content provided herein and the Company cannot be held responsible for any omission, mistake nor for any loss or damage including without limitation to any loss of profit which may arise from reliance on any information supplied by Signal Centre.

SPX Daily TA Neutral BullishSPX Daily neutral with a bullish bias. Recommended ratio: 63% SPX, 37% Cash. * FOMC minutes were released at 2pm (EST) today and the main takeaways were: the Fed is committed to price stability and maximum employment and will take on a even more restrictive stance if inflation isn't tamed; they are most likely going to raise 75bps unless CPI comes in lower than expected or Russia/Ukraine situation improves, in this case they may raise 50; and that housing, job and credit markets are healthy as of May and the Fed thinks GDP will bounce back in Q2 - very curious to see how declining new home sales, growing gas and food prices, more layoffs and higher credit card usage will reflect on this perspective come July 27th. The current GDPnow estimate for Q2 GDP is -2.1% , and the next estimate is due tomorrow at 830am (EST). Gold + Oil + VIX + Euro are down and Equities + Treasuries + Cryptos + USD are up, markets seem to be pricing in a recession at this point. I guess it's only a real recession if the Fed says it is though.* Price is currently trending up at $3845 and forming a Bear Flag after bouncing from $3780; the next resistance is the lower trendline of the descending channel from August 2021 at $3938 minor resistance and the next support (minor) is at $3707. Volume remains Moderate and has favored buyers for the past three sessions. Parabolic SAR flips bearish at $3706, this margin is neutral at the moment. RSI is currently trending up slightly at 46, the next resistance is at 53 and support at 38. Stochastic remains bullish for a second consecutive session and is currently trending up at 84 as it attempts to flip 76 resistance to support on its way to testing to max top. MACD remains bullish and is currently trending up at -56 as it slowly approaches -44 resistance, the next support (minor) is at -76. ADX is currently trending down slightly at 22 as Price is pushing higher, this is mildly bullish. If Price is able to continue up here then it will likely retest the lower trendline of the descending channel from August 2021 at ~$3938 minor resistance . However, if Price breaks down here, it will likely retest $3707 minor support before potentially heading lower to test $3508 minor support. Mental Stop Loss: (one close below) $3780.

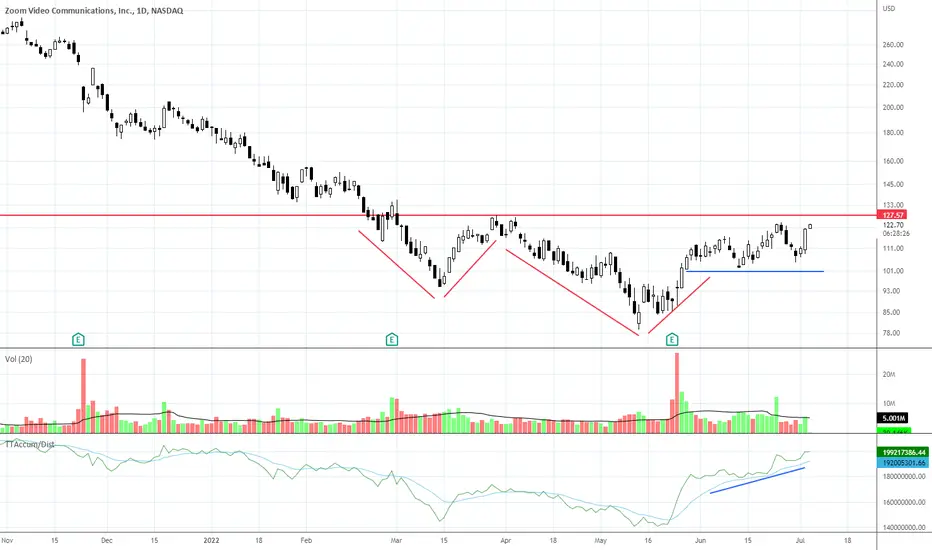
ZM Bottom BuildingThis young company benefited greatly from the pandemic but like all of the some 100+ companies that had huge revenues in 2020 - 2021, it was not sustainable due to the artificial inflation of stock prices via stimulus checks. Since the stimulus was a manipulation of the monetary system and the financial markets, there is no way any firm could manage the situation. So the stock plummeted due to lower revenues and earnings.
Now, it is definitely building a bottom. It is not complete, and I always advise waiting for completion of a bottom because it is emotionally draining for most investors or position traders to watch the stock fall further and wait for it to recover and move up higher thereafter. It takes a lot of discipline and confidence to hold in a final run down in a bear market. So avoid the risk and wait for a completion of the bottom.
ENS DAO NFT Culture Now that ens is under $10 (not the $3 I predicted in November 2021, but close enough) it’s looking like a bright spot in the crypto market. One thing that many shitcoin crypto projects have failed to do is create value in any way.. No products, no use case, literally a ponzi. ens domains maybe building something and it’s profitable. I’ll admit it’s not much but it’s something and it’s gained a lot of traction on Twitter. They have a product (.Eth domains) they have revenue, and they have a governance token which could be used in the future to allocate the profit from .eth domain sales towards anything really.
I’m gonna start posting some of my picks for best cryptos to invest during the cryptopocalypse - here’s the first one - ens, ill start buying a little now. I don’t care if it’s the bottom, I’m ok with ens going to 0. I’ve also started accumulating .eth names as well as other domain extensions like .XYZ .NFT and more. It’s kind of fun once you get into it, and it’s a low barrier of entry. I already sold a few .Eth names for profit after just a few months of playing with them.

Verizon: High Div Yield vs CG Loss?Verizon Communications Inc
Short Term - We look to Sell at 50.20 (stop at 51.90)
A sequence of weekly lower lows and highs has been posted. We can see no technical reason for a change of trend. 50 4hour EMA is at 50.38. We expect a significant move lower if prices manage to break the 50.38 support. Further downside is expected.
Our profit targets will be 46.05 and 45.00
Resistance: 52.00 / 55.53 / 59.80
Support: 46.00 / 42.80 / 38
Please be advised that the information presented on TradingView is provided to Vantage (‘Vantage Global Limited’, ‘we’) by a third-party provider (‘Signal Centre’) . Please be reminded that you are solely responsible for the trading decisions on your account. There is a very high degree of risk involved in trading. Any information and/or content is intended entirely for research, educational and informational purposes only and does not constitute investment or consultation advice or investment strategy. The information is not tailored to the investment needs of any specific person and therefore does not involve a consideration of any of the investment objectives, financial situation or needs of any viewer that may receive it. Kindly also note that past performance is not a reliable indicator of future results. Actual results may differ materially from those anticipated in forward-looking or past performance statements. We assume no liability as to the accuracy or completeness of any of the information and/or content provided herein and the Company cannot be held responsible for any omission, mistake nor for any loss or damage including without limitation to any loss of profit which may arise from reliance on any information supplied by Signal Centre.

US500/SPX enters into a bear market The last time this happened was in 2018 but the market some how management to rally which resulted in a false breakout.
In 2020 the market came back to this level and spiked around this area before turning into an almost 2 year rally.
2007 was a different story as market broke structure and the result was a sell of that lasted one year.
What will happen in 2022? Will the bulls take control and result in the SPX hitting another all time high.
Or will we see similar events of what happened in 2007 which resulted in a huge sell off that one year.

Channel or Bear FlagWe are sort of in this channel or possibly a giant bear flag right around the bear market zone. But short term, looking for a rally to 4000 on SPX futures.

Msft:Even the giants are falling!Microsoft
Short Term - We look to Sell at 260.71 (stop at 269.78)
The primary trend remains bearish. A sequence of weekly lower lows and highs has been posted. We can see no technical reason for a change of trend. Preferred trade is to sell into rallies. Further downside is expected.
Our profit targets will be 238.72 and 230.00
Resistance: 267.00 / 290.00 / 315.00
Support: 238.00 / 200.00 / 180.00
Please be advised that the information presented on TradingView is provided to Vantage (‘Vantage Global Limited’, ‘we’) by a third-party provider (‘Signal Centre’) . Please be reminded that you are solely responsible for the trading decisions on your account. There is a very high degree of risk involved in trading. Any information and/or content is intended entirely for research, educational and informational purposes only and does not constitute investment or consultation advice or investment strategy. The information is not tailored to the investment needs of any specific person and therefore does not involve a consideration of any of the investment objectives, financial situation or needs of any viewer that may receive it. Kindly also note that past performance is not a reliable indicator of future results. Actual results may differ materially from those anticipated in forward-looking or past performance statements. We assume no liability as to the accuracy or completeness of any of the information and/or content provided herein and the Company cannot be held responsible for any omission, mistake nor for any loss or damage including without limitation to any loss of profit which may arise from reliance on any information supplied by Signal Centre.

BTC Daily TA Neutral BullishBTCUSD Daily neutral with a bullish bias. Recommended ratio: 52% BTC, 48% Cash. * The final Q1 GDP growth estimate came out this morning at -1.6% compared to preliminary estimates of -1.5% and compared to +6.9% growth in Q4 2021; the estimate miss was tolerable and it seems as if this degree of negative growth was priced in to financial markets based on the brevity of the negative market response. Fed Chair JPow also reiterated at an ECB conference today that the Federal Reserve's primary concern is price stability and that they will continue to raise rates to bring down inflation, even if it pushes the economy into a recession and higher unemployment; as it stands now the FOMC is intent on bringing the Fed Funds rate to at least 3.5% EOY ( it is currently at 1.75%, and 1.58% effective ). 3AC is currently undergoing a forced liquidation which is most likely putting downward pressure on BTC. Lastly, the Core PCE Price Index (the Fed's favored gauge of inflation) report is due tomorrow at 12:30pm (EST).* Price continues hovering above $20k as it is currently on the verge of losing support of the uptrend line from 06/18/22 at ~$20600. Volume is Moderate (low) and currently on track to favor sellers for a fourth consecutive session. Parabolic SAR flips bearish at $18600, this margin is mildly bearish at the moment. RSI is currently trending sideways at 32; the next support is at 25.60 (which coincides with the uptrend line from 01/22/22) and the next resistance is at 42.41. Stochastic remains bearish for a second consecutive session and is currently testing 77.95 support after forming a peak at 92. MACD remains bullish and is currently trending up slightly at -2129 while it is still technically testing -2497 minor support; the next resistance is at -1435. If Price is able to recapture the uptrend line from 06/18/22 by breaking and closing above $21k, then it will likely test $24180 minor resistance . However, if Price continues to fall here, it will likely retest $19417 support before potentially testing the uptrend line from April 2017 at ~$15k for the first time since September 2020. Mental Stop Loss: (one close below) $19417.

Oracle: No end in sight for the pain!Oracle
Intraday - We look to Sell a break of 68.29 (stop at 71.31)
The primary trend remains bearish. A sequence of daily lower lows and highs has been posted. We can see no technical reason for a change of trend. We expect an initial move higher to fail and look to set shorts on a break back through 68.50.
Our profit targets will be 60.09 and 58.00
Resistance: 71.50 / 74.00 / 82.00
Support: 60.00 / 56.00 / 44.00
Please be advised that the information presented on TradingView is provided to Vantage (‘Vantage Global Limited’, ‘we’) by a third-party provider (‘Signal Centre’). Please be reminded that you are solely responsible for the trading decisions on your account. There is a very high degree of risk involved in trading. Any information and/or content is intended entirely for research, educational and informational purposes only and does not constitute investment or consultation advice or investment strategy. The information is not tailored to the investment needs of any specific person and therefore does not involve a consideration of any of the investment objectives, financial situation or needs of any viewer that may receive it. Kindly also note that past performance is not a reliable indicator of future results. Actual results may differ materially from those anticipated in forward-looking or past performance statements. We assume no liability as to the accuracy or completeness of any of the information and/or content provided herein and the Company cannot be held responsible for any omission, mistake nor for any loss or damage including without limitation to any loss of profit which may arise from reliance on any information supplied by Signal Centre.

END OF BEAR MARKET???BTC on weekly approached the important level of support zone at 200MA and the 19.6k support from 2017 ATH.
Every time in history BTC bounced of that level of 200MA. Just like 2020 Covid crash BTC can dip even further but it has to close above or at 200MA in order to end the bear market.

BTC/USDT (1D) How Bad could it be ? (Worst case scenario)Hi Traders and HODLers....
If you ask yourself how low could BTC Fall during this correction ? Well .. it all depends if you believe to EW counts and Fibonacci extensions.
This EW Count shows my expectation of FreeFall back down to 11K zone in case of A:C 1:1 Extension.
Right now Bitcoin is fighting for most iportant levels. If he fails. We could finish in a BEAR market for months (maybe year or 2 untill another Halving ?).
This is not investment advice, just my warning how bad it could be.
Even when I am very Bullish LONGTERM ... also You should always ask yourself if you risk only the money you will not need for such longtime ;)
Trade and invest safe, always consider risks.

BTC dominance Analyzehello friends.
BTC Dominance is in an important zone.
and its near 200 day MA and maybe we touch this MA at 42.7 and then pullback.
if this section happen we could rally up to 45% and 47% that shows a massive correction
for altcoins.
if we lose this 200 day MA we could go down to 41.55% and then 40%.
if this happen we will see massive rally from altcoins.
but according to the market conditions i think we touch 200MA and then go up.
so maybe we will see altcoin crash these days and altcoins will see their downside supports.
thank you for reading my idea.
please comment your opinion and teach me something new!
(!!!NOTE!!! : my ideas are not trading or investing advice.
so follow your own strategy and your own opinion.)

#HEX still under control of the BEARS!From the inverse HVF funnel formation and break.
HEX dropped below 3 cents
A return move to the initial funnel range , seems to be a relief rally.
If #Bitcoin does continue on below $15,000 and under
The projection of HEX to reach a penny for a capitulatory, cycle bottom still exists.
This I believe will set up for a fantastic reflation period of #crypto going into 2023 and the next cycle top in 2025.
A few more months of pain , but the rewards for sticking around, and being patient will reward some of us. Not everyone can make it despite the great design mechanics of HEX , this is still highly speculative and the volatility wears on even the strong minded.
Survive to Thrive!

BITCOIN BEAR MARKET TO CONTINUE, NO HIGHER THAN 38.5K IN 2022!The 200 DMA is a very important level for Bitcoin.
BTC under 200 DMA = bearish
Let's look at the past:
Late March 2014 - Late June 2015 = BTC was below 200 DMA, Bear market, roughly 16 months of bear market. MAJOR BEAR MARKET
March 2018 - April 2019 = BTC below 200 DMA, Bear market, roughly 14 months of bear market. MAJOR BEAR MARKET
September 2019 - April 2020 = BTC below 200 DMA, Bear market, roughly 8 months of bear market. MINOR BEAR MARKET
Late December 2020 - now = BTC below 200 DMA, Bear market, so far 6 months of bear market. MAJOR BEAR MARKET.
Going by historical trends, BTC bear markets tend to last 14-16 months, with a smaller bear market one year before halving (2019, most likely 2023)
Meaning the current bear market is likely to end roughly Jan 2023 - April 2023
Once the 200 DMA starts to come closer to the price action, they we should start seeing bullish movement. These DMA levels move slowly, if we try to draw one, it likely comes close to December 2023... however if BTC falls to 17k or lower, the DMA likely takes 1-2 more months to get to that level, so early 2023 is most likely when this happens.
It takes roughly 90 days for DMA to fall by 10k, in 180 days (roughly 24th of December), the DMA is likely to fall to 18k levels as the current pace
If we go by this chart, it makes it very unlikely that we will see prices higher than 28k after end of September 2022, and unlikely we see BTC close above 38.5k in 2022.
There is chance we could go even lower than 10k in 2022, let's not rule this out! Economic situation is quite bad and we must keep an open mind. Of course odds of going below 10k are low, but they aren't impossible
Each yellow box represents 90 days.
I drew the white lines in the yellow box a little sloppy, so it's not meant to be fully accurate but to get a general idea

BTC Dominance Chart What Is BTC Dominance?
Bitcoin dominance, or BTC dominance, is measured as the ratio of the market capitalization of bitcoin to that of the rest of the cryptocurrency market. Some crypto investors and traders use bitcoin dominance as a guide to adjust their trading strategies and portfolio structures.
Source: Binance Academy
Quick Forecast, we may see a possible run for short-term sell-side then possibly a run higher = possible run higher on BTC then a lower BTC price delivery.
Introduction
While there are now thousands of altcoins out there, bitcoin, the original cryptocurrency, has remained the largest digital asset by market capitalization. Observing the dynamics of bitcoin’s share in the value of the overall crypto market, traders have spotted certain recurring patterns of market conditions. Some came to use BTC dominance as a guide for their trading behavior. In particular, BTC dominance is believed to offer insight into the current general market trend.
BTC dominance and market capitalization
In simple terms, market capitalization refers to the total value of a certain asset in circulation. For Bitcoin, the market cap is calculated by multiplying the current price and the number of BTC that have been mined so far.
You can calculate bitcoin dominance with this formula:
Bitcoin dominance = Bitcoin market cap/ Total cryptocurrency market cap
Factors influencing BTC dominance
Changing trends
Before the explosion of altcoins, it was not uncommon for bitcoin dominance to hover above 90%. As altcoins collectively gained more user and investor interest, bitcoin lost some of this almost undivided attention to other assets with greater price swings and projects boasting new exciting use cases.
While bitcoin was created to change how the transfer of value worked, crypto projects have evolved to do more. Unlike bitcoin, many altcoins are involved in different sectors, including gaming, art, and decentralized financial services beyond transferring money. Depending on the current trend, there may be more interest and trading around a particular type of crypto project. For instance, the explosion of NFTs may have caused BTC dominance to drop somewhat in favor of NFT-related tokens.
Over time, bitcoin has established itself as one of the more “stable” crypto assets. Traders’ interest in more dramatic price swings and associated profit opportunities that some newer altcoins offer can also affect bitcoin dominance, leading to funds flowing into riskier assets. In this case, the sectors these altcoins represent may not matter as much as the potential profits.
Bull or bear market
Over the last several years, there has been a general rise in the popularity of stablecoins, a trend that exerted sustained pressure on BTC dominance. More specifically, in a bear market or in times of volatility, stablecoins are often used to protect crypto investors’ funds amid falling prices. A stablecoin is an altcoin designed to maintain value equal to that of an asset with a more stable price, such as a fiat currency or commodity. Crypto investors and traders often use stablecoins to lock in profits without having to convert their crypto to fiat. When funds move out of the BTC market and into stablecoins, BTC dominance could go down.
The inverse is likely in a bull market. When the market is up, traders can be incentivized to move value from stablecoins into more volatile assets that offer more trading opportunities, like bitcoin. However, emboldened traders may also choose riskier options and pump liquidity into altcoins that are even more volatile than BTC, so the overall effects of favorable market conditions on bitcoin dominance are highly context-dependent.
On-ramping via stablecoins
Stablecoins offer a convenient way to access a wide variety of cryptocurrencies compared to using fiat. This is because while there are fiat-to-crypto exchanges called gateway exchanges, they can be restrictive and only offer the more popular cryptocurrencies and stablecoins. Crypto-to-crypto exchanges, however, often provide a more comprehensive selection of cryptocurrencies tradable with select stablecoins. Hence, people who want to trade specific cryptocurrencies may enter the market via stablecoins. Naturally, if a significant amount of new funds enter the market through stablecoins and not bitcoin, the total value of the crypto market increases, causing a dilution in BTC dominance.
Emergence of new coins
Sometimes, new coins that enter the market can gain popularity quickly, causing BTC dominance to decrease. Remember that bitcoin is “fighting” with every other cryptocurrency in the market, so the emergence of several popular altcoins at once may affect it. However, there’s a chance that these altcoins may lose popularity after the hype dies down. If that happens and funds are moved from these altcoins to BTC or out of the crypto market entirely, BTC dominance may rise again.
Using BTC dominance with current bitcoin price
Some people monitor bitcoin price along with bitcoin dominance to help them make trading decisions. Although they are not iron laws, here are some potential outcomes that various combinations of BTC price and dominance may be indicative of.
When the price and dominance of BTC are rising, it could signal a potential bitcoin bull market.
When the price of BTC is rising but BTC dominance is falling, it could signal a potential altcoin bull market.
When the price of BTC is falling but BTC dominance is rising, it could signal a potential altcoin bear market.
When the price and dominance of BTC are falling, it could signal a potential bear trend for the entire crypto market.
While these two factors do not imply a definite bull or bear market, historical observations suggest a correlation.

BTC/USD: A Study Through Time CyclesHello Traders 👋
This is a small attempt to analyze the BTC/USD through the lens of historical time cycles.
I can observe, on this monthly log chart, a 4 year correction cycle -- 2014, 2018 and now in 2022
Previous corrections:
2014
Dip = -86%
2018
Dip = -84%
Current Correction:
2022
Dip so far = -74%
The previous bear markets ended with a dip of around 80%. This time it made a double top in the later half of 2021 and has already slashed 74% from the top so far. Does that mean there is still room for 5-10% correction?
If we look at the chart June 2019 highs were at around 13880 levels. So this area acted as resistance. This area also coincides with our 80% correction cycle which is at around 13800. This area of resistance could become a potential support zone in case of further dip.
But before reaching at any final conclusion, one has to observe the price action at above mentioned zones on a lower timeframe, say daily. The price often builds a horizontal cause (accumulation) before revealing vertical results. So its better to wait for some accumulation before getting into buy mode.
I hope this was helpful. Thanks for reading 👍

BTC - Bearish Harmonic Pattern for last Flush before bull rallyI am going to short the end of the harmonic at 23.2 K for 10% SL swing let's see how it plays
