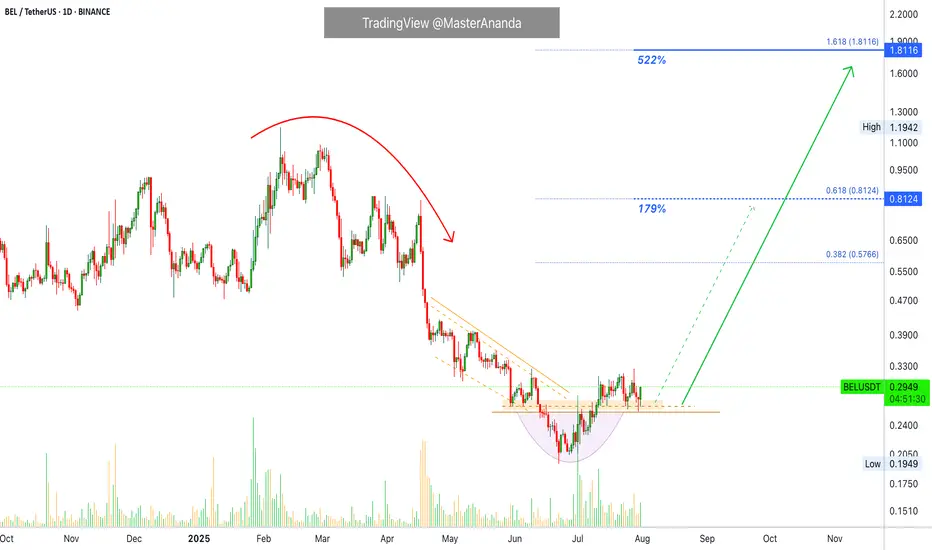
Bella Protocol 522% Easy Profits PotentialWe are going to be looking at many charts together every single day. We will go through all the altcoins basically. I am starting with some of those from the last period that didn't move. The charts look good but they filed to break their May high. These pairs are now ready to move before the rest of the market.
Here we have BELUSDT. A nice rounded bottom to end the downtrend. A small bullish recovery supported by high volume.
We have a perfect set of reversal signals and today a full green candle. This candle confirms those signals and opens up the chance of a strong advance. If the action starts now, you can be looking at the start of a major 2-3 months long move.
There will be some stops along the way but the action should be bullish nonetheless, higher highs and higher lows.
Strategy
In this setup we simply buy spot, no stop-loss. After buying we wait for as long as it is needed for prices to rise. Normally within 2-3 weeks, can be just a few days, but sometimes the wait can extend to 1-2 months. It varies. We are always prepared and ready to wait six full months, so if anything happens before this time horizon, even better but be ready to wait.
Even if you were to sell your current pair to buy a new one, the new one also requires waiting. We tend to sell wanting to find something that is moving but the moment we sell, we are faced with the same problem; even if the pair you chose is moving you have to wait for the bullish wave to develop. Even if prices rise 5% daily it would still take 20 days for a 100% price increase. 40 days for 200%. Etc. Patience is key.
So, simply, buy and hold. The market will take care of the rest.
Namaste.
Bellaprotocol
BELLUSDT Forming Bullish BreakoutBELLUSDT is shaping up as an interesting crypto pair to watch closely in the coming weeks. The chart structure shows a well-defined falling channel, which historically indicates a potential trend reversal when price breaks above the channel’s resistance. With the volume staying healthy, it is clear that investors are starting to accumulate positions in anticipation of a bullish breakout. This is often the early signal that smart money is entering the market before a major move.
Currently, the technical projection for BELLUSDT suggests an impressive upside potential of around 90% to 100%+. This aligns with broader market expectations as altcoins begin to show signs of recovery after extended downtrends. If this breakout confirms with increased volume and strong daily closes above the resistance line, BELLUSDT could attract more momentum traders, further driving the price upward toward the projected target area.
What makes BELLUSDT particularly attractive is the recent surge in investor interest and positive sentiment building around the project. When paired with technical clarity like this, it creates an ideal scenario for traders looking for high-reward setups. Keep an eye on the breakout zone and be ready to manage positions accordingly, as such moves can develop rapidly.
In summary, BELLUSDT is offering a compelling technical setup that could deliver significant returns for traders who position themselves wisely. Adding this pair to your watchlist and monitoring volume trends will be key in catching the next big move.
✅ Show your support by hitting the like button and
✅ Leaving a comment below! (What is You opinion about this Coin)
Your feedback and engagement keep me inspired to share more insightful market analysis with you!

Alikze »» BEL | Ascending channel - 1D🔍 Technical analysis: Ascending channel - 1D
- BINANCE:BELUSDT It is moving in an ascending channel in the daily time frame.
- After hitting the ceiling of the channel, a correction has been encountered, which is met with demand in the OB area and an upward wave has formed.
- Currently, it can face the demand again and touch the specified targets by returning to the bottom of the channel and the green box area.
💹 Support zone: 0.48 - 0.39
🏹 Goals: 0.78 - 0.87 - 1.07 - 068
⚠️ In addition, if the 0.39 area breaks and is below the stabilization range, it can continue the correction process.⚠️
»»»«««»»»«««»»»«««
Please support this idea with a LIKE and COMMENT if you find it useful and Click "Follow" on our profile if you'd like these trade ideas delivered straight to your email in the future.
Thanks for your continued support.
Best Regards,❤️
Alikze.
»»»«««»»»«««»»»«««

Bella Protocol (BEL) completed a setup for upto 87% pumpHi dear friends, hope you are well and welcome to the new trade setup of Bella Protocol (BEL).
Previously we caught nice pump of BEL as below:
On a 4-hr time frame, BEL has completed a bullish Shark move for the next price reversal.
Note: Above idea is for educational purpose only. It is advised to diversify and strictly follow the stop loss, and don't get stuck with trade.

BELUSDT(Bella Protocol) Daily tf Range Updated till 07-04-24BELUSDT(Bella Protocol) Daily timeframe range. a impressive continues pump here. broke out of 1.8781 clean if it can sustain than 2.4580 clear to visit. a retrace would make sense a little cool down but that depends on retails now.

BEL/USDT Ready for an Explosive Journey? 👀🚀 BEL Analysis💎 Paradisers, turn your attention to BELUSDT as it offers a compelling trading opportunity. The asset is moving within a descending channel, hinting at a possible upward movement from a critical support level.
💎 Over the recent month, BellaProtocol has consistently followed its channel pattern. Now at a vital support level of $0.5179, there's a significant possibility of a bullish reversal that may lead to a breakout from the channel.
💎 This perspective is supported by VRVP analysis, indicating that previous visits to key support levels often result in strong bullish trends. If this upward movement persists, BEL is likely to aim for resistance levels around $1.01.
💎 Monitoring BEL's performance is essential. A drop below the current support level would necessitate a major reevaluation of our trading strategy. This change could signal challenges in sustaining the bullish trend, requiring a recalibration of strategies to adapt to the evolving market dynamics.
💎 Stay alert and ready, Paradisers. Your ParadiseTeam is dedicated to offering in-depth analysis and advice, ensuring you navigate the markets with expertise and confidence.

BEL/USDT Bullish Momentum ?? Bella Protocol Analysis TodayYello Paradisers, tune in!
💎 BEL has recently faced rejection at the resistance trendline and is currently retesting the demand zone, aiming for a bounce-back and another shot at breaking the resistance.
💎 The demand zone appears to be a robust area that has historically prevented BEL from dipping further. Multiple rejections and strong bounces have been observed whenever the price hit this zone. BEL is currently consolidating within a range of $0.45 to $0.93.
💎 The $0.45 mark serves as a significant demand area, while $0.93 acts as a bearish Order Block or a strong supply zone. Should BEL successfully break out of its current pattern, it has the potential to soar towards the $0.93 supply area.
Keep your charts refreshed and stay tuned for more insights! 🌴

Bella - two variants of price movementHi, everybody! I'll keep it short.
Symmetrical triangle, two ways out of it.
Up - the price can reach ~$1.10.
Down - the price can reach ~ $0.37.
This is not a financial recommendation, everything you do you do at your own risk.

Bellaprotocol (BELBTC) here we go againLet's see it again! I'm putting my patience to the test again and more than that :) And I'm betting on a performance similar to the previous ones. I think I'll see BEL at 0.00004500 again.

Bella Protocol (BEL) formed bullish Gartley upto 23.50% pumpHi dear friends, hope you are well and welcome to the new trade setup of Bella Protocol (BEL) with US Dollar pair.
On a 4-hr time frame, BEL has formed a bullish Gartley move for next price reversal.
Note: Above idea is for educational purpose only. It is advised to diversify and strictly follow the stop loss, and don't get stuck with trade

Bellaprotocol (BELBTC) reloadedAfter three in a row during a week (see the links below) I will reload here again. I am starting to reaccumulate BEL aiming another profit.
Kind regards.

Bell Break triangle resistance Bella protocol break triangle resistance now it will hit 0.528 easily

BEL will be the next SHIBThe consolidation continues but there can be an uptrend move in the next days/weeks.
The previous swing highs can be the next target. The yellow line can be the extended target.
The consolidation resembles SHIB's.
BELBTC pair could be included to follow-up lists.

Bella Protocol (BEL) formed bullish Gartley for upto 52.50% pumpHi friends, hope you are well and welcome to the new trade setup of Bella Protocol (BEL) with US Dollar pair.
On a daily time frame, BEL has formed a bullish Gartley pattern.
As per the above targets, this trade has a profit possibility of 52.50% , and a loss possibility 12%.
Note: Above idea is for educational purpose only. It is advised to diversify and strictly follow the stop loss, and don't get stuck with trade


BEL/USDT BUYING SETUP (SWING)Buying #BEL/USDT (SWING)
$BEL breakout falling wedge pattern 1h. in 1D timeframe Bel retesting after breakout resistance before. 4H time consolidation make a falling wedge pattern and then low volume when correction this is good movement
we can entry now or wait for retest first
Buy zone : 1.24 - 1.16 - 1.06
Target : 1.39 - 1.6 - 1.9036 - 2.2072 - 2.77 - 3.3
Stop : 0.98

Ciao, Bella! Here we go again | BELBTCBINANCE:BELBTC
After a 300% ride few days ago for BEL that meant for me a nice won trade (check the related idea below),
now I choose to go up again with this Bella.
By the same average stacking strategy, but this time with "free money", I'm aiming 0.000038 and even 0.000052.
Kind regards.

BEL Bella Protocol LONG TRADE 20220607Signal: Red -> Green, Context: Green
Structure Breakout
BEL, Bella Protocol, BELUSD, BELUSDT ,BELUSDTP, CRYPTO, CRYPTOCURRENCY
DISCLAIMER
This is only a personal opinion and does NOT serve as investing NOR trading advice.
Please make your own decisions and be responsible for your own investing and trading Activities.

BEL and the 26% pumpHello, dear TradingView members.
This idea is a BEL analysis.
Today BELUSDT made a 26% pump. Before we FOMO and buy or sell, let's see what possible scenarios.
RSI is also above 83, which shows overbought signals. Usually, when this happens, the price pulls back down.
Scenario one:
A breakout (Not likely to happen):
If that bullish candle closes above this area,
it can later perform a pullback and
make it a breakout confirmation.
Scenario two:
A fake-out:
The price might go even higher but then lose strength after hitting one or two resistance levels and fall back to the previous support area.
The Bollinger Bands are opening and making a wide channel, and the price is pushing higher than the upper band. Now, this mostly shows overbought signals, which aren't healthy. This might cause weakness in future hours.
The Speedometer indicator shows Buy volumes on the market for BEL on a 1D interval.
Let me know if you guys have any questions;
I will be more than happy to help.
Good luck, and thank you.

BITCOIN 4H TA: 2022-06-03 updateAs we can see in the chart, the static and dynamic support line has reached the trend, now if the line is broken, the process will continue, and otherwise we will increase the price up to the specified range.
Its not Buy or Sell SIGNAL
DYOR
BY : Mohamad Teriz - @AtonicShark

BELUSDT 1D TA : Pump again?According to the chart, after breaking the line, the trend is pumped and is pullback now. If the pullback is completed and the resistance range is broken, it can grow again, otherwise we will have correction.
Its not Buy or Sell SIGNAL
DYOR
BY : Mohamad Teriz - @AtonicShark

BELLA PROTOCOLBEL/USDT he will break support and i take short
ENTRY - 1.00
TP 1 - 0.900
TP 2 - 0.750
TP 3 - 0.600
SL - 1.200

BELUSDT (Bella Protocol) Daily tf Range Updated till 30-5-22BELUSDT (Bella Protocol) Daily timeframe range. breaking a alts last low never a good perk its comes with risk for future holders. but hey it got back up pretty strong over 400%+ from its recent low is no joke within not so long period of time. the range for swing setups are cool but we do need to keep the risk in mind as the more space within its level the higher risk it offers and profits, a sudden giant candle opens many doors of possibilities.
