Belusdt
BELUSDT is trying to have a breakout!I think it's a good idea to buy BEL after the breakout and test the resistance as the support. At this level, there is strong resistance, so you can short it if the price gets a rejection.

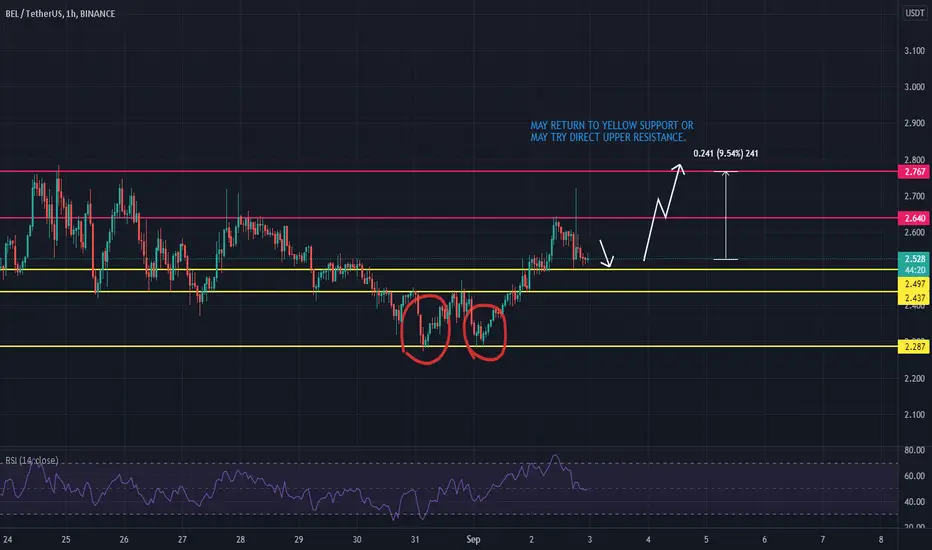
BelusdtThere is a consolidation under the 2.50 level , when the level is broken , fixed and retested, you should enter the position .
The takes are marked.
Stop for 2.28
Stop floating
Write comments ,what do you think about bel

BELUSDT BULLISH SIGNAL UPDATE!As you all know, BEL is not performing well from last 2 months and according to the Chart patterns, Ascending Channel is formed, Breakout formation and also indicators giving bullish signal.
Short term Trade, DYOR Before taking trade, as i'm not responsible for your loss.
RISK FACTORS:
Market/ BTC CRASH
Happy Trading :)
Good Luck!
If you like my idea, please support:
Binance Smart Chain ( BSC ): 0x69Ea86D0f6B762fC36A322b0C833D2bd04534b3d
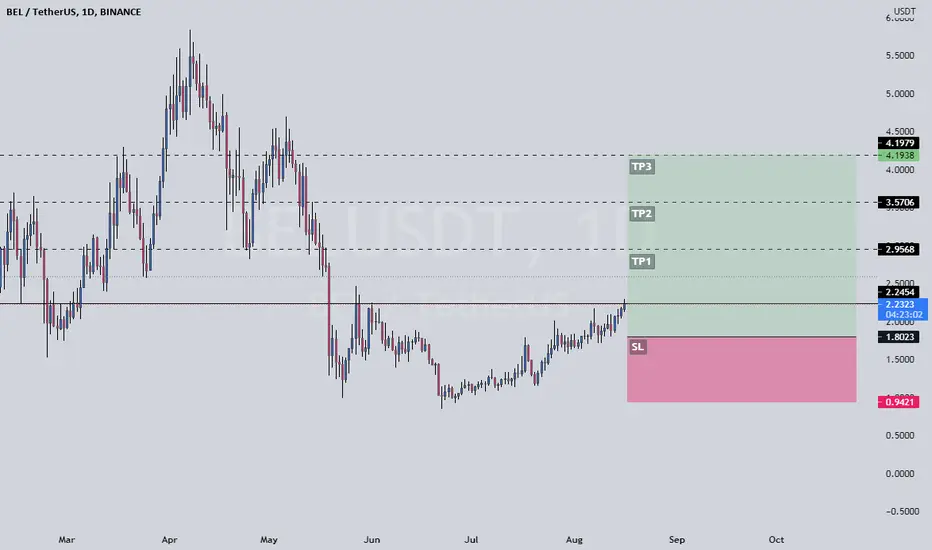
BELUSDT { BELLA PROTOCOL } - BULLISH SETUPANALYSIS 🔎
- BELUSDT hit a swing high and retraced.
- Price retested the all-time low support.
- There was a relatively high concentration of buyers at that zone.
- The downtrend was resisted by the descending trendline resistance.
- Price brokeout above the descending trendline resistance.
- This is a bullish signal.
BUY ENTRY ⬆️
- Market entry: current market price.
- Stop limit entry: breakout above the horizontal resistance level (@2.47).
- Limit entry: possible retest.
TARGETS 🎯
- Horizontal resistance level (@4 7).
- Horizontal resistance level (@5.8473).
SETUP INVALIDATION ❌
- Breakdown below the horizontal support level (@0.6006).

BEL/USDT signals, The wave is coming, hungry up!!!I saw 2 great signals for a bullish cycle of BZX protocol (BZRX/USDT) and BELLA protocol (BEL/USDT).
- RSI breakout signal bearish trend and Filbo timezone on both coins.
- MACD is breaking up
- If the price to $0.75 is the bottom of the previous accumulation, everyone will buy a lot so I think it's impossible. We can buy at $1 - $1.2 which is great.
- The filbo timezone i draw is correctly time is 90%, so for the number 3, please find the good buy yourself!
- BTC weekly candlestick RSI will also break this decline if current prices hold.
-The last drop below 30k was a beautiful bearrap
- Other coins are also showing positive signs as good news has hit the market
- I don't think BTC will go to $25k or $20k because then this game won't be difficult anymore, the big hands can't buy it at that level so they have accumulated a lot of BTC in the $30k area
- Fear & Greed index score from 10 last week and this week is 32, showing that a lot of people are no longer afraid but are turning to greed, this is a great thing to create 1 long growth wave.
Note: You can see more Fibo of BZRX/USDT in my profile.
Anything that doesn't make sense, please give me a comment. Please motivate me to develop myself and help someone needed.
Don't forget click like, it's a hug for me. Thank you!


BEL Bearish Candle Under Resistance !BEL is under the resistance and has printed bearish candle ( hanging man ). Expecting retracement toward the 1.20$ level. Stop can be set above the EMA60 and the static resistance ( >1.35$ ) .

BEL is going to reach this zone. Will there be a correction? 😧Bitcoin is still moving in a downward pattern, updating its lows and highs while in a prolonged consolidation. Not showing any particular strength for growth lately.
At the same time, some altcoins are showing a very different picture. For example, Bel is moving in an uptrend pattern, locally updating its lows and highs.
Bel has a strong resistance range ahead, marked as a massive value area on the chart. Most likely, the price will react to it and correct to the lower marked area!
Write in the comments all your questions and instruments analysis of which you want to see.
Friends, push the like button, write a comment, and share with your mates - that would be the best THANK YOU.
P.S. I personally will open entry if the price will show it according to my strategy.
Always make your analysis before a trade


BEL > False Breakout, New Trendline > Next move? (UPDATE)Hello Friends,
Hope you all are having a thrill in your trading journey.
I am presenting you my analysis of BEL.
My previous analysis on BEL was not successful. Unfortunately, I think it was a false retest.
According to my new technical analysis, BEL will again go up as it is following a strict trendline.
I hope my analysis is pretty clear to you guys.
Kindly do your own research and follow proper risk management.
Feel free to share your views in the comment section. Like and Follow!
Best Regards,
Shaswat Naman
TradeThrill, India🇮🇳
Disclaimer: The analysis provided is purely informative and it should not be used as financial advice. Remember that you need a plan before you start trading; so, take this knowledge and use it as a guidebook that will ultimately help you understand the market and easily predict your next move.

WTCUSDT, XLMUSDT , BELUSDT , CAKEUSDT All Might Go Up
Welcome back Traders, Investors, and Community!
Hi Traders, WTCUSDT on H4 has formed a large Green candle right below the Resistance, if we get a breakout above the Resistance, after the retest there is high chance of for continuation to 0.91 and 1.17
XLMUSDT on H4 seems that it has gotten the last Rejection from the Support line of the channel and despite of having multiple rejections from the Resistance line of the channel the bears don’t have enough power to pull the price lower. If the breakout happens there is high chance that the price goes up to 0.340
BELUSDT on H4 has been making HHs and HLs, if we get a breakout above the Resistance there would be chance that the price goes high up to 1.39
CAKEUSDT on H4 has been making HHs and HLs, we have a breakout above the Resistance there is high chance that the price goes high up to 14.90
We will have more FREE forecasts in TradingView soon
❤️ Your Support is really appreciated!❤️
Have a Profitable Day

BELUSDT (4H CHART) - Double BottomBELUSDT (4H CHART) Technical Analysis Update
BELUSDT (4H CHART) currently trading at $1.188
Buy level: Above $1.187
Stop loss: Below $0.965
Target 1: $1.305
Target 2: $1.455
Target 3: $1.630
Max Leverage: 3X
ALWAYS KEEP STOP LOSS...
Follow Our Tradingview Account for More Technical Analysis Updates, | Like, Share and Comment Your thoughts.


BEL Long Trade 20210613
Signals: Blue -> Green
DISCLAIMER
This is only a personal opinion and does NOT serve as investing NOR trading advice.
Please make your own decisions and be responsible for your own investing and trading Activities.


Bella Protocol Buy short termThe Bella token (BELUSDT) will break out from top it's downtrend soon. This is a great opportunity to make a profit in the short term.
Target 1: Previous ATH range (5.5 - 6 $)
Target 2: Top of the channel
Do not forget the SL


BELUSDT Long Signal BEL is ready to get into discovery mode. The retest of previous support was healthy before breaking away further.
Meanwhile all Alts are looking at ETH’s next move to follow. Fundamentally ETH is distant to spike up as next month holds good news for ETH.
Blue line = entry zone
Green lines = exit targets
Do you agree? If not, feel fee to share your thoughts in the comments below.
