BERGER PAINTS Clean BreakoutThe idea here is about TECH MAHINDRA
Mentioned below are the points to be considered
Points as per TA on a Weekly Chart:
1. Crab Pattern Completed on a weekly chart.
2. Break out of Downtrend channel with good Volume.
3.Trading way above 20 EMA on weekly chart.
4. MACD over Signal line on weekly chart .
5. RSI is at 56.80 on a weekly Chart.
6. May retest the break out point and wait for reconfirmation to enter.
7. Hull Moving Average is a Buy Signal on a weekly chart.
Targets : Estimates based on Crab pattern provided on the chart for reference.
Disclaimer: “The above is an idea only and not any kind of financial advice. So please do your own DD (Due Diligence) before any kind of investment”.
Do you like my TA & ideas!! Want to keep yourself updated with current market action, then please follow my profile for more analysis.
Cheers.
Bergerpaints

BERGER PAINTS IND Clean Brakeout The idea here is about BERGER PAINTS
Mentioned below are the points to be considered
Points as per TA on a Weekly Chart:
1. Crab Pattern Completed on a weekly chart.
2. Elliott's Wave Corrective wave completed and price has broken out of Downtrend channel with good Volume .
3. Trading way above 20 EMA on weekly chart.
4. MACD over Signal line on weekly chart .
5. RSI is at 56.80 on a weekly Chart.
6. May retest the break out point and wait for reconfirmation to enter.
7. Hull Moving Average is a Buy Signal on a weekly chart.
Targets : Estimates based on Crab pattern provided on the chart for reference.
Disclaimer: “The above is an idea only and not any kind of financial advice. So please do your own DD (Due Diligence) before any kind of investment”.
Do you like my TA & ideas!! Want to keep yourself updated with current market action, then please follow my profile for more analysis.
Cheers.

Will nifty able to sustain its upmove ??Nifty as making Higher High & Higher low but as we see on larger time frame selling pressure is still there. There are two possibilities whether nifty breakes it's supply zone then on retracement its a good BUY and in second possibility nifty will not be able to handle selling pressure and fall in that case we wear the HAT of SELLER. Here keep in mind that nothing gets changed till yet. Month of July & August is earning season so be stock specific. I have made position in Bergerpaint this Friday in Future August series.


BURGER/USDT: READY TO PUMP!Hi guys, This is CryptoMojo, One of the most active trading view authors and fastest-growing communities.
Do consider following me for the latest updates and Long /Short calls on almost every exchange.
I post short mid and long-term trade setups too.
Let’s get to the chart!
I have tried my best to bring the best possible outcome in this chart, Do not consider it as financial advice.
Welcome to this BURGER/USDT TRADE setup. BURGER looks bullish here.
WHY DOES BURGER HAVE BIG POTENTIAL?
1) BURGER is breaking out from the big falling wedge-like structure.
2) It breaks out almost after 1 year.
3) Its ATH was $28 and currently, it is trading around $1.8
4) It also trades above the important 50D moving average.
It's a low risk and high reward trade setup. Buy some now and add more in dips.
Entry range:- $1.6-$1.8
Target:- 450%
SL:- $1.42
This chart is likely to help you in making better trade decisions if it did do consider upvoting this chart.
Would also love to know your charts and views in the comment section.
Thank you

Price not holding support? what to do? hindi last ek month se kisi bhi indices ne good perform nhi kiya hai. kaafi saare shares apne support ko bhi hold nhi kr paa rhe hai. for more info watch the video.


High probablity of resistance breakout in Berger PaintsThere are multiple touches on resistance zone. Last 3 candles shows very high volume bullishness. It is more likely that price will break throuh the resistance.


Berger Paints ReversalThe stock has reached lower trendline and may undergo a reversal rally. Trade is supported by brokerage calls and Supports Nearby.
Risk Reward Ratio - 2:1
SL is placed below support zone & the lower trendline. The target is placed near swing high.

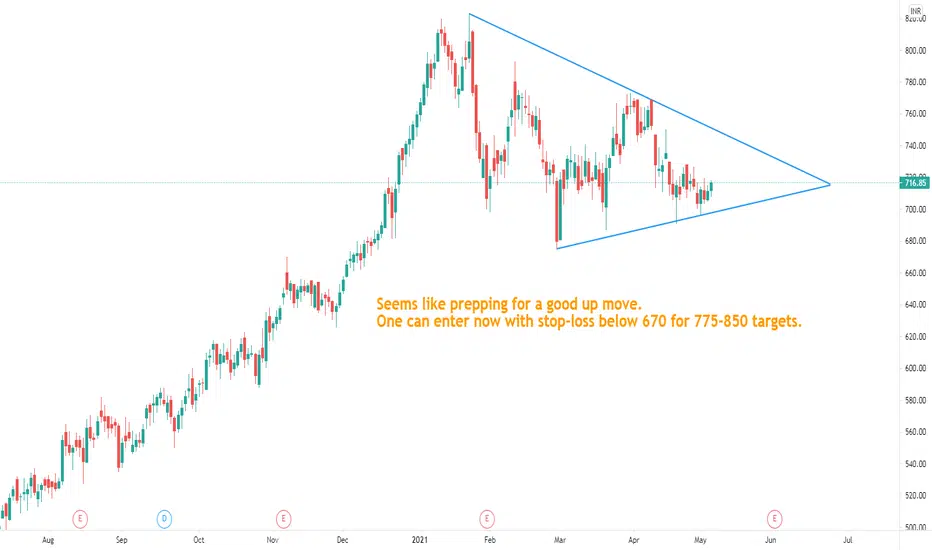
Berger Paints | ChaiwithanoopBerger paints strong buying pressure no wicks in 4h on last closing. can trade either side.
Simple structure of Rally base and now rally / drop expected.
Check larger time frame for structure.
Go for Long with a SL Below 820.

Berger Paints Short Term BreakoutThe stock has broken out and took support at the previously upper trendline. Trade is supported by brokerage calls, 200 EMA , and Supports Nearby.
The stock has previously broken out with good volumes and retested the upper trendline, the point of entry.
Risk Reward Ratio - 1:1.
SL is placed below multiple major support zones, 200 EMA , and previously upper & lower Trendlines . Target is placed near the all-time high based on fundamentals.
Note: Earnings will be disclosed during the trade duration. If results are not up to expectations or the trendline and 200 EMA are broken after results, it may be a better option to exit.

BERGER PAINTS READY FOR UPSIDEBERGER PAINTS READY FOR UPSIDE
THERE IS PRICE AND RSI IMPORTANT LEVELS
IF BOTH GOES ABOVE LEVELS THERE WILL BE GOOD UPSIDE

Berger Paints.......Facing resistance at 832-833 levels...........
have to break above 833 for further upmove....
Levels marked
Happy trading

BERGERPAINT Analysis- More Than 5% Done More To ComeI have Given buy call in BERGERPAINT More Than 5.3% Done. More targets coming in way. See chart for more details.
See the given call given on May 13 2021 in the related ideas below

Berger Paints breakoutBerger Paints
1 hr chart
Inverted HNS
Crossed 200 ma which was acting resistance several times
Buy wsl candle closing below 200 ma or 725
Daily chart
Double bottom
Tested demand zone 19 Mar 21
Breakout from a resistance


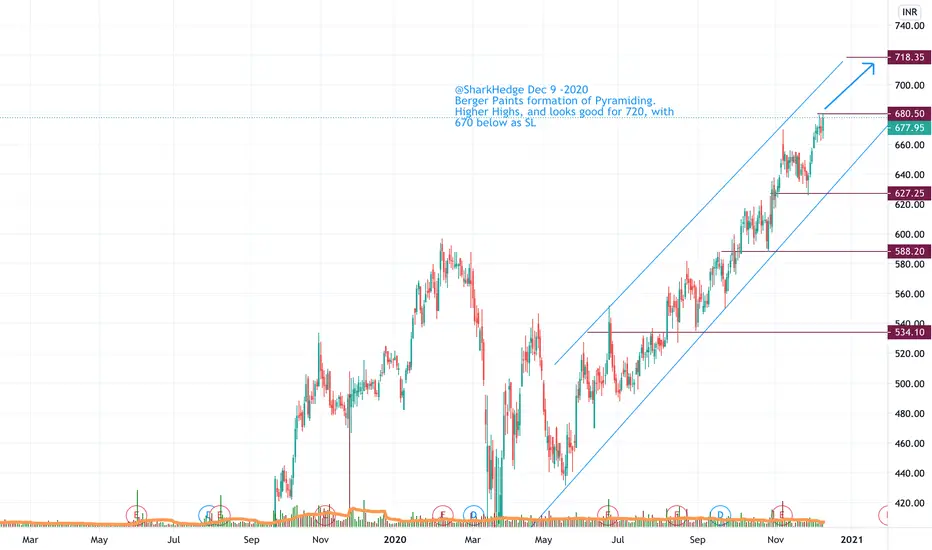
LONG TERM SETUP FOR BERGER PAINTLONG TERM SETUP FOR BERGER PAINTLONG TERM SETUP FOR BERGER PAINTLONG TERM SETUP FOR BERGER PAINTLONG TERM SETUP FOR BERGER PAINTLONG TERM SETUP FOR BERGER PAINTLONG TERM SETUP FOR BERGER PAINTLONG TERM SETUP FOR BERGER PAINTLONG TERM SETUP FOR BERGER PAINTLONG TERM SETUP FOR BERGER PAINTLONG TERM SETUP FOR BERGER PAINT


R-0211 Short Term Buy BERGEPAINT @578.00-580 SL 563.6 TGT 605Short Term Cash Buy BERGEPAINT @578.00-580 SL 563.6 TGT 605(Short term trend remains positive)
1. Above VWAP on 30 min chart.
2. TK cross over.
3. MACD cross over.
4. Broke R1 573 now heading toward R2 609.5 GO LONG
