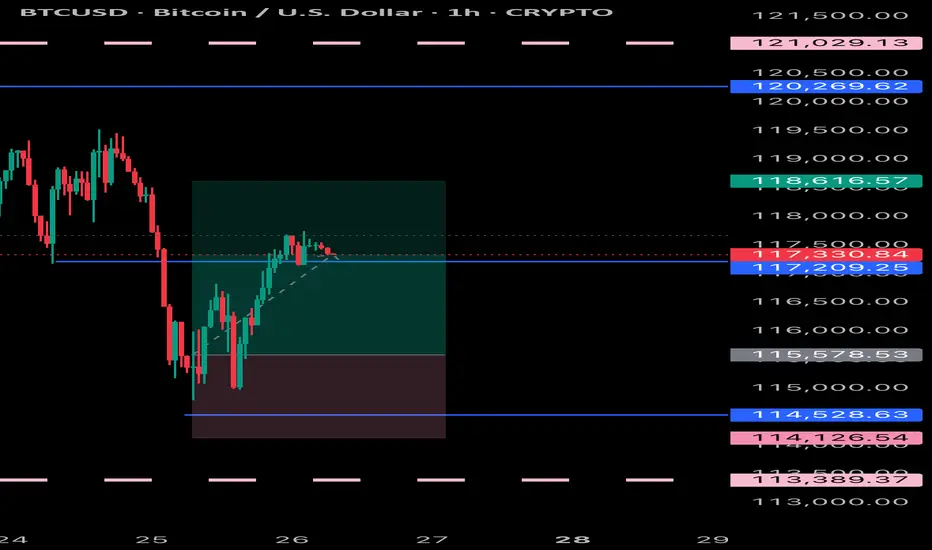
BTCUSD UPDATE Bitcoin has gone up and now I will close partial profits and secure what I have or even swing again to the up side
Bestsignals


GOLD BUY Gold will be buying soon and keep respecting it’s patterns so , I will keep the trading simple and straightforward


SUPER BUY GOLD XAUUSD Gold has ripped all levels of take profit and has gone up and gave us a small amount of drawdown with huge gains in return, simple trading price action and (M&Ws)

BITCOIN RESULTS Bitcoin has respected the analysis and held very well it’s been following the trend and can partial close some positions and wait for a nice pullback to buy the dip
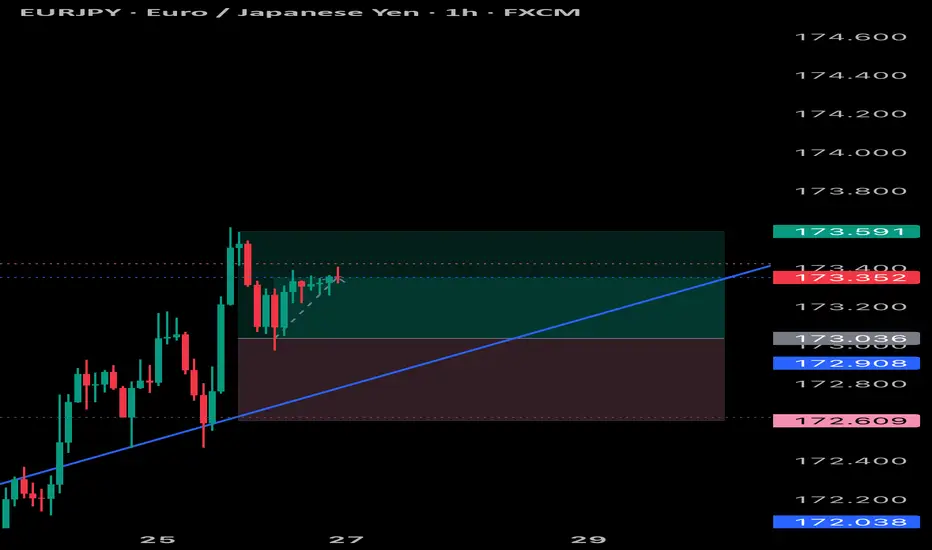
EURJPY LOOKING GOOD Eurjpy has been behaving as expected and can continue to the up side and complete its pattern
Jindal stainless ltdJindal Stainless Ltd has been forming higher lows and has now broken through the key resistance level at 660. With this congestion breakout, the stock signals a continued bullish move, potentially heading towards the target of 740.
Please conduct your own technical analysis and apply proper risk management before taking any trade. This is solely my personal view.
#jsl #bestbreakout #uptrend #longteam

ALERT: ALT SEASON INCOMING? 🚨 ALERT: ALT SEASON INCOMING? 🚨
Take a close look at the BTC/ETH chart — we’re seeing early signs of a major rotation out of Bitcoin and into Ethereum and altcoins. Historically, when the BTC/ETH ratio starts to fall, it's a clear signal that capital is flowing into altcoins, marking the beginning of alt season.
🔍 The ratio is showing bearish divergence and approaching a key support zone. If this level breaks, ETH is likely to outperform BTC significantly — and we all know what follows: altcoins explode.
📉 BTC dominance is stalling, ETH gaining strength, and altcoins are waking up. The market is shifting. Don't get caught late.
🚀 Get ready. The alt season might just be starting now.
#AltSeason #Crypto #BTC #ETH #TradingView #CryptoTrends

For Educational purpose only.The primary objective of the trading strategy is to generate consistent returns while managing risk effectively. Define whether you are trading for short-term profits, long-term growth, or a combination of both.

NFP LIQUIDITY GRAB COMING Key Price Levels:
Level Price Importance
PWH (Previous Weekly High) 2,960.000 Strong resistance
PDH (Previous Day High) 2,930.000 Key liquidity level
Equilibrium 2,910.000 Fair value region
PDL (Previous Day Low) 2,890.000 Possible buy-side liquidity
PWL (Previous Weekly Low) 2,840.000 Strong demand zone
Discount Zone 2,850 - 2,830 High-probability buy area
3. Trading Plan:
🔵 Long (Buy) Plan:
Entry Criteria: Wait for a reaction at PDL (2,890.000) or discount zone (2,850 - 2,830). If a bullish BOS or ChOCH forms, enter long.
Confirmations: Bullish engulfing, strong rejection wick, demand zone reaction.
Target (TP1): Equilibrium at 2,910.000
Target (TP2): PDH at 2,930.000
Stop Loss: Below PWL (2,840.000)
Risk-to-Reward: Minimum 1:3
🔴 Short (Sell) Plan:
Entry Criteria: If price reaches PDH (2,930.000) or PWH (2,960.000) and forms a bearish rejection (e.g., double top, BOS).
Confirmations: Bearish engulfing, BOS, liquidity grab.
Target (TP1): Equilibrium at 2,910.000
Target (TP2): PDL at 2,890.000
Stop Loss: Above PWH (2,960.000)
Risk-to-Reward: Minimum 1:3
4. Neutral Zone (No Trade)
If price remains between 2,910.000 - 2,930.000 without a clear BOS or liquidity grab, it’s a consolidation zone. Avoid trading in chop.

XAUUSD BEFORE & AFTER READ IN CAPTION XAUUSD (Gold)* with key levels marked for potential trades. The price has recently touched the *support zone* around *2,867.378*, which could offer a buying opportunity. The *resistance* is at *2,920.364*, and the *retest area* is highlighted, suggesting a potential move up if the price bounces from the support. Watch for price action near the *support* for entry and target the *resistance* for potential gains

GOLD UPCOMING TREND READ IN CAPTIONThis 4-hour chart of Gold (XAU/USD) shows a recent pullback from the resistance level at 2,920.364, with a key support zone around2,847.153, highlighted as a buy zone. Fibonacci retracement levels are also shown, with the price currently testing the 0.382 level at 2,871.969. The chart suggests a potential retest in the area between2,887.470 and $2,890.000 before a possible bounce toward higher resistance levels. The breakout above the recent high could lead to further gains, but a pullback toward support levels is expected first

A great uptrend is upcoming!!!Hi everyone!
A great uptrend on Venice token is upcoming at the next months maybe weeks...
Trading volume start raising, interest getting higher, on Venice token will be a lot of attention soon!
That's why we are here to grab the opportunities before they even happen!
Of course some of you will have your doubts which we totally understand! But instead of doubting why you don't try our ideas with very little capital (0.50usdt) in order to test our strategy? Nothing to lose.
While the main chart shows lot's of bearish signals our experts sees gem and dollars..
All the plan is given to you for free..
Try it and thank us later!
Stay tuned for more

Gold strong up next level in this captionsThis 4-hour chart of Gold (XAU/USD) shows a strong bullish trend within an ascending channel. The price has recently broken out, approaching the 2,930.972 target. Key Fibonacci levels suggest continued upward momentum, with the next resistance around2,933.719. Support is located near $2,880.671. The chart indicates that Gold is in a breakout phase, and the next potential move could push the price towards higher levels if the trend remains intact.

Ethereum its going down soon Ethereum (ETH/USD) on a daily timeframe, illustrating a descending channel from November 2024. The price is currently around 2,634, within a key support zone. Several Fibonacci levels are highlighted, suggesting potential areas of interest, with the2,149.90 level being a critical support. The chart also includes an order block (OB) at higher levels around $3,400, which may act as resistance if the price retraces. A possible retest is expected before a move toward lower support levels.

USOIL it will go down and then up the price movement of WTI Crude Oil (USOIL) on a daily timeframe. It highlights a range between approximately 66.70 and75.21, suggesting potential price targets. The market is currently trading near the 71.41 level, within this range. A breakout above75.21 could indicate a bullish trend, while a drop below $66.70 might signal a bearish move. The chart suggests a period of consolidation with possible directional movements in the near future.

BTC/USD trend upward soon Bitcoin (BTC/USD) in an upward channel, with the price currently at 96,904.63. Key levels to watch:
- Support Zone: The strong support is around 91,334.05, where a potential buy opportunity could emerge.
- Retest Area: The price may also retest the 100,941.20 level before pushing higher.
If the price holds above the support, Bitcoin could rise back towards the 107,669.49 resistance.

Japan225 Daily Short: Targeting Downside After 0.7 Fib Retraceme This trade is based on the daily chart of Japan225, where the price has recently retraced to the 0.7 Fibonacci level, presenting a potential opportunity for a downside move. The current market structure indicates a possible reversal from the recent highs, with a key resistance area marked by the red zone on the chart.
Key Levels:
• Entry: The trade is entered near the 0.7 Fib retracement level, capitalizing on the potential for a pullback.
• Target: The target is set at the lower green zone, aligning with a previous support level where buyers may re-enter the market.
• Stop-Loss: A stop-loss is placed above the recent high, as indicated by the upper red zone, to manage risk if the price continues to climb.
Rationale:
The Japan225 has shown a significant retracement up to the 0.7 Fibonacci level, which often acts as a strong resistance area. The daily timeframe provides a broader perspective, suggesting that the price may now face downward pressure. This setup seeks to capitalize on the expected reversal, aiming for a move lower in the upcoming sessions.
Risk Management:
With a clearly defined stop-loss and a favorable risk-to-reward ratio, this trade minimizes risk while allowing for substantial downside potential. As always, adjustments will be made based on market behavior.
Note: Please remember to adjust this trade idea according to your individual trading conditions, including position size, broker-specific price variations, and any relevant external factors. Every trader’s situation is unique, so it’s crucial to tailor your approach to your own risk tolerance and market environment.

Ready for Breakout, Sugar Stocks in Action...NSE:RENUKA trade at 50. Support at 44. Resistance at 53
Stocks trade in a triangle range since last 1 year, you can watch for next resistance after breakout 75-80 level.

GER30GER30 has been going up for a while now, I am interested seeing it drop, but before it drops, I will be happy to see a small retracement up, thats where we will be executing trades, sniper entry or nothing, Lets Download Succes s

Indicator Paper Trade Battle! Noro's Triple RSI vs. Project XIndicator Paper Trade Battle: Noro's Triple RSI Vs. Project X 📈💥
In this exciting video, we’re putting two powerful trading indicators head-to-head in a paper trade battle: Noro's Triple RSI vs. Project X. Watch as we analyze and compare their performance to determine which one comes out on top!
We’ll cover:
-Detailed breakdown of Noro's Triple RSI and Project X indicators
-Step-by-step analysis of paper trades using each indicator
-Real-time comparisons and insights on their effectiveness
-Key takeaways to help you decide which indicator to incorporate into your trading strategy
Join me for this thrilling showdown and see which indicator proves to be the best for capturing profitable trades. Don't forget to like, comment, and subscribe for more trading battles and expert analysis. Let's find the ultimate indicator together! 🚀📊 And remember to hit the Boost Button on this video to support our Trading View community!

Keys to the Kingdom: How to Become a Badass TraderReady to unlock the secrets of badass trading? In this video, I'm sharing the ultimate guide to becoming a successful and confident trader. Whether you're a beginner or a seasoned pro, these tips and strategies will elevate your trading game to new heights.
We'll cover:
Mastering technical analysis and reading market trends
Developing a solid trading plan and sticking to it
Managing risk like a pro to protect your capital
Recognizing key opportunities for maximum gains
Building the right mindset for trading success
Join me as I reveal the keys to the kingdom and transform you into a badass trader. Don't forget to like, comment, and subscribe for more powerful trading insights and strategies. Let's dominate the markets together! 🚀💹
