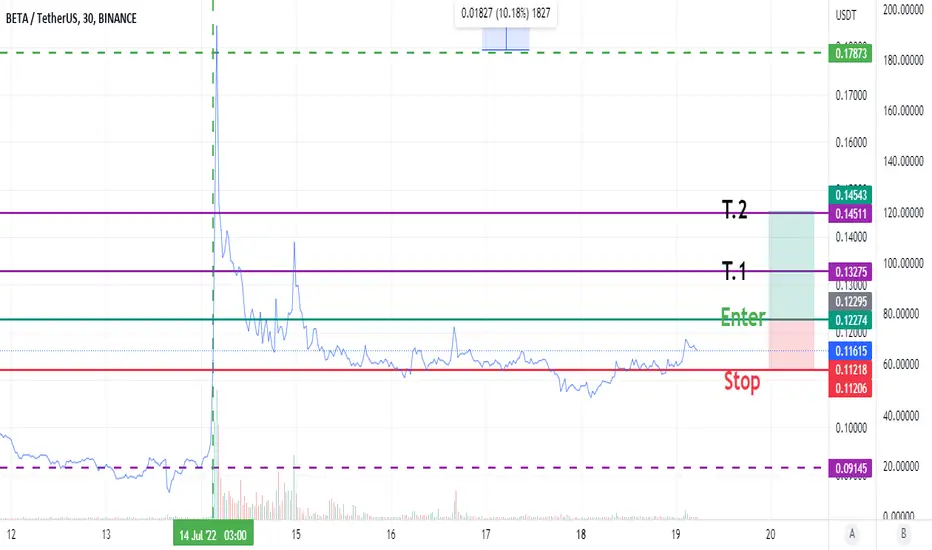
BETAUSDT Breakout!BETAUSDT Technical analysis update:
Buy zone: Below $0.117
Stop loss : $0.0940
Take profit 1 : $0.131
Take Profit 2 : $0.153
Take Profit 3 : $0.190
Take Profit 4 : $0.235
Spot trade
Always keep stop loss
Thanks
Hexa
Beta

$BETA/#BTC [#Beta Finance]: Super_TrendWe've detected a Super Trend pattern on the $BETA/$BTC chart. The Super Trend indicator is showing a bearish trend, indicating a potential trend reversal. We may consider entering at this levele and benefit from the trend continuation.

Beta Finance (BETA) forming bullish Gartley for upto 11% pumpHi dear friends, hope you are well and welcome to the new trade setup of Beta Finance (BETA) token with US Dollar pair.
Our last successful trade setup of Beta was below:
Now on a 2hr time frame, BETA is about to complete a bullish Gartley pattern.
Note: Above idea is for educational purpose only. It is advised to diversify and strictly follow the stop loss, and don't get stuck with trade

What can A.I. powered trading system do to generate alpha?No wonder trading is hard! I have been watching and learning how to trade the futures for the last couple of years and it’s been a remarkable learning curve for me! The dramatically changing market conditions and extreme volatility can make newbies like me get caught up in emotions and left looking for help.
I recently came across a very interesting website that publish their proprietary AI-based trading strategies every morning along with the results these models generated during that trading day. Interestingly, their trading system’s return has been more than double over the last 4 years, while the system’s beta has been ZERO! Does this prove the robustness and fundamental strength of AI-powered trading systems?
Would love to know what other traders think. Feel free to comment.

Beta Finance (BETA) formed bullish Gartley for upto 76% rallyHi dear friends, hope you are well and welcome to the new trade setup of Beta Finance (BETA) token with US Dollar pair.
Previously we had a nice trade of BETA:
On a 4-hr time frame, BETA has formed a bullish Gartley pattern.
Note: Above idea is for educational purpose only. It is advised to diversify and strictly follow the stop loss, and don't get stuck with trade

Beta Finance (BETA) forming bullish Gartley for upto 17.50% pumpHi dear friends, hope you are well and welcome to the new trade setup of Beta Finance (BETA) token with US Dollar pair.
Previously we caught a nice pump of BETA:
Now on a 4-hr time frame, BETA is about to complete the final leg of a bullish Gartley move.
Note: Above idea is for educational purpose only. It is advised to diversify and strictly follow the stop loss, and don't get stuck with trade

BETAUSDTRecently brreaks trendline in daily tf
now bulish flag breakout confirmed too expecting massive bulish rally

Beta Vs USDT4H Chart formed a possible buy position. after +25.4% spike on 14 July I am more confident that we might have greater upcoming pump.
Note: Please take action based on your personal analysis.

How I Became an Anti-Beta GigachadHigh beta stocks are terrible in a recession. This fund has no direct market exposure, but takes an aggressive position against high beta stocks. It will rise in recessionary conditions.

Beta Finance (BETA) formed bullish Gartley for upto 94% pumpHi dear friends, hope you are well and welcome to the new trade setup of Beta Finance (BETA) token.
Previously we had a nice short-term trade of Beta:
Now on a 4-hr time frame, Beta has formed a bullish Gartley pattern:
Note: Above idea is for educational purpose only. It is advised to diversify and strictly follow the stop loss, and don't get stuck with trade

BETA/USDTbeta is in good condition and has formed an inverted head and shoulder pattern. I think it can see the following goals very soon:
TP1:0.55$
TP2:0.65$
TP3:0.73$

🆓Beta Finance (BETA) Apr-05 #BETA $BETA
BETA is retesting the $0.5 zone and this is an opportunity for us to buy and wait for a new strong rally to the $0.6 and $0.8 zone.
📈RED PLAN
♻️Condition : If 1-Day closes ABOVE 0.5$ zone
🔴Buy : 0.5
🔴Sell : 0.6 - 0.7 - 0.8
📉BLUE PLAN
♻️Condition : If 1-Day closes BELOW 0.5$ zone
🔵Sell : 0.5
🔵Buy : 0.44 - 0.38
❓Details
📈Red Arrow : Main Direction as RED PLAN
📉Blue Arrow : Back-Up Direction as BLUE PLAN
🟩Green zone : Support zone as BUY section
🟥Red zone : Resistance zone as SELL section


🆓Beta Finance (BETA) Mar-28 #BETA $BETA
BETA broke out of the $0.44 zone within a Symmetrical Triangle pattern and it is moving towards the $0.52 and $0.6 zones. $0.6 zone is still quite worrisome for BETA so we will need to watch more when BETA approaches this zone
📈RED PLAN
♻️Condition : If 1-Day closes ABOVE 0.44$ zone
🔴Buy : 0.44
🔴Sell : 0.52 - 0.6
📉BLUE PLAN
♻️Condition : If 1-Day closes BELOW 0.44$ zone
🔵Sell : 0.44
🔵Buy : 0.38 - 0.32
❓Details
📈Red Arrow : Main Direction as RED PLAN
📉Blue Arrow : Back-Up Direction as BLUE PLAN
🟩Green zone : Support zone as BUY section
🟥Red zone : Resistance zone as SELL section

NASDAQ 100: Read the descriptionNasdaq 100 bounced back from the lows of 12950 and had trouble with staying under the 13000 level.
Put call ratio for the market (PCC) have been falling, which indicates more calls are bought than puts. Looking at the past levels of the ratio it seems likely that the ratio is ready for mean reverting at this point. However put/call for equities (PCPS) are high, and could also be ready for a move lower while the general market put/call moves higher. Notice that the last weeks increase have not caused the put/call for equities to rise as much as previous when prices of nasdaq increased. this could again indicate that investors are less desire loading calls.
Inflation expectations are still high (RINF), and FED indicated 6 more rate hikes to an expected federal funds rate of 1.9% end of year.
VXX have been falling as a result of the increased price in stocks. But we could still see higher levels of VXX on the basis of increasing interest rates, high inflation and lower P/E ratios.
High inflation (USIRYY) results in lower levels of consumer and business spending which lead to declining sales higher costs and therefore lower earnings. And a combination of high interest rates and high inflation leads to lower P/E ratio
US03MY is also on the rise, and beta values for the 10 largest components of Nasdaq is over 1, which means in bear market, those stocks tend to fall more than the market. High risk free rate (US03MY) and high beta values will increase the CAPM cost of equity which again supports a price reduction in equities.
The strategy is the same as before. Short every move higher (when in bear markets, the sudden and unexplainable and dramatic increase in stocks are brutal -this will shake retail out of their positions shorts and longs before moving lower. I still anticipate a move lower for 12000 level as the first low level. (I could be wrong for the move lower, but managing the right leverage will keep one from blowing up account or generating too much drawdown.)
Everyone have FOMO right now of missing the bottom. Which is what the big guys want retail to have.
Again i dont say that there are no bottom, we could have bottomed out, but when looking at all the indications I am convinced that we still can see lower price levels this year.

BTC, ETH, ADA, GOLDComparison of crypto currencies to gold.
The buying and selling decisions depicted in this chart suggest that gold is still considered a flight to safety.
BTC will once again have to become the centre of public and policy maker's thoughts in order for it to reverse.
** Do note that the assets depicted are on separate scales (ie high beta in crypto compared to gold = greater percentage price moves).

Beta Finance (BETA) formed bullish Gartley for upto 32% pumpHi dear friends, hope you are well and welcome to the new trade setup of Beta Finance (BETA) token.
Previously we had a nice short trade of BETA:
Now on a 4-hr time frame BETA has formed bullish Gartley pattern:

BETA/USDT made a breakoutHELLO FRIENDS, here we can see BETA/USDT in 2 hours time frame and we can see it's moving in parallel trend pattern . Now it made a breakout out and making a retest. If it makes a perfect retest take a long position and if not holds go for short.. FOLLOW FOR MORE.

BETA/USDTBeta/usdt is at critical trendline resistance. If the momentum continues, the price will break above targeting 0.555 and 0.71. Failure to break the trendline will drag the price back towards 0.39.

🆓Beta Finance (BETA) Feb-17 #BETA $BETA
BETA is being rejected at the $0.6 zone and it is correcting towards the $0.50 zone, which is the zone that created a bear trap 4 hours ago. So the buying force at this zone is still quite good so we can consider buying. If this support does not hold, it will continue to fall to the $0.4 or even $0.3 zone
📈RED PLAN
♻️Condition : If 1-Day closes ABOVE 0.5$ zone
🔴Buy : 0.5
🔴Sell : 0.6 - 0.7 - 0.8
📉BLUE PLAN
♻️Condition : If 1-Day closes BELOW 0.5$ zone
🔵Sell : 0.5
🔵Buy : 0.4 - 0.3
❓Details
🚫Stoploss for Long : 10%
🚫Stoploss for Short : 5%
📈Red Arrow : Main Direction as RED PLAN
📉Blue Arrow : Back-Up Direction as BLUE PLAN
🟩Green zone : Support zone as BUY section
🟥Red zone : Resistance zone as SELL section

Beta Finance vs Tether Goes Bullish (395% Potential)Beta Finance vs Tether (BETAUSDT) is looking better than BETABTC.
The charts are basically the same but as you can see from my targets this pair has higher potential for profits.
Let's read the chart now.
We can see a very strong downtrend until Jan. 24.
Right before this date we had a challenge of EMA50 on high volume, followed by a rejection and then another try at resistance.
Currently, BETAUSDT is challenging EMA50 with a volume breakout and bullish indicators.
We are aiming UP!
Note: If prices drop below support, the last low/bottom price of blue rectangle, this analysis is invalidated.
Wishing you great profits & trade success in the week ahead.
Thank you for reading.
Namaste.

Beta Finance High Volume Confirms Bullish Breakout 135% Potent.Let us look at Beta Finance vs Bitcoin (BETABTC) together as some reversal/bullish signals are starting to develop.
First, notice the light blue space on the chart...
This is our support zone.
Once BETABTC reached this support zone in mid-January, prices jumped and challenged EMA50 as resistance, a complete rejection followed.
Next, late January our support zone was tested again and after a brief break below it, 11-12 Feb., we see prices moving back up.
We have high volume, a bullish RSI and the MACD shows plenty of room available for growth.
We are aiming high next.
135% potential profits on the next jump.
The blue rectangle should work as support/stop-loss in the case prices drop.
This is not financial advice.
Thanks a lot for the support.
Namaste.
