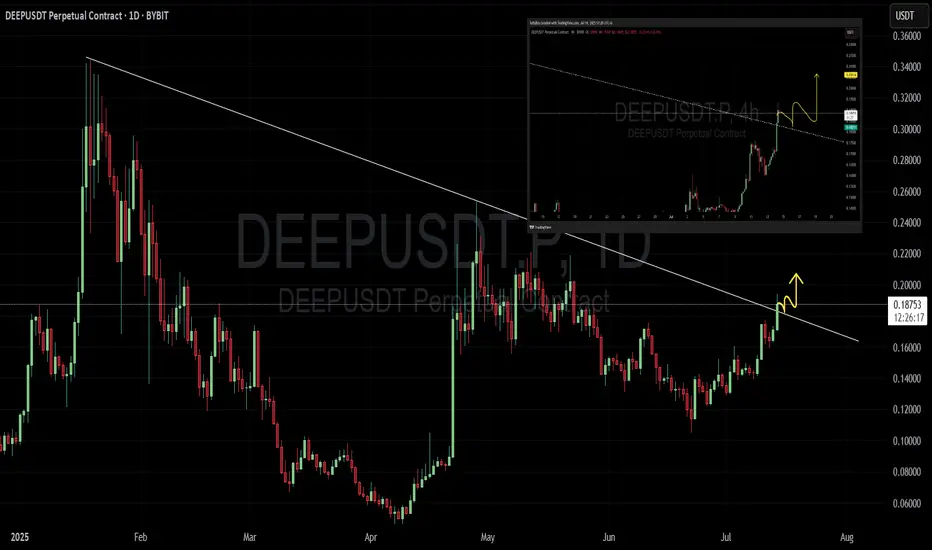
DEEP !! how deep will you retrace ?🚨 DEEPUSDT BREAKOUT ALERT 🚨
🔥 Price has broken the long-term downtrend on the 1D chart
🟢 Retesting the trendline near 0.182
📈 If it holds — we may see a strong pump ahead!
Chart shows strong momentum — watch for retest and ride the wave 🌊
— TuffyCalls Team ✅
Beyond Technical Analysis
Ethereum Breaks $3,000: Hype Meets UtilityEthereum (ETH) has surged above $3,000, driven by a wave of retail and institutional momentum following the presale success of Little Pepe (LILPEPE), a meme coin built on a new Ethereum-compatible Layer 2 network. With over $5 million raised during the presale, the appetite for meme-coin ecosystems continues to fuel Ethereum’s utility narrative, giving it both technical and psychological strength.
Key Levels to Watch:
• Short-term Structure (H4 Chart): ETH is currently forming a bullish flag pattern, a continuation structure that often precedes further upside.
• Upside Scenario: A confirmed breakout above $3,100 could extend the rally to $3,200, and potentially test $3,300, a level of major historical resistance.
• Downside Risk: Failure to hold current levels may see ETH retrace back toward $2,900, with the 50% Fibonacci retracement at $2,600 acting as the next support zone.
If sentiment in the broader crypto market remains elevated and Bitcoin holds firm near all-time highs, Ethereum’s bullish setup may have further room to run.

7.14 AUD/CAD 4H LIVE TRADE UPDATEThis market gave us a great shooting star reversal pattern on the 4H chart on Friday...

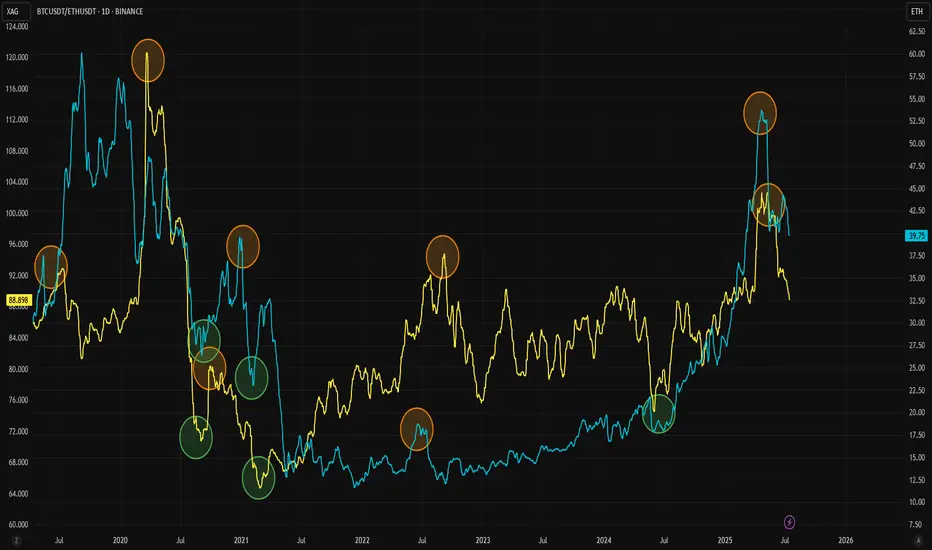
Want to Know What Happens in Crypto? Check Silver InsteadThe Gold/Silver ratio is one of the key indicators that highlights major turning points in modern economic history. Similarly, the ETH/BTC ratio is widely followed as a gauge of strength in the crypto market and the beginning of altcoin seasons. Interestingly, these two ratios also appear to correlate well with each other.
As adoption of both Ethereum and Bitcoin has grown, the Gold/Silver and BTC/ETH ratios have started to move more closely together. They often follow similar patterns, with tops and bottoms forming one after the other. For clarity, this analysis uses the BTC/ETH ratio rather than ETH/BTC.
Historically, BTC/ETH tends to lead during market tops, followed by a similar move in the Gold/Silver ratio. This pattern has been observed repeatedly since 2020. When it comes to bottoms, the timing between the two ratios is usually tighter, as seen during the 2020, 2021, and 2024 lows.
The latest signal came from a top in the BTC/ETH ratio, and the Gold/Silver ratio now appears to be following that move. Given the cyclical nature of crypto markets, both ETH and silver could be at the early stages of new upward trends. For a potential trend reversal, it may be wise to keep a closer eye on silver in the coming weeks.
SAILIFE - IPO base breakoutTighter the consolidations, better the breakout.
A solid base has formed. Moving with the index, sector tailwinds in play

Nifty holds important support zone.Nifty Analysis:
Support and Upside Targets
Market Recap
- Opening: Nifty opened flat, showing little directional bias at the start.
- Intraday Move: The index was dragged down towards the important support zone of 25,050–25,000
- Bounce: From this support zone, Nifty rebounded and managed to close above 25,080.
Technical Outlook:
Key Support Zone
- Support Range: 25,050–25,000
Significance: This zone has acted as a strong support, with buyers stepping in to defend it.
- Implication: As long as Nifty sustains above this zone, the short-term trend remains positive.
Upside Targets
If Nifty holds above the support:
- Immediate Targets: 25,200 and 25,300 are the next levels to watch for upward momentum.
- Long-Term Targets: 25,500 and 25,700 remain the key targets if the bullish momentum continues.
Summary
- Bullish View: Sustaining above 25,000–25,050 support zone keeps the index in a positive bias.
- Bearish Risk: A decisive break below 25,000 could lead to further downside.
- Strategy: Traders may consider staying long as long as Nifty holds above the support zone, watching for the mentioned targets.
Note: Always use appropriate risk management and monitor for any changes in market sentiment or global cues that may impact index movement.

heavy buyers buy sold offlooking for buying support at $1.5 or higher and continuation through sellers at 1.75

XAU/USD Update: Ready for a 12% Surge?Welcome back, traders, it’s Skeptic! 😎 Is XAU/USD about to explode or crash?
We’ve formed a symmetrical triangle pattern , and its breakout triggers could deliver solid profits for longs or shorts. Let’s dive into the details with the Daily timeframe to see the big picture.
✔️ Daily Timeframe: Our HWC is strongly bullish. After hitting $ 3,497.80 , we entered a secondary retracement phase, forming a symmetrical triangle. If we break resistance at $ 3,444.18 , my targets are the next ceiling at $ 3,494.50 and, long-term, $ 3,796.64 . But if we break support at $ 3,796.64 , it could signal a major trend change from uptrend to downtrend, opening shorts. Next supports are $ 3,206.32 and $ 3,019.31 —use these as your targets.
📊 Key Insight : Risk management is key to surviving financial markets. Stick to max 1%–2% risk per trade to stay safe.
📉 Market Context: Markets are predicting a major recession in the U.S. economy. If it happens, Gold will be the only safe-haven asset. So, I personally favor riding Gold’s uptrend.
This historic drop screams one thing: global markets are losing faith in U.S. monetary and fiscal policies, big time.
And that’s a loud wake-up call for investors: It’s time to bulletproof your portfolio. What’s that mean?
Your stocks, real estate, cash, bonds , you name it...
They’re slowly but surely turning to Gold .
💬 Let’s Talk!
Which Gold trigger are you eyeing? Hit the comments, and let’s crush it together! 😊 If this update lit your fire, smash that boost—it fuels my mission! ✌️

Next price Target AINUSDTThis is the next price target for Ininity Ground, AINUSDT ticket. not Financial Advice, do what you will with it.

gold on sell reverse#XAUUSD needs reverse below last week support 3350, now entry at 3367.5.
Target 3350-3340, stop loss at 3375.19.
D1 TF still shows bullish continuation which can Target 3385-3390, expect entry above 3376

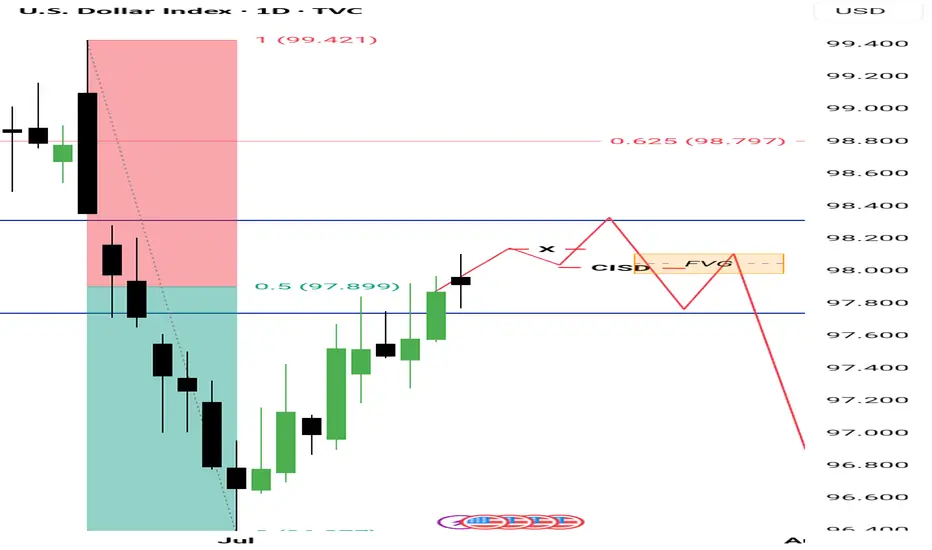
POSSIBLE PLAY FOR THE WEEKHTF KEY LEVEL
1. Premium gap/volume imbalance (DAILY TF)
2. monthly inverted fvg premium marked in Blue lines
I'd be watching the hourly time frame to get a setup as marked in red to engage for the week.
NOTE: CPI Tuesday
Report - 10 jully, 2025Germany Pushes European Rearmament — Supply Chain Call to Action
Key Developments
German Defense Minister Boris Pistorius demands the defense industry “stop complaining and deliver,” pushing for accelerated production.
Berlin plans to raise annual defense spending to €162 billion by 2029 (+70% vs. current), the largest defense expansion since WWII.
Focus on munitions, drones, tanks, submarines, fighter jets.
Long-term contracts with annual purchase obligations to provide production certainty and encourage new capacity.
Meeting with US Defense Secretary Pete Hegseth to secure US support and coordinate Patriot missile supply (Germany has only 6 left).
Despite Ukraine’s renewed requests, Germany will not send Taurus long-range missiles.
Strategic Analysis
Germany’s pivot (the "Zeitenwende") signals a historic shift toward a leadership role in European defense, stepping up as US support for continental security wanes. The move reshapes Europe's industrial base and procurement priorities, creating a structural, multiyear demand boom in defense production.
This strategic acceleration responds to:
Russia's aggression and rapid advances in Ukraine.
A fragmented EU defense industry needing standardization and scale.
The risk that delays in rearmament could embolden adversaries.
Market & Investment Implications
Bullish outlook for European defense primes: Rheinmetall, Hensoldt, KMW, and MBDA.
Strong orders pipeline supports supplier valuations and capital investments.
Defense-focused ETFs and long-cycle industrial funds gain attractiveness.
Potential execution risks: capacity bottlenecks and regulatory procurement hurdles.
North Korea’s Unconditional Support to Russia — New Security Axis
Key Developments
Kim Jong Un pledges "unconditional support" for Russia’s Ukraine war effort during Lavrov’s visit.
North Korea has reportedly sent 13,000 troops and 12 million artillery shells since October, with plans for more troops this summer.
Joint military and economic ties deepening: possible new infrastructure projects and North Korean goods in Russian markets.
Strategic Analysis
The explicit military alliance between Moscow and Pyongyang cements a new anti-Western axis in Northeast Asia. North Korean boots on the ground in Ukraine (even indirectly) create significant escalation risks and could legitimize wider allied responses.
Market & Security Implications
Increases global defense spending momentum, particularly in missile defense and artillery systems.
Heightens regional security risk premium in Northeast Asia, reinforcing demand for US-Japan-Korea trilateral cooperation.
Potential new sanctions regimes targeting Russian and North Korean trade.
EU to Intensify Foreign Subsidy Investigations
Key Developments
EU to expand probes into foreign-subsidized companies, particularly Chinese, using the Foreign Subsidies Regulation (FSR).
Target sectors: chemicals, pharmaceuticals, cars, batteries, and green tech.
FSR empowers Brussels to block public procurement bids, M&A deals, and restrict single-market access.
Strategic Analysis
A clear industrial policy pivot: Brussels seeks to protect European value chains, local talent, and technological sovereignty. The EU is signaling it will emulate China’s own JV requirements to force knowledge transfer and local investment.
Market & Corporate Implications
Defensive boost for EU industrial and tech players — potential reshoring and local capacity expansion.
Risks for Chinese EV, solar, and battery players in Europe.
New compliance costs and operational hurdles for multinationals with Chinese JV exposure.
EU Temporarily Suspends Tariff Retaliation Against US
Key Developments
EU delays €21 billion in planned retaliatory tariffs on US exports following Trump’s 30% tariff threat.
Negotiations ongoing; additional €72 billion of potential retaliatory measures being prepared.
Germany’s finance minister stresses continued “serious talks,” warning of possible decisive countermeasures if negotiations fail.
Strategic Analysis
EU seeks to avoid a major trade war escalation that could hit vulnerable industries (aircraft, agriculture, luxury goods). The postponement reflects both economic pragmatism and strategic patience.
Market Implications
Near-term relief for European cyclical exporters and automotive supply chains.
Volatility risk persists; underlying uncertainty keeps global supply chain hedging active.
Global Health Risks from Western Aid Cuts
Key Developments
Wellcome Trust warns that sharp cuts in Western aid (e.g., 83% of USAID programs, UK’s 40% cut) could lead to deaths exceeding those caused by COVID-19 in Africa and other regions.
Reductions threaten vaccination programs, HIV/AIDS prevention, and basic health infrastructure.
Strategic & Social Implications
Rising health crises could create regional instability, migration pressures, and political fragility.
Potential for emergent humanitarian crises to undermine global economic resilience and security.
Crypto Firms Move Toward US Banking Integration
Key Developments
Ripple, Circle, and BitGo seek national banking charters; Kraken to launch crypto-backed debit/credit cards.
Trump administration’s pro-digital asset stance and proposed Genius Act accelerating integration of stablecoins with Treasury backing.
Strategic Analysis
Crypto players are rapidly shifting from an anti-establishment stance to a regulated model, seeking legitimacy and direct ties to the US banking system. This is a major strategic pivot toward mass-market adoption and integration.
Market Implications
Growth catalysts for regulated digital asset ecosystems.
Opportunities in infrastructure (custody, payment rails, compliance tech).
Regulatory framework evolution remains a key risk factor.
US-Japan Relations Enter Critical Phase
Key Developments
Sharp deterioration in US-Japan ties as Trump imposes tariffs and demands higher defense spending (up to 3.5% of GDP).
Japan’s requests for tariff exemptions rebuffed; possible alliance strain.
US threatens to halt Okinawa troop relocation plans, creating a defense strategy crisis.
Strategic Analysis
Deepening transactional approach by US administration risks destabilizing one of Washington’s most strategic alliances. Japan’s ability to recalibrate is limited, leading to potential security vulnerabilities vis-à-vis China and North Korea.
Market & Policy Implications
Elevated geopolitical risk premium in Asia-Pacific.
Potential reassessment of Japanese defense contractors and broader regional security investments.
Possible long-term tailwinds for local defense and cybersecurity initiatives.
Copper Tariff Uncertainty — Global Supply Chain Alert
Key Developments
US plans 50% copper tariffs from August 1; manufacturers seek clarity.
Copper critical for EVs, semiconductors, defense, and green infrastructure.
Stockpiles may last 6–9 months; longer-term supply risk remains acute.
Strategic & Market Implications
Significant inflationary pressures in downstream sectors.
Supply chain disruptions could affect US manufacturing competitiveness, defense readiness, and green transition timelines.
Potential opportunities for non-US copper producers and recyclers.
Apollo's UK Pension Play — Bulk Annuities Strategy
Key Developments
Athora (Apollo-backed) acquires Pension Insurance Corporation for £5.7bn, entering the UK’s £500bn pension de-risking market.
Signals strategy shift as US private capital increasingly integrates with retirement and insurance liabilities.
Strategic Analysis
Apollo’s model of “permanent capital” (buying long-duration liabilities to invest in high-yielding private assets) advances further into Europe. The move addresses demographic pressures and opens new fee streams.
Market Implications
Bullish for Apollo and similar alternative asset managers.
Heightened scrutiny by regulators on risk transfer and solvency.
UK pension de-risking market consolidation may create opportunities for specialized asset managers.
Overall Global Themes & Recommendations
Themes
Structural defense rearmament and deterrence strategies reshaping Europe and Asia.
Geopolitical realignments create new economic blocs and challenge global supply chains.
Rise of state-supported industrial policies in Europe (FSR) and US (tariffs).
Growing integration of crypto into mainstream finance under a friendlier US regulatory regime.
Recommendations
Overweight: European and US defense primes, cybersecurity, regulated crypto infrastructure.
Underweight: Asian export-heavy sectors highly exposed to US tariff risk, particularly Japan.
Selective Long: European industrial reshoring beneficiaries, US pension risk transfer facilitators.
Monitor: Copper and critical mineral supply chains for inflation pass-through and supply constraints.

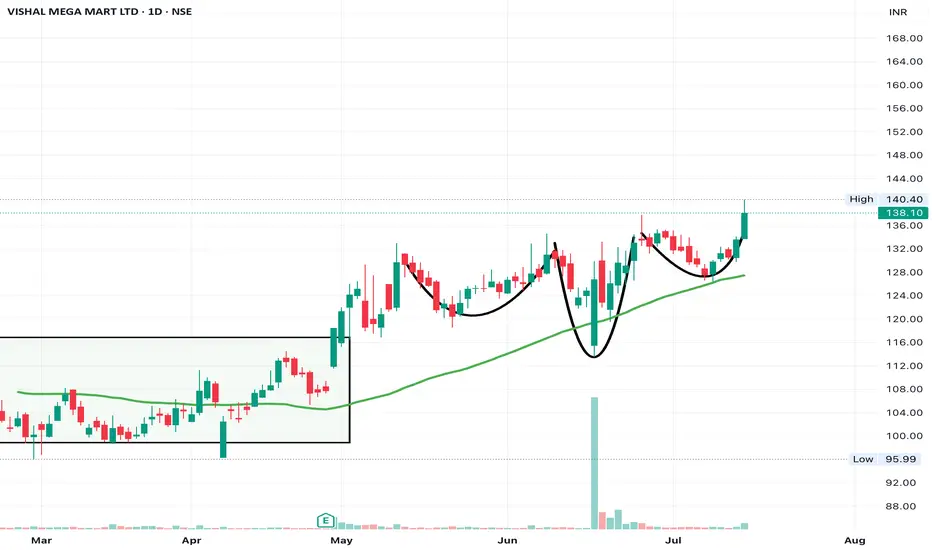
VMM - Inverse Head and Shoulder Not all charts are perfect, but in my experience, shorter the contraction duration, higher the momentum. Lets see this in action on this trade!
Breakout has happened, would love to get a close near the day high.
EURUSD and GBPUSD are preparing to continue the upward trendAfter a significant rise in the EURUSD and GBPUSD, they have formed a descending price channel, and it is expected that this channel will be broken to complete the upward trend, because there is no sign of weakness yet, and the Main Lows have not yet been broken.

BUYTrend Line Break
Previous Day Volume
Rejection Point
Untapped Order Point
London Session
High Structure Swing
BUYTrend Line Break
Previous Day Volume
Rejection Point
Untapped Order Point
London Session
High Structure Swing

BUYTrend Line Break
Previous Day Volume
Rejection Point
Untapped Order Point
Asian Session
High Structure Swing
GBP/USD (GU) Weekly Outlook – July 15–19, 2025🔍 Price Enters Extreme Discount – Bounce or Breakdown?
After a clean break in structure and multiple bearish rejections, GBP/USD has entered extreme discount territory. Price is now testing a high-probability reaction zone near the weak low around 1.3440.
📊 Key Technical Zones:
🔻 Weak Low: 1.3440
🔵 1H OB (HP) below weak low: Potential liquidity draw
🔺 Retracement Targets:
0.25 = 1.3500
0.50 = 1.3535
0.75 = 1.3575
🟥 FVG resistance zone: 1.3575–1.3600
🧲 Draw on liquidity: Sub 1.3440 or PDH rejection area
🧠 Base Case:
📈 Expecting a short-term bullish reaction from the extreme discount zone
📉 Bias remains bearish overall unless structure shifts decisively
🎯 Weekly Trade Plan:
✅ Plan A: Watch for bullish CHoCH near 1.3440–1.3450
TP1: 1.3500
TP2: 1.3535–1.3575
🔁 Plan B: If price sweeps lower into OB (below 1.3440) → Look for bullish structure shift on LTF
❌ Invalidation: Sustained break and close below 1.3425 → opens path toward 1.3360s
📌 Price is deep into discount, but without confirmation there is no trade. Patience for reaction setups is key.

It would be interesting to see how this channel theory plays outI noticed a very tight parallel channel that formed. Now it's broken, I wondered whether the channel could continue to the upside. Of course there's still a chance that it could continue down but let's see.

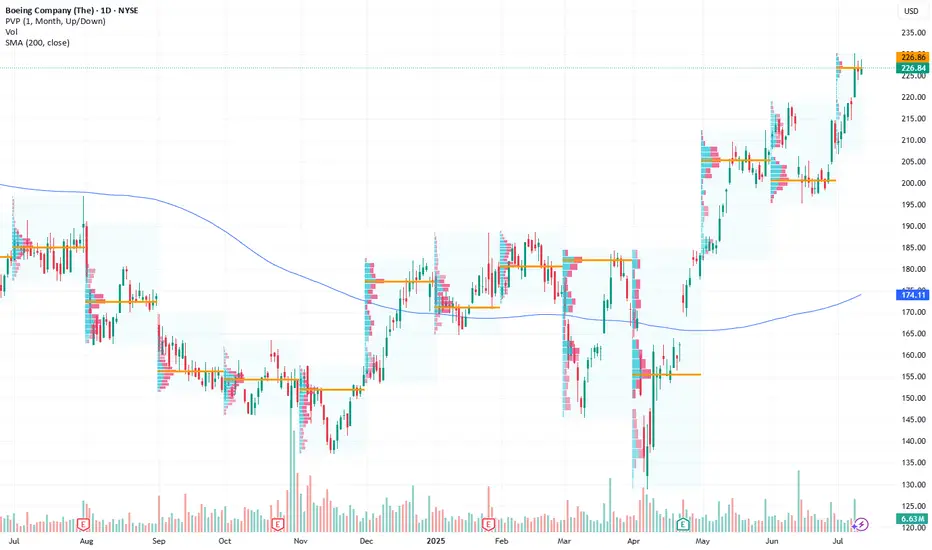
Long Opportunity: Boeing Could Take Flight Next WeekCurrent Price: $226.84
Direction: LONG
Targets:
- T1 = $233.00
- T2 = $238.00
Stop Levels:
- S1 = $223.00
- S2 = $218.00
**Wisdom of Professional Traders:**
This analysis synthesizes insights from thousands of professional traders and market experts, leveraging collective intelligence to identify high-probability trade setups. The wisdom of crowds principle suggests that aggregated market perspectives from experienced professionals often outperform individual forecasts, reducing cognitive biases and highlighting consensus opportunities in Boeing.
**Key Insights:**
Boeing continues to be a key player in the aerospace industry. Strong demand in its commercial airplane segments, coupled with resilient defense contracts, provides the company with stability. The ongoing recovery in airline travel globally adds further momentum to growth, presenting opportunities to capitalize on this positive outlook. Boeing's concerted efforts to address operational inefficiencies and ramp up production capacity also add value, particularly as the company pivots to meet increasing demand in the commercial aviation industry.
The aerospace giant has also benefited from favorable regulatory measures and accelerated demand recovery in Asia and Europe, key regions for international travel plays. Boeing's focus on ramping up production of the 737 MAX series while maintaining strong growth in its aftermarket services positions it for sustained revenue gains.
**Recent Performance:**
Boeing has demonstrated steady upward movement over recent sessions while largely consolidating within a tight technical range. Volumes have remained consistent, signaling sustained investor confidence despite broader market uncertainties. The current price action shows a favorable risk-to-reward setup approaching key resistance levels.
**Expert Analysis:**
Market sentiment remains optimistic due to strong tailwinds in the commercial aviation sector. Analysts point to Boeing's better-than-expected execution on fulfilling delayed orders, particularly for the 737 MAX. Despite concerns over persistent supply chain disruptions, experts note that Boeing's strategic partnerships and operational agility mitigate the long-term risks. Investors are encouraged by the company's forward guidance, although higher material costs remain a watch point for margins.
Technically, Boeing is testing critical resistance at $230. Analysts view a break of this region as a trigger for additional gains, leading to breakout opportunities toward the $240 level.
**News Impact:**
Boeing recently increased its production targets for 2024 and announced strategic moves to expand global service offerings. Positive sentiment surrounding favorable regulatory measures, coupled with improving demand for replacement planes and international travel, has boosted outlooks. Continued commitments from airline giants to upgrade fleets support robust future order flow.
**Trading Recommendation:**
A long position in Boeing at the current price of $226.84 targets a movement to $233.00 (T1) and $238.00 (T2). Stops should be placed at $223.00 (S1) and $218.00 (S2) to limit downside risks. This trade benefits from near-term positive catalysts, including volume consistency, strong market sentiment, and supportive global travel demand recovery.
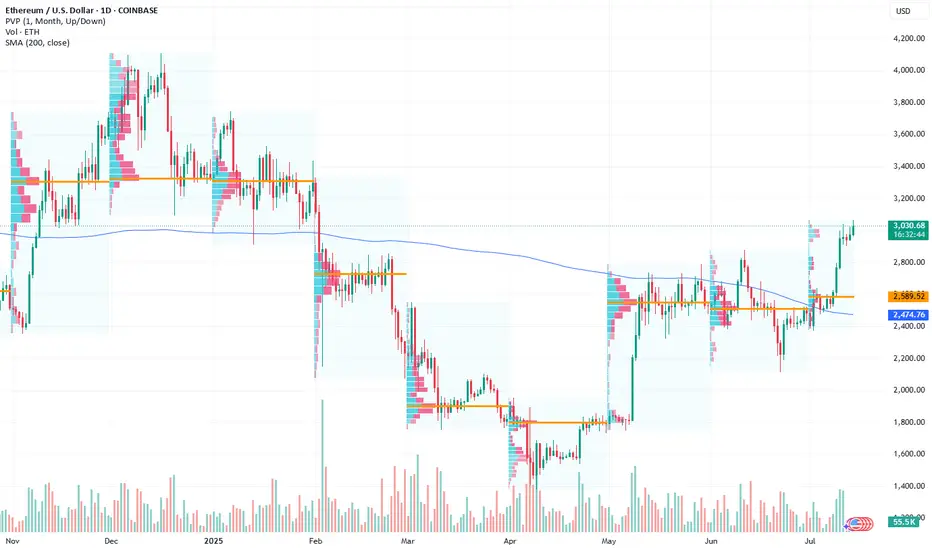
Ethereum: Bullish Momentum Signals Broader Rally Beyond $3000Current Price: $3002.13
Direction: LONG
Targets:
- T1 = $3120.00
- T2 = $3203.00
Stop Levels:
- S1 = $2934.00
- S2 = $2842.00
**Wisdom of Professional Traders:**
This analysis synthesizes insights from thousands of professional traders and market experts, leveraging collective intelligence to identify high-probability trade setups. The wisdom-of-crowds principle suggests that aggregated market perspectives from experienced professionals often outperform individual forecasts, reducing cognitive biases and highlighting consensus opportunities in Ethereum.
**Key Insights:**
Ethereum shows robust uptrend momentum, underpinned by significant institutional demand and strengthening market sentiment. As the primary cryptocurrency supporting decentralized finance (DeFi) and non-fungible tokens (NFTs), Ethereum has positioned itself at the forefront of blockchain advancements. The growing adoption by institutions and favorable macroeconomic conditions further consolidate its growth prospects, especially with the increasing recognition of Ethereum as a digital inflation hedge.
Positive developments in regulatory frameworks around cryptocurrencies have also been instrumental in improving market sentiment. Ethereum continues to showcase strong transactional activity on its network, bolstering demand for ETH tokens as a utility. Heightened activity ahead of protocol upgrades is another catalyst that traders are closely monitoring.
**Recent Performance:**
Ethereum has maintained a steady price appreciation trend in alignment with broader cryptocurrency market gains. From its previous trading range below $3000, Ethereum has breached psychological resistance, marking $3002.13 as a pivotal level. Increased trading volume and positive sentiment have allowed Ethereum to test higher resistance levels, making it well-positioned for potential upside continuation.
**Expert Analysis:**
Market experts remain bullish on Ethereum, citing fundamental strengths such as its adaptability, technological utility, and yield-generating capabilities through staking. With investor demand continuing to grow, Ethereum is expected to outperform many altcoins and maintain leadership alongside Bitcoin. Analysts project an intermediate target of $3200, while the longer-term objectives extend beyond $3500 given its current trajectory.
Technical metrics also signal bullish momentum, including sustained moving average support and increasing RSI levels. Investors may find attractive reward-to-risk setups at current levels, supported by favorable macro and crypto-specific factors.
**News Impact:**
Ethereum has benefited from an improving regulatory environment in key crypto jurisdictions, which has alleviated some uncertainty. Simultaneously, positive macroeconomic trends, such as declining inflation expectations and risk-on sentiment across equity markets, have boosted overall investor confidence. Ethereum’s role in various decentralized applications (dApps) and strategic partnerships with enterprises further solidify its potential for sustained growth.
**Trading Recommendation:**
Traders should consider taking a long position on Ethereum, targeting $3120 and $3203 as near-term objectives while maintaining disciplined risk management with stops at $2934 and $2842. The combination of fundamental strength, technical indicators, and favorable news impacts positions Ethereum as an attractive investment opportunity amidst current market dynamics.
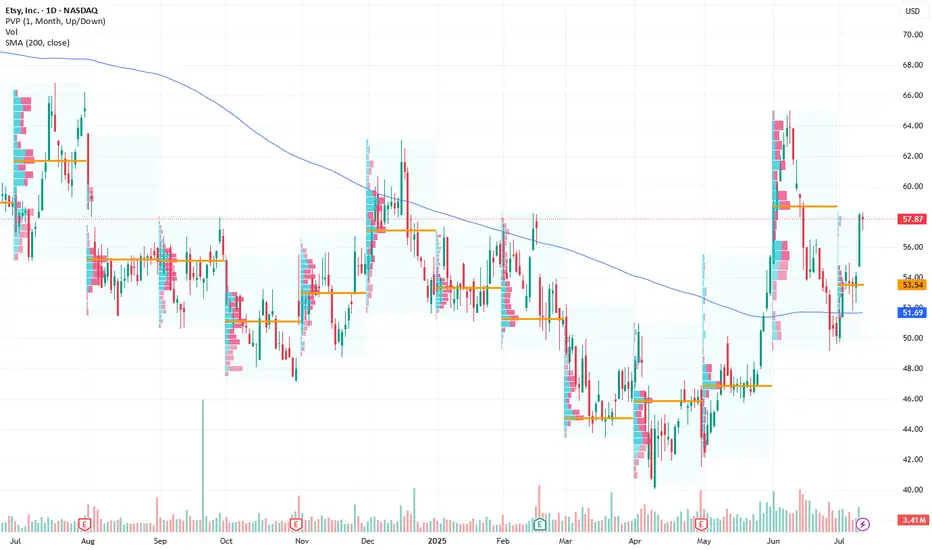
Etsy Positioned for a Strong Bullish Move Next WeekCurrent Price: $57.87
Direction: LONG
Targets:
- T1 = $60.50
- T2 = $64.00
Stop Levels:
- S1 = $56.00
- S2 = $54.50
**Wisdom of Professional Traders:**
This analysis synthesizes insights from thousands of professional traders and market experts, leveraging collective intelligence to identify high-probability trade setups. The wisdom of crowds principle suggests that aggregated market perspectives from experienced professionals often outperform individual forecasts, reducing cognitive biases and highlighting consensus opportunities in Etsy.
**Key Insights:**
Etsy has broken out of a descending wedge pattern, a bullish technical indicator that frequently signifies the end of a downturn and a shift in market sentiment. This breakout is complemented by a “golden cross” formation, where a short-term moving average crosses above its long-term counterpart, often associated with sustained bullish trends. These technical patterns, paired with increasing volume during the breakout, indicate growing investor confidence and the potential for significant upward momentum in the near term.
The company’s niche focus on craft-based e-commerce positions it well amid trends favoring small business support and unique products, adding further long-term growth potential. Recent volume-weighted metrics also show positive divergence, signaling underlying demand even during market-wide hesitations.
**Recent Performance:**
Etsy has recently recovered from a multi-month decline, trading at $57.87 after forming a strong support base around $54. This recovery has been marked by increasingly higher lows and higher highs, confirming the presence of an uptrend. The breakout from its descending wedge pattern was accompanied by above-average trading volume, underscoring market conviction in the move.
**Expert Analysis:**
Analysts are optimistic about the breakout’s implications, citing the combination of technical indicators that suggest Etsy is entering a bullish zone. A short-term target range between $60 and $64 aligns with Fibonacci retracement levels from prior downturns, while a long-term price objective could extend significantly higher if the upward trajectory sustains. The golden cross and robust RSI levels further validate a bullish stance, suggesting that momentum is far from peaking.
**News Impact:**
No major news headlines have directly driven Etsy’s recent movements, but broader macroeconomic factors, such as holiday season spending increases and potential improvements in consumer sentiment, could provide additional tailwinds. Furthermore, Etsy’s unique marketplace offering remains a draw for consumers even amid economic uncertainty, which could shield it from industry-specific headwinds.
**Trading Recommendation:**
With Etsy showing clear signs of bullish momentum and technical breakout patterns, a long position is recommended for traders seeking short- to medium-term gains. The initial target at $60.50 and the secondary target at $64.00 present attractive profit areas, while stop levels at $56.00 and $54.50 provide ample downside protection. This trade setup is supported by the confluence of technical signals, recent performance trends, and the company’s stable market positioning.
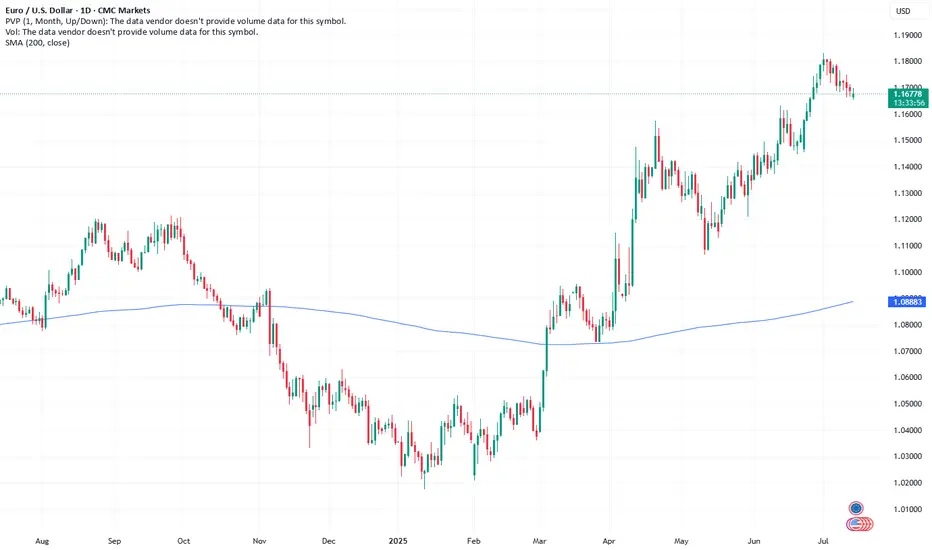
Long-Term Opportunity: Euro’s Resilience Can Drive Bullish MovesCurrent Price: $1.16822
Direction: LONG
Targets:
- T1 = $1.1785
- T2 = $1.1830
Stop Levels:
- S1 = $1.1660
- S2 = $1.1625
**Wisdom of Professional Traders:**
This analysis synthesizes insights from thousands of professional traders and market experts, leveraging collective intelligence to identify high-probability trade setups. The wisdom of crowds principle suggests that aggregated market perspectives from experienced professionals often outperform individual forecasts, reducing cognitive biases and highlighting consensus opportunities in Euro.
**Key Insights:**
The Euro continues to show resilience despite broader market challenges, presenting selective bullish opportunities. Germany's industrial production recovery and the Euro's strength against weaker currencies like the Japanese Yen and New Zealand Dollar reinforce the potential for upward pressure. However, critical upcoming events such as CPI and retail sales data could serve as catalysts for significant price movement. A data-driven approach remains crucial, with an eye on key support and resistance levels to validate bullish momentum.
Euro sentiment has also been influenced by global interest rate dynamics and the Federal Reserve’s hawkish stance, which impacts the US Dollar. Still, the Euro has found footing as investors weigh potential policy shifts from the European Central Bank (ECB) later in the year.
**Recent Performance:**
The Euro has defended against broader weakness in regional European markets while managing to sustain strength against select global currencies. Recently, EUR/USD experienced a steady recovery from critical multi-week lows at $1.1650 as traders focused on better-than-expected German industrial production of +1.2%. However, softer retail sales (-0.7%) and export data (-1.4%) have tempered some of the optimism.
**Expert Analysis:**
Analysts highlight that while weak macroeconomic data out of Europe remains a drag, selective trades offer strong upside potential for the Euro. Germany's industrial production continues to underpin sentiment, with analysts recommending long positions after confirming swing lows and bullish patterns. Technical setups focusing on Fibonacci retracement levels provide critical entry points, which suggest limited downside risk relative to the potential upside reward.
**News Impact:**
Key developments such as renewed tariff tensions and slower global economic momentum continue to shape Euro outlooks. The upcoming release of UK CPI on Wednesday and Eurozone retail sales updates may spark additional volatility. Professional traders emphasize careful monitoring of headline risk, with potential for surprising bullish catalysts that would justify higher pricing levels in the near term.
**Trading Recommendation:**
The Euro is poised for a potential rebound in the coming weeks, with technical and fundamental indicators aligning to suggest a bullish trajectory. Current price levels offer attractive entry points, provided stop-loss levels are respected to mitigate downside risk. Focus on a long-term perspective, leveraging data-driven insights to capture potential gains toward $1.1785 and beyond.