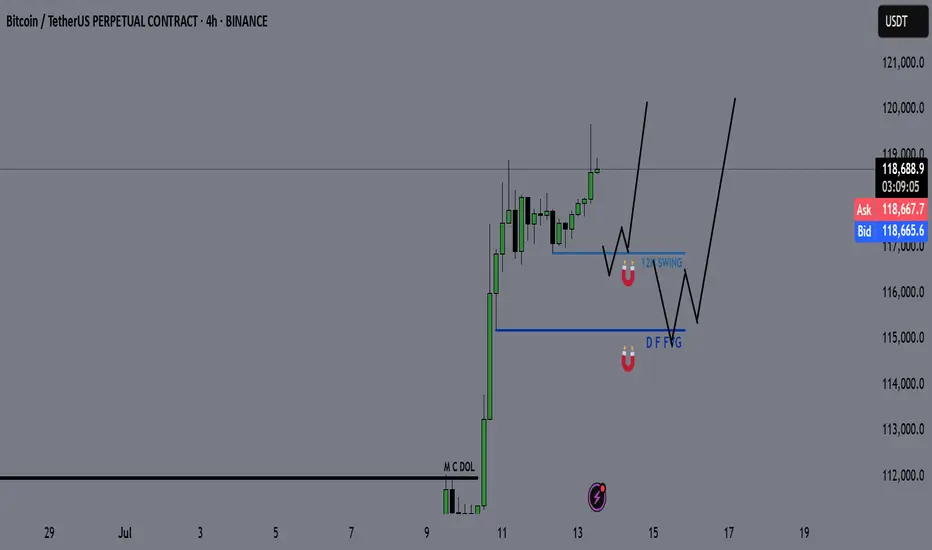
Bitcoin - BTC | Weekly Market Recap & Outlook 13.07.2025What Happened Last Week?
Bitcoin broke out of the recent downtrend structure and established a bullish leg with clear momentum.
The breakout was supported by volume and price structure, suggesting a trend reversal rather than a temporary deviation.
Weekly Bias and Strategy
The current outlook is bullish.
A retracement or sideways consolidation between the $120,000 and $114,000 zone is possible.
This zone may act as accumulation before further upside.
Key Points of Interest (POIs):
12H Swing Liquidity (turquoise line)
Daily FVG (blue line)
These levels will be monitored for long setups with confirmation on lower timeframes.
Macro Consideration – Fed Chairman Jerome Powell
Recent market speculation has increased regarding Jerome Powell potentially stepping down as Chair of the Federal Reserve.
If such a resignation is confirmed, it may act as a significant bullish catalyst for Bitcoin and other risk assets, possibly accelerating upside without allowing for any meaningful pullback.
Summary
• Bullish breakout confirmed
• Long bias maintained unless major invalidation occurs
• Watching retracement levels for entries
• Macro catalyst (Powell resignation) may trigger strong continuation without retrace
Beyond Technical Analysis
ETH / USDC Liquidity Pool RangeEthereum is climbing alongside Bitcoin, but it’s clearly outperforming. In many ways, ETH is the Microsoft of the crypto space—serving as a foundational platform on which countless networks and tokens are built, much like Windows supports a broad software ecosystem. In contrast to Bitcoin’s role as a digital currency, Ethereum functions more like a software operating system.
We broke out of the previous range for strong profits. The new range is tighter, with the lower boundary set just above the current ETH spot price at $2,995.91 and the upper boundary at $3,340.90, as marked by the horizontal yellow lines. On the 3-hour chart, momentum is beginning to turn upward. To enter the liquidity pool within this range, we must be fully allocated in ETH.

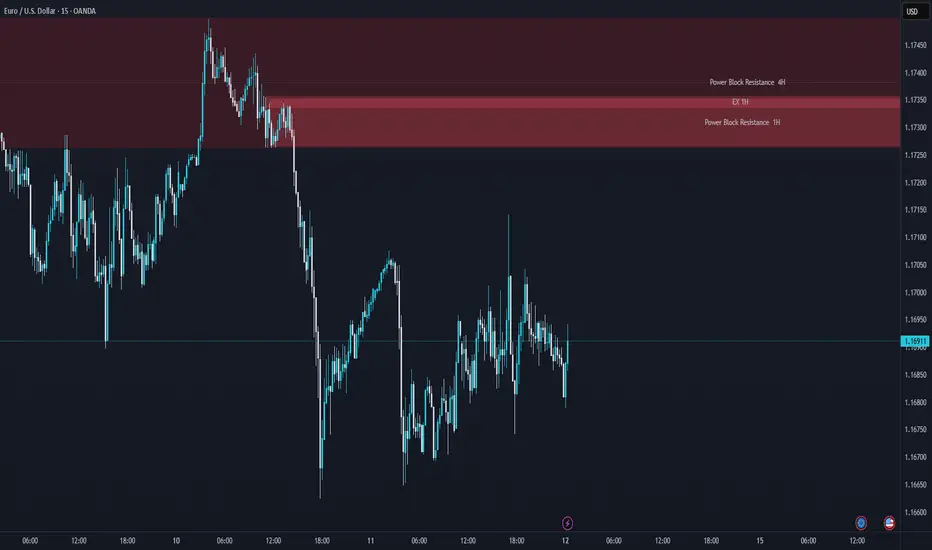
Ready to Swipe the Pips? | EUR/USD Heist Blueprint Unlocked🏴☠️💸 EUR/USD "Fiber Heist Plan" – Thief Trader Style 💸🏴☠️
The Vault is Open – Swipe the Bullish Bags! 🚀📈💰
🌟Hi! Hola! Ola! Bonjour! Hallo! Marhaba!🌟
Welcome, Money Makers & Market Robbers! 🤑✨
Here’s the latest masterstroke based on our Thief Trading Style™—a tactical breakdown of EUR/USD primed for a bullish breakout robbery. We’re targeting the red zone 🎯—where the weak hands panic, and the real players win.
🔓 Entry Plan (Buy Setup):
🟢 "The vault is wide open!" — We’re planning bullish entries using 15m–30m timeframe swing levels.
✅ Buy Limit Orders: Plot them smartly around most recent swing lows/highs.
⚠️ Chart Alert Suggested: Eyes on the prize, don’t miss the break-in.
🛑 Risk Guard (SL Setup):
💼 Stop-Loss: Set at nearest 30-min swing low (based on your risk appetite).
Remember, it’s about preserving your loot, not just grabbing it.
🎯 Target Area:
🎯 Primary Target: 1.19000
🎯 Optional Trailing SL: Ride the wave, lock the profits as price moves.
🧲 Scalpers' Notice:
Only scalp long. Got big pockets? Jump in. Smaller bags? Swing along.
💡 Trailing stop advised—don’t let the market steal your gains.
💹 Current Market Outlook:
EUR/USD is moving bullish—supported by technical signals, macro news, COT insights, and intermarket vibes.
🧠 Use all tools: Fundamental 📊 + Sentiment 🧭 + Quant + Bias Score 📈.
📎 Want the full breakdown? Check the 👉.Liinkk.🔗
(Keep updated, conditions shift fast!)
⚠️ News Risk Alert:
🚨 Stay alert during news drops—avoid fresh trades then.
Use trailing SLs to lock profits & guard against reversal raids.
💖 Support the Robbery Plan!
💥 Hit that Boost Button 💥 if you're riding with the Thief Team!
We steal smart, we trade sharp — every day’s a new heist in this market.
See you on the next plan! Stay legendary 🐱👤💸🤑🔥

FRANCE 40 Heist in Progress | Bullish Reversal Zone Spotted.💼 CAC40 Market Heist: Thief Trading Blueprint for Smart Traders (Swing/Day Trade Edition) 💼
🌍 Bonjour, Hola, Hallo, Marhaba, Ola, Hello! 🌍
Welcome to all Market Hustlers, Silent Snipers, and Profit Seekers! 🤑💸🎯
We're back with a precision-built Thief Trading Plan — this time targeting the FRANCE40 / CAC40 Index, using a combination of street-smart technicals and sharp macro insights.
🧠 Game Plan: The “Market Heist” Strategy
This strategy revolves around a Long Entry setup aiming for the high-risk Red Zone. Price is pushing into potential overbought territory, with signs of consolidation and trend exhaustion. That’s exactly where reversal opportunities and big moves live — right before the herd wakes up. 🐂💰
🔓 Entry Plan – "The Vault’s Open"
📍 Enter on bullish setups – recommended through:
Recent 15/30 min support levels or
Swing low/high based buy limit zones
💡 Pro Tip: Set alerts at those critical swing levels so you’re always one step ahead.
🛑 Stop Loss – "Stay Out of Jail"
🎯 Suggested SL: Near the recent 3H swing low (~7600 zone)
🧩 Adjust SL based on:
Risk tolerance
Lot size
Multiple entries
Trading strategy preference
🎯 Take Profit – "The Great Escape"
📌 Primary TP: 7830.00
🔐 Trailing SL advised to secure profits during the climb
🚨 If market shifts or trap signs emerge, exit early and protect the bag.
⚔️ Scalpers vs Swingers – Choose Your Crew
Scalpers: Only ride the long waves. Use momentum & micro breakouts.
Swing Traders: Follow the blueprint. This is your time to rob the trend cleanly. 🕶️📈
🧩 Market Insight & Fundamentals
This bullish momentum is backed by key drivers:
Economic releases
Institutional positioning (COT Reports)
Sentiment & intermarket flows
Geopolitical & macro factors
📌 Always update your narrative. Markets shift fast. Stay informed. Stay sharp.
⚠️ Important Trading Notice – News Risk & Management
🚫 Avoid fresh entries during high-impact news events
🔄 Use trailing SLs to lock gains
🧠 Be aware of volatility traps
❤️ Support the Strategy – Hit Boost & Join the Crew
If this strategy made sense to you, smash that Boost Button.
You're not just supporting a post — you're fueling a Thief Trader movement where smart, fearless traders take what’s theirs from the market. 🚀💰
🎉 Keep winning, stay alert, and I’ll see you in the next heist! 🧠💸🐱👤

"GBP/JPY: High-Risk Pips Grab – Escape Before Cops! 🏴☠️ GBP/JPY "Dragon Heist" – Bulletproof Bullish Raid (High-Risk, High-Reward) 🚨
🔥 Attention Market Pirates & Profit Raiders! 🔥
(Day/Swing Trade Plan – Long Entry Focused)
🔑 Entry Zone (Vault Cracked!):
"The Dragon’s loot is unguarded! Bullish pullback = prime stealing opportunity."
Buy Limit Orders: Layer entries near 15M/30M swing lows (wick/body). DCA-friendly!
Thief Pro Tip: Scalpers ride long-only waves. Swing traders? Stack slowly, escape rich.
🎯 Target (Escape Routes):
200.600 (or bail early if cops (resistance) swarm!)
🚨 Red Zone = High-Risk Take-Profit (Overbought? Reversal? Police (bears) lurk here!)
⛔ Stop Loss (Emergency Exit):
4H Swing Low/High (Wick-based) – Adjust for risk/lot size!
No martyr trades! SL = your heist survival kit.
📢 Breaking News (Fundamental Edge):
Dragon’s bullish fuel? Macro data, COT reports, sentiment—CHEK THE LIiNKk 👉🔗 (Don’t skip homework!)
💣 Trading Alerts:
News = Landmines! Avoid new trades during releases.
Trailing SL = Your Getaway Car (Lock profits, dodge volatility.)
💥 Boost This Heist!
Smash 👍, hit 🔔, and fund our next raid! Every boost = more stolen pips for the crew.
Stay tuned—another heist drops soon! 🤑 #ForexBandits

GOLD - GC | Weekly Recap & Plan 13.07.2025🟡 GOLD (GC) Weekly Recap & Outlook
Symbol: GC1!
Date: Week of July 8–12, 2025
Timeframes Used: 4H, Daily, Weekly, HTF structure
🔍 What Happened Last Week?
Gold saw a strong rejection from a confluence of two HTF trendlines, signaling resistance.
But that move was absorbed by:
🟦 Daily Demand (blue zone)
🔵 Daily Swing Liquidity (blue line)
This builds a bullish structure on the daily chart.
🧭 Scenarios I'm Watching
Scenario 1 — Minor Pullback:
🔹 Price may revisit the Daily Gap (pink line) and find support for continuation.
Scenario 2 — Deeper Pullback:
🟣 Price could retrace into the HTF bullish trendline (purple) before resuming upside.
🗞️ Bonus Macro Scenario: Powell Resignation?
There are growing rumors that Fed Chair Powell might resign this week.
📈 If that happens, I expect strong bullish momentum in Gold —
→ very limited retracement, and
→ potential straight breakout into new highs.
🎯 Targets for the Week:
✅ 1st Target:
W C DOL (purple line) → acts as a primary take profit area.
✅ 2nd Target (Expansion):
EQHs / DOL (extended purple levels)
Game Plan:
Watch for LTF confirmation on both retracement zones.
Maintain bullish bias unless Daily Demand fails.
If Powell resigns, be ready for breakout setups.

INSIGHT INSPIRED BY SHAIKH : the upcoming international crisisShaikh 2016 writes "Gold is the currency of last resort for the international system" & shows that each time since 1840 the commodity price (CPI, PPI) sinks against Gold, there is a crisis. We are there. My guess is that the international monetary system will be in crisis.

SP500 ES Weekly Recap | ATH Deviation → Pullback or Powell Pump?Overview:
ES made a new all-time high last week, sweeping the previous high with strong momentum.
However, the move ended up being a deviation, and the price quickly reversed — suggesting short-term exhaustion.
Bearish Scenario (Baseline):
🔻 Rejection from ATH
🔻 Possible retracement targets:
12H Swing Low (turquoise line)
Weekly Fair Value Gap (purple zone)
I believe a pullback into those levels could provide bullish continuation setups for new highs. I’ll look for LTF confirmation once price reaches those zones.
Bullish Scenario (Catalyst-Driven):
🚨 If Fed Chair Powell resigns this week (a circulating macro rumor), the market may not wait for retracement.
This could lead to an aggressive breakout, driving ES and risk assets straight into new ATHs again.
Plan:
✅ Watch for LTF confirmation after pullback
✅ Stay open to both scenarios
✅ Focus on HTF bullish structure as long as key levels hold

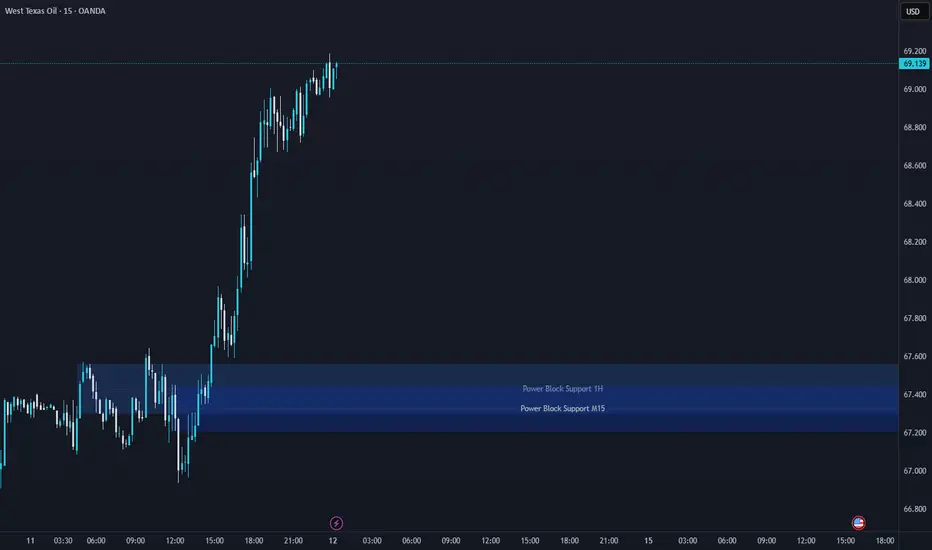
WTI Support & Resistance Levels🚀 Here are some key zones I've identified on the 15m timeframe.
These zones are based on real-time data analysis performed by a custom software I personally developed.
The tool is designed to scan the market continuously and highlight potential areas of interest based on price action behavior and volume dynamics.
Your feedback is welcome!
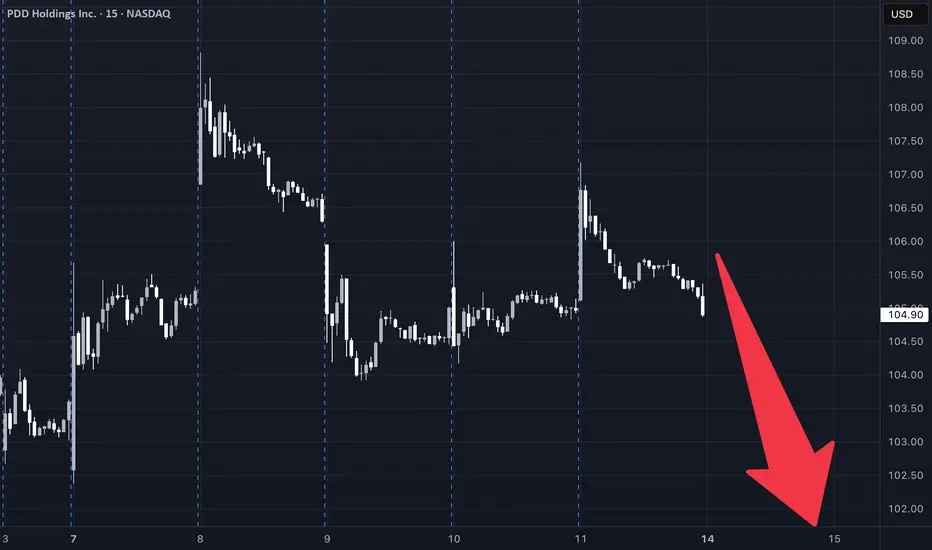
PDD Stock Trading Plan (2025-07-12)PDD Stock Trading Plan (2025-07-12)
Final Trading Decision
1. Comprehensive Summary of Each Model's Key Points
DS Report
Technical Analysis: Price: Currently at $104.91, facing short-term bearish pressures with significant support at $104.83. Indicators: Short-term indicators (30-min) show bearish signals, while daily indicators hint at a potential bullish reversal (e.g., MACD bullish divergence). Sentiment: Mixed headlines with a stable VIX suggest a favorable but cautious entry environment. Trade Strategy: Long with a target of $108.70 and stop loss at $104.10 based on recent support levels.
LM Report
Technical Analysis: Price: Above the long-term bullish trend but facing near-term resistance. Indicators: Neutral RSI levels do not suggest a clear direction. MACD shows some signs of hesitance. Sentiment: Slightly bullish due to institutional flows and a falling VIX but lacks strong conviction. Trade Strategy: Suggests a long position at $105.50, with a profit target of $113.64.
GK Report
Technical Analysis: Describes a neutral situation with prices around key EMAs and exhibiting consolidation. Weak momentum signals indicate uncertainty regarding outright positions. Sentiment: Highlights mixed news with both bullish and bearish implications. Trade Strategy: Recommends not to trade due to the unclear directional bias.
CD Report
Technical Analysis: Confirms short-term bearish momentum with price below moving averages and mixed momentum indicators. Suggests a moderately bearish sentiment based on resistance levels. Sentiment: Slightly positive VIX implies stability; however, recent call volumes show mixed institutional sentiment. Trade Strategy: Strong short position recommended to profit from resistance at $105.70.
2. Areas of Agreement and Disagreement
Agreement:
Most models agree on near-term bearish indicators (e.g., weak momentum, mixed MACD signals across timeframes). Multiple reports note the importance of the $104.30-$106.20 price range as critical support/resistance.
Disagreement:
Long vs. Short Positions: DS and LM suggest potential long positions based on technical rebounds, while CD firmly recommends a short position anticipating downward movement. Market Sentiment: Some models see potential bullish opportunities in VIX stability and call volume, while others express caution due to mixed signals.
3. Conclusion and Recommendations
Overall Market Direction Consensus
The market is in a neutral to moderately bearish state based on the conflicting signals from the models. The current indicators do not suggest a strong bullish trend, while technical analysis indicates possible downward momentum.
Recommended Trade
Direction: Short Position Entry Price: $104.90 at market open. Stop Loss: $106.20 (1.2% loss). Take Profit: $102.50 (2.3% gain). Position Sizing: Based on a $10,000 account with a 2-3% risk tolerance, risking approximately $100-$120 total. Holding Period: 3-4 weeks maximum. Confidence Level: 65% based on resistance rejection and mixed sentiment.
Key Risks and Considerations
Risk of a market reversal if bullish news arrives or a strong institutional buying momentum occurs. Close monitoring of technical indicators is required, particularly the MACD and RSI, as conditions shift either direction could warrant position adjustments.
TRADE_DETAILS (JSON Format)
{ "instrument": "PDD", "direction": "short", "entry_price": 104.90, "stop_loss": 106.20, "take_profit": 102.50, "size": 200, "confidence": 0.65, "entry_timing": "open" }
📊 TRADE DETAILS 📊 🎯 Instrument: PDD 📉 Direction: SHORT 💰 Entry Price: 104.9 🛑 Stop Loss: 106.2 🎯 Take Profit: 102.5 📊 Size: 200 💪 Confidence: 65% ⏰ Entry Timing: open
Disclaimer: This newsletter is not trading or investment advice but for general informational purposes only. This newsletter represents my personal opinions based on proprietary research which I am sharing publicly as my personal blog. Futures, stocks, and options trading of any kind involves a lot of risk. No guarantee of any profit whatsoever is made. In fact, you may lose everything you have. So be very careful. I guarantee no profit whatsoever, You assume the entire cost and risk of any trading or investing activities you choose to undertake. You are solely responsible for making your own investment decisions. Owners/authors of this newsletter, its representatives, its principals, its moderators, and its members, are NOT registered as securities broker-dealers or investment advisors either with the U.S. Securities and Exchange Commission, CFTC, or with any other securities/regulatory authority. Consult with a registered investment advisor, broker-dealer, and/or financial advisor. By reading and using this newsletter or any of my publications, you are agreeing to these terms. Any screenshots used here are courtesy of TradingView. I am just an end user with no affiliations with them. Information and quotes shared in this blog can be 100% wrong. Markets are risky and can go to 0 at any time. Furthermore, you will not share or copy any content in this blog as it is the authors' IP. By reading this blog, you accept these terms of conditions and acknowledge I am sharing this blog as my personal trading journal, nothing more.
XAUUSD Support & Resistance Levels🚀 Here are some key zones I've identified on the 15m timeframe.
These zones are based on real-time data analysis performed by a custom software I personally developed.
The tool is designed to scan the market continuously and highlight potential areas of interest based on price action behavior and volume dynamics.
Your feedback is welcome!
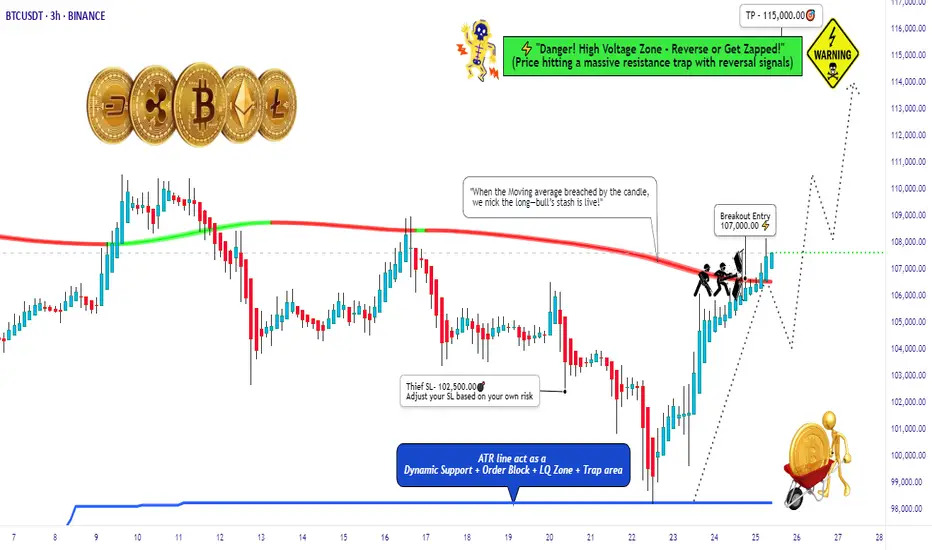
BTC/USD Thief Breakout at $107K – Eyeing $115K!🚨 Thief Entry Setup: BTC/USD Breakout Play 🚨
Overview:
Jump in after the $107 000 breakout—aiming for $115 000 with a tight “Thief SL” at $102 500. Adjust the stop‑loss to match your personal risk tolerance.
🧠 Setup Summary
Pair: BTC/USD
Entry trigger: Breakout above $107 000
Stop‑Loss: “Thief SL” at $102 500 (use your own risk‑based SL)
Target: $115 000
🎯 Why This Setup?
Clear breakout level at $107 000 = fresh momentum
Tight SL cushion (≈‑4.3%) = defined risk
Target ≈ +7.5% potential = strong reward-to-risk (~1.75:1)
📏 Risk Management Tips:
Only risk a small % of your capital—never exceed your comfort zone.
Move your SL to breakeven once mid‑target is hit to lock in profits.
Trailing your stop‑loss could secure bigger gains if BTC surges toward $115 000.
Bearish Signal | Technical + Custom AlgoSmart Trend Signal | Technical Analysis + Custom Algorithm
This signal is the result of a combination of classic technical trend analysis and a proprietary software I personally developed.
"US2000 Technical Play: Long Entry at Key Support"RUSSELL 2000 BULLISH BREAKOUT STRATEGY
*(High-Probability Swing Trade Setup on RUT/US2000)*
TRADE EXECUTION PLAN
ENTRY STRATEGY
Preferred Entry: Wait for pullback to 2170 support zone (15M/30M charts)
Confirmation Entry: Valid breakout above 2170 resistance (1H closing basis)
Order Placement: Use limit orders near support or stop orders above resistance
RISK PROTOCOLS
Stop Loss Placement: 2130 (swing low on 3H/4H timeframe)
Position Sizing: Maximum 1-3% risk per trade
Key Reminder: Strict risk management is essential for long-term success
PROFIT TARGETS
Primary Objective: 2230 resistance level
Alternative Approach: Trail stop loss if momentum weakens prematurely
Scalping Note: Focus exclusively on long-side opportunities in current market conditions
MARKET ANALYSIS
Technical Factors: Emerging higher low pattern, strengthening momentum
Fundamental Drivers: Supportive environment for small-cap equities
Sentiment Indicators: Retail positioning suggests room for upside
IMPORTANT WARNING
News Event Protocol: Avoid trading during high-impact announcements
Position Management: Adjust stops accordingly during volatile periods
Trading Discipline: No new entries when major news is pending
TRADING PSYCHOLOGY NOTE
This swing trade requires patience and discipline. Wait for proper confirmation signals before execution and maintain strict risk parameters throughout the trade duration.
ENGAGEMENT REQUEST
If you find this analysis valuable, please like and follow for more trade ideas. Share your perspective in the comments section.
(Disclaimer: This content is for educational purposes only. Trading involves substantial risk.)
NEXT MARKET ANALYSIS COMING SOON

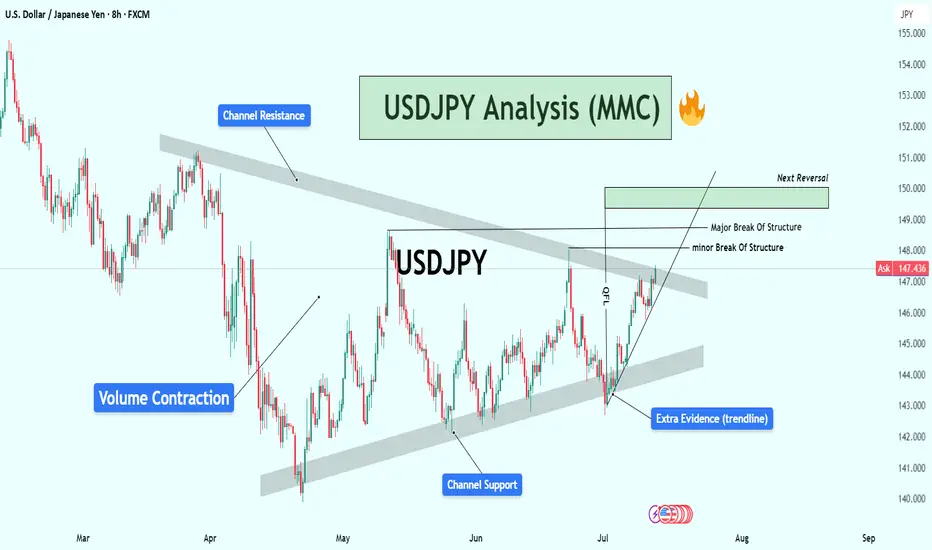
USDJPY Analysis : Major Move Loading Towards Target Zone🕵️♂️ Overview
The USDJPY pair is approaching a critical turning point within a well-established descending channel structure. After several months of corrective movement and internal structure shifts, the market is now displaying multiple layers of confluence pointing toward an impending major reaction or reversal. Let’s break down this chart step by step.
🧱 Market Structure Analysis
🔹 Descending Channel:
The entire chart is governed by a broad descending channel, with price making lower highs and lower lows since early March.
Each touch of the channel support has led to a bounce, and the price is now once again near channel resistance, creating a possible reaction zone.
🔹 Volume Contraction Phase:
In the mid-section of the chart, we observe volume contraction, indicating liquidity drying up and buyers/sellers entering a phase of uncertainty.
This contraction is typical in accumulation or re-accumulation phases, which often precede strong impulsive moves — exactly what followed here.
🧩 Structural Breaks and Trendline Clarity
🔸 Minor Break of Structure:
A recent high was taken out in early July, marking a minor break of structure (BOS), showing the first signs of bulls taking short-term control.
🔸 Major Break of Structure:
A more significant high (marked on the chart) has also been broken, confirming a major BOS — this implies institutional positioning or a shift in market sentiment.
🔸 Trendline Break – Extra Confirmation:
The bullish push came after breaking a clean internal trendline, which acted as diagonal resistance.
Once this trendline broke, price aggressively accelerated upward — this is a classic market maker cycle (MMC) Phase 2 (expansion) move.
📍 Confluence at Next Reversal Zone (149.00 – 150.00)
The green highlighted zone is the next potential area for bearish pressure to return, based on:
Key Supply Zone: Historical area where sellers previously dominated.
Channel Resistance Confluence: Top of the descending channel aligns with this zone.
Psychological Level: 150.00 is a major psychological round number — often attracts profit-taking and institutional activity.
Fibonacci (if plotted): Likely 78.6% – 88.6% retracement from last swing high.
Overextended Rally: Price has rallied strongly since early July with very little correction — it’s approaching exhaustion.
🔄 Market Maker Cycle (MMC) Alignment
This move perfectly reflects the Market Maker Cycle:
Accumulation: During volume contraction phase.
Manipulation: Fakeouts near channel support to trap shorts.
Expansion: Break of structure + trendline, aggressive rally.
Distribution (Next): Likely to occur at the 149–150 zone with a sharp rejection.
🧠 Trader’s Plan – What to Look For
📈 If Bullish:
Targets: 148.80 to 149.80 zone
Hold until rejection signs (bearish candles, volume spikes, divergences)
SL: Below recent swing low/trendline (~146.00)
📉 If Bearish (After Rejection):
Watch for:
Strong bearish engulfing candle or shooting star
RSI/MACD divergence (not shown but suggested)
Break of short-term ascending trendline
Targets: Back toward 145.50 or mid-channel (dynamic)
🔖 Summary
USDJPY is showing clear signs of bullish exhaustion near the upper channel resistance and major structure levels. If price respects this zone (149–150), expect a healthy corrective leg or full reversal. Multiple layers of technical evidence, including structure breaks, trendline breach, and MMC phases, are aligning for a high-probability play.
This is a textbook setup for experienced traders watching key zones with proper confirmations.
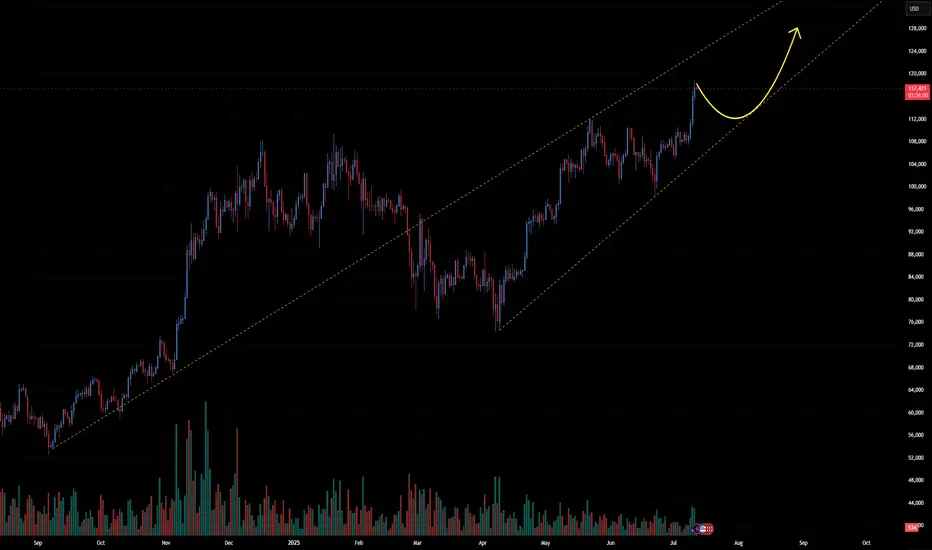
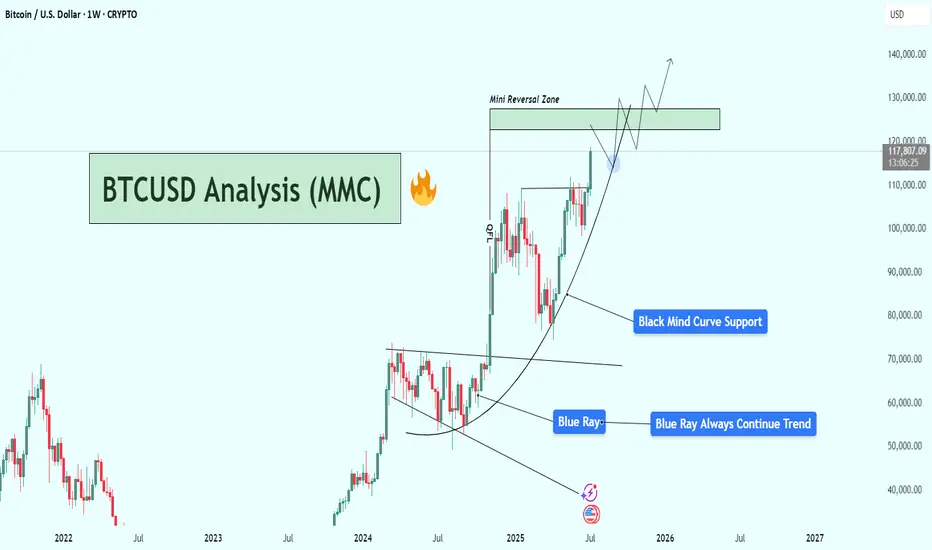
BTCUSD Weekly Analysis : Testing $130K Resistance + Next Target📌 1. Big Picture – Bitcoin is in a Parabolic Uptrend
This chart clearly shows that Bitcoin has shifted from a consolidation phase into a full-blown parabolic rally. That’s not just random growth — it’s an aggressive, momentum-driven market move that usually only happens during major bull cycles.
The curve shown in black — labeled “Black Mind Curve Support” — is your guide here. It's not a simple trendline. It shows how Bitcoin is accelerating upward, and this curve acts as a dynamic support. Every time price dips to it, buyers jump in fast — which shows strong bullish pressure and market confidence.
🔍 2. Blue Ray Broken = Trend Change Confirmed
Earlier, BTC was stuck under the Blue Ray, a long-term resistance trendline. As marked:
“Blue Ray Always Continue Trend”
That means, as long as price stays under it, the market is bearish. But guess what?
BTC broke above it — strongly.
That break confirmed a reversal in long-term structure, and it triggered this massive upward move. This breakout also aligned with a pattern of higher highs and higher lows, further confirming that bulls are now in full control.
🧠 3. Current Situation – Heading Into Mini Reversal Zone
Now BTC is trading around $117,820, and it's approaching the green box labeled Mini Reversal Zone — between $125,000 and $135,000.
Why is this area important?
It’s a psychological zone (big round numbers).
It lines up with historical resistance and previous supply zones.
It’s where smart money might take some profit, so we could see rejection or a short-term pullback here.
🎯 4. Two Scenarios to Watch
✅ Scenario A: Mini Pullback & Retest
BTC hits the Mini Reversal Zone → stalls → pulls back → retests the Black Mind Curve → bounces again.
That’s bullish and normal in a healthy uptrend. If you missed earlier entries, this pullback could be your golden opportunity.
🚀 Scenario B: Breakout of Reversal Zone
If Bitcoin breaks above $135K with strong momentum and closes the weekly candle high, we may see another parabolic rally toward $140K+.
This would mean even stronger buyer interest, possibly driven by FOMO, ETFs, or macro news.
📉 What Could Invalidate the Bullish Move?
Only if BTC:
Breaks below the Black Mind Curve, and
Starts closing weekly candles under $105K–$100K
That would mean the curve is broken, momentum is lost, and we might go into a consolidation or deeper correction.
But for now? No signs of weakness. Trend is strong, volume is rising, and price action is clean.
🧩 Summary of Key Levels
Type Level Notes
Curve Support Dynamic ($105K–$110K) Critical for trend continuation
Mini Reversal Zone $125K – $135K Watch for rejection or breakout
Bullish Target $140K+ If breakout holds above reversal zone
Trend Indicator Black Mind Curve As long as price rides this, bulls are in control
📌 Final Thoughts
This BTC chart isn’t just a random uptrend — it’s a well-structured parabola, powered by strong technical support and clean breakouts. Everything is lining up for a potential monster move, but don’t chase price blindly.
Watch the Mini Reversal Zone closely. If we see rejection, be ready to buy the dip. If we break through with volume — it’s 🚀 time again.
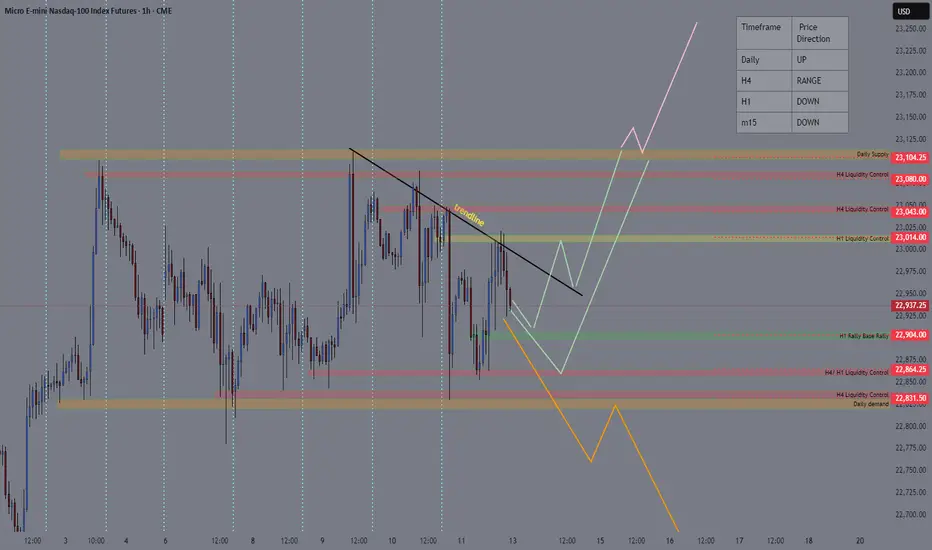
NASDAQ TRADING IDEA FOR 14-18 JULY 2025The price of NASDAQ is ranging between daily supply zone (23100) and daily demand (22830) and respecting trendline to find next liquidity control at h1 base at 22904 or H4/H1 liquidity control at 22864. I am looking for long opportunities at that area depend on how the price action for and wait confirmation before taking long position.
The price will continue to rise if daily supply breakout and form a new higher high at daily timeframe.
The market will shift direction if the daily demand breakout and I’m focusing to find opportunity taking short position at important key level/zone.
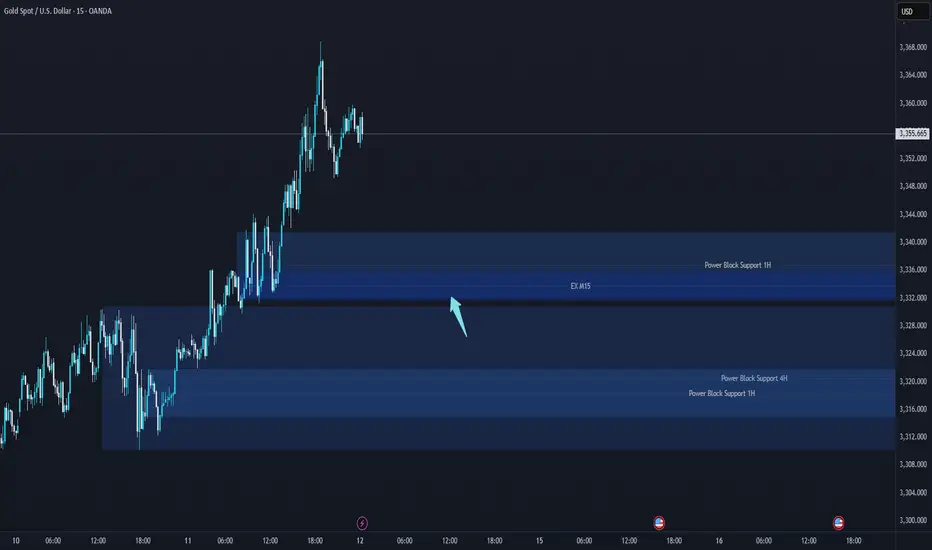
Gold – H4 Structure at Key Decision Point | July 14 Outlook🟡 Gold (XAUUSD) – July 14 Outlook | Key Reaction Ahead at 3366
Gold closed Friday at 3355.665 , after facing resistance from the H4 swing high (3366) .
While price failed to break that level during the session, the last H4 candle closed as a bullish spinning top , signaling indecision — but with slight bullish pressure.
As we head into Monday’s open, the next move could be pivotal in determining the direction of the upcoming H4 trend leg.
🔮 Key Scenarios to Watch
1️⃣ Bullish Scenario (Preferred Bias):
If the market opens above 3366 , creating a clean Break of Structure (BoS) , it would confirm the continuation of the H4 uptrend.
→ In this case, we will watch for a retest of the 3320 Order Block (OB) — a potential long setup zone.
→ If price gives another BoS after the first, it may also present a continuation entry opportunity, depending on structure.
2️⃣ Rejection / Bearish Case:
If the market fails to break 3366 , we’ll step back and observe how M15 reacts.
→ Consolidation could follow before any significant BoS.
→ In this scenario, patience is key — we’ll wait for either confirmation of a deeper pullback or a structure shift on lower timeframes.
3️⃣ Consolidation Possibility:
There’s also a strong possibility that price consolidates between the H4 swing high (3366) and the 3320 OB before making a structural decision.
→ A tight range can trap both buyers and sellers — so it’s crucial not to act prematurely.
🧭 Trade Bias Summary
✅ If BoS (above 3366):
→ Bullish bias confirmed
→ Look for long on OB retest (e.g., 3320 zone) or next M15 structure break
⚠️ If No BoS:
→ Step back, observe M15
→ Wait for structure clarity before forming bias
🔁 If Range Forms (3366–3320):
→ Stay out until market resolves direction
→ Let breakout + retest guide the next setup
🧠 Final Thoughts
This analysis is shared for educational and structural observation purposes only — not as trade advice or recommendation.
The goal is to track price behavior around key zones and adapt based on how structure confirms or invalidates bias.
📖 Let the market reveal its intention — not with emotion, but through structure.
We don’t predict the breakout — we prepare for both outcomes.
📘 Shared by @ChartIsMirror

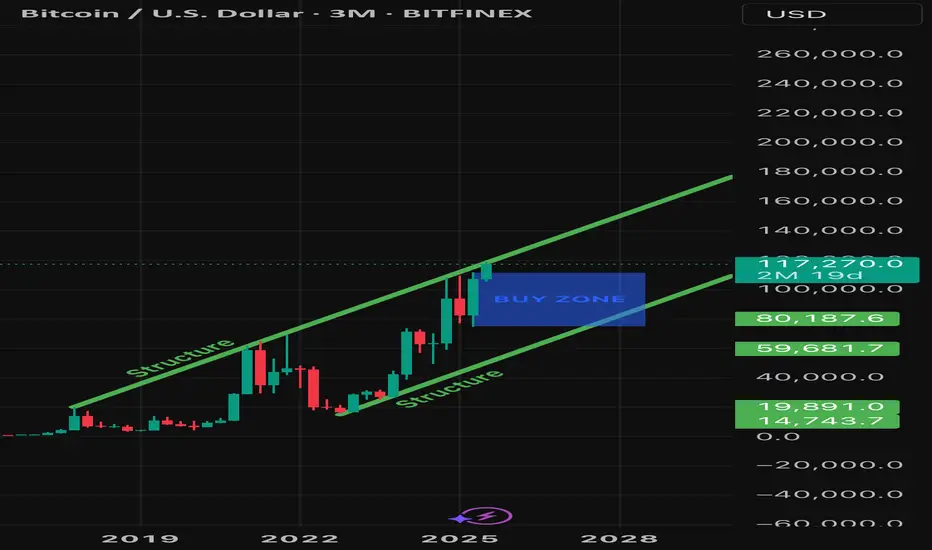
Bitcoin’s ForecastWho knows how high Bitcoin will go but my guess is between 300/350k. What I may know ahead of time is where price may fall, for the buy. I labeled the buy zone which I believe will trigger in January 2027 based off of the pattern Bitcoin has created. I’ve noticed a couple years ago that the best time to buy Bitcoin is in January, the year after being bearish. This is the pattern and you can check for yourselves: 3 years bullish, approximately 1 year bearish. January of 2027 may begin the next bull cycle that could last for 3 years. Stay tuned!
GBP/JPY Low Risk BUYS - SWINGLOW RISK TRADE
If you prefer not to swing you can scalp buys on the pullbacks throughout the week ahead.
GBP/JPY - BULLISH ENGULFING CONFIRMED
A+ SETUP since it has touched
and respected our area of interest.
SL - 185.599
TP1 - 190
TP2 - 192.799
TP3 - 194.681

Next target for the legendary Bitcoin: $143,000🚀 Keep buying the dips all the way to the top.
📈 Algo traders: lock your EAs on LONG.
Need one? Check the link in my bio 😉
#Bitcoin #CryptoTrading #BTC143K #BuyTheDip #AlgoTrading #EAs

EURJPY–trend continuation, engulfing candle .. the week of 14/07Friday’s candle engulfed 2 previous days of price action. I interpret this as strongly bullish, especially since this happened in an already nicely bullish trend. However, the room to the upside it not unlimited - the ATH is at 175.421. We are likely to see sideways price action there due to some profit taking and maybe even some selling. IMO there are 2 possible options to get a 2R return:
- we may get a pullback before the bullish trend resumes.
- we drop down to the H1 chart and look for an opportunity to go long.
Either way, in my opinion, the trade should be closed before the ATH.
This is not a trade recommendation; it’s merely my own analysis. Trading carries a high level of risk so carefully managing your capital and risk is important. If you like my idea, please give a “boost” and follow me to get even more.

USD WEAKNESS COULD TRIGGER COMMODITY/CRYPTO SURGEAlphaTrend is an advanced trading indicator that leverages proprietary tools, real-time data, and custom metrics to give traders a competitive edge. Designed for all experience levels, it works instantly—no advanced charting skills required.
ADVANCED and PRO versions are available. (See below)
🔍 How It Works
At the core of AlphaTrend is Dynamic Reversion Bands — a sophisticated real-time system that adapts to price action by automatically adjusting to evolving market conditions.
These bands act like a roadmap, helping traders identify:
Mean reversion trade opportunities
Trend strength
Emotion-driven market conditions (like FOMO)
The system is rooted in Mean Reversion Theory:
If an asset's price deviates significantly from its historical average, it tends to “revert” back to that average over time. Traders can use this behavior to spot potential buying or selling opportunities:
Overbought Conditions: If the price moves too far above the mean, it may signal a pullback—traders might sell or short.
Oversold Conditions: If the price drops well below the mean, it may be undervalued—traders might buy in anticipation of a bounce.
⚪🟡🔴🟡⚪ Dynamic DOTS
AlphaTrend visualizes market overextension through dynamic DOTS:
White DOTS = Average conditions
Yellow DOTS = Above average conditions
Red DOTS = Extreme conditions
The DOTS update in real time as the candle is forming—appearing, disappearing, and shifting color based on current intensity levels. Once the candle closes, however, the DOTS do not repaint. This ensures clarity and confidence in every signal.
This is crucial, as many indicators repaint and revise data after the fact, undermining traders’ trust. With AlphaTrend, once a candle closes, the data remains permanently fixed.
📊 Adaptability and Market Insight
AlphaTrend adapts to any timeframe, but performs best on longer-duration candles, where signals are fewer but more reliable. Multi-interval displays (e.g., 1hr, 4hr, Daily) are highly recommended. That being said it does tend to give strong signals on all time frames even down to 1 min candles.
The tool also integrates several intuitive market overlays:
Auto-generated support and resistance levels
Real-time supply and demand zones
Money flow tracking from institutions and banks