btc buy midterm"🌟 Welcome to Golden Candle! 🌟
We're a team of 📈 passionate traders 📉 who love sharing our 🔍 technical analysis insights 🔎 with the TradingView community. 🌎
Our goal is to provide 💡 valuable perspectives 💡 on market trends and patterns, but 🚫 please note that our analyses are not intended as buy or sell recommendations. 🚫
Instead, they reflect our own 💭 personal attitudes and thoughts. 💭
Follow along and 📚 learn 📚 from our analyses! 📊💡"
Beyond Technical Analysis

Interest rates unchanged, sticking to my bearish idea.Look at my other posts and you''ll understand as to why, I was telling everyone to sell. There was a small sellers trap, we pushed up, at that moment I already had closed my positions. Now we go down to the other key levels. I'm done till the end of August. Will still post my setups, but won't take any trades. Stay safe and keep your funds safe. Hella Love!

EURUSD – Post-FOMC Macro Compression in Play📉 EURUSD – Post-FOMC Macro Compression in Play
WaverVanir | VolanX Protocol | July 30, 2025
The recent Fed hold has added pressure to the euro as rate differentials remain in favor of the USD. On the chart, EURUSD failed to sustain above the 0.786 retracement level (~1.1476), with clear signs of exhaustion.
🧠 Thesis:
We may see a macro compression pullback with EURUSD potentially revisiting the baseline support zone at 1.08147, which previously acted as a long-term resistance-turned-support.
🔍 Technical Confluence:
Rejection near 0.786 Fib (1.1476)
No bullish breakout above 2023–2024 ceiling
Downside targets:
1.1070 → short-term support
🟡 1.0815 → baseline zone and decision point
🧠 Macro Overlay:
Fed is in pause-and-watch mode
ECB growth outlook is slowing
US inflation is stickier = USD strength persisting short term
📌 VolanX DSS Summary: Bearish structure developing. We favor tactical shorts on rallies toward 1.1470–1.15 with eyes on the 1.08 handle.
#EURUSD #FOMC #VolanX #WaverVanir #MacroTrading #ForexSignals #USD #ECB #RateDifferential #Fibonacci #SMC #Liquidity #ForexMacro

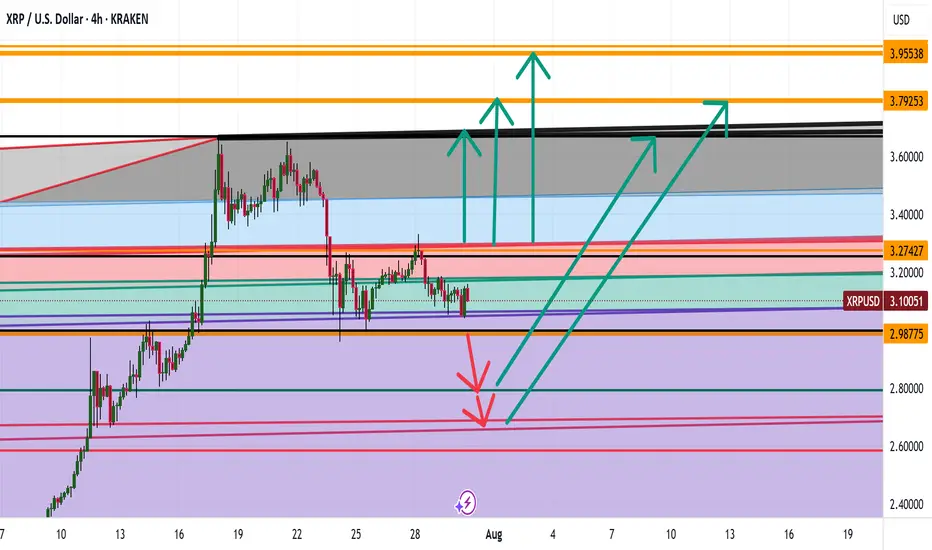
XRP WHERE ARE WE HEADED ? LEVELS TO LOOKOUT FORHey trading fam
So XRP is a fun one but based on BTC correcting and what we are seeing there are a couple thesis's that we currently have for it
Thesis 1: We break south from 2.98 lows: Levels to look out for:
2.80
2.70
2.68
Thesis 2: We break the highs of 3.29: Levels to look out for:
3.65
3.79
3.99
Trade Smarter Live Better
Kris
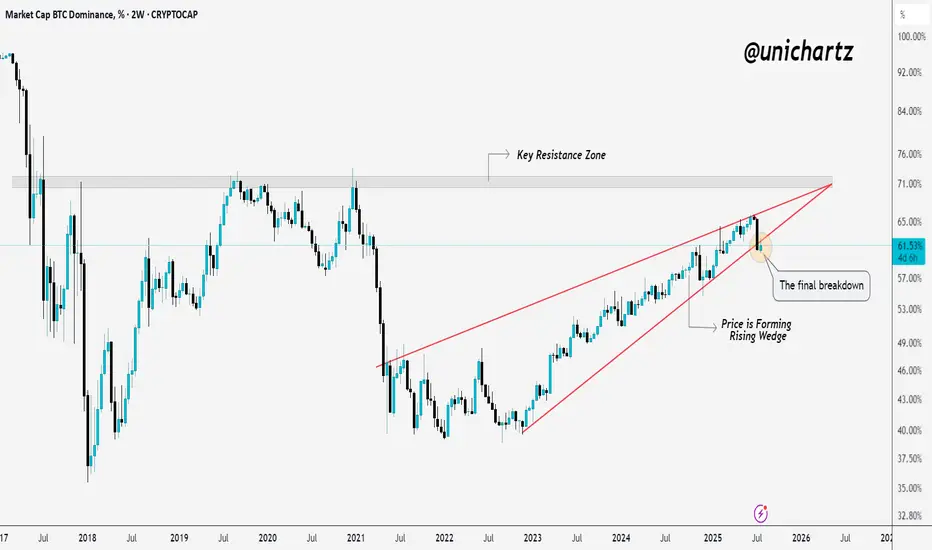
Final Breakdown from Rising Wedge – Alts About to Run?BTC dominance has been rising steadily inside a rising wedge, but now it looks like the structure is giving up.
Price just broke below the wedge, a move many traders watch as a potential shift in momentum.
If this breakdown holds, it could be the final breakdown before altcoins start gaining serious strength.
Eyes on alts, the rotation might be starting.
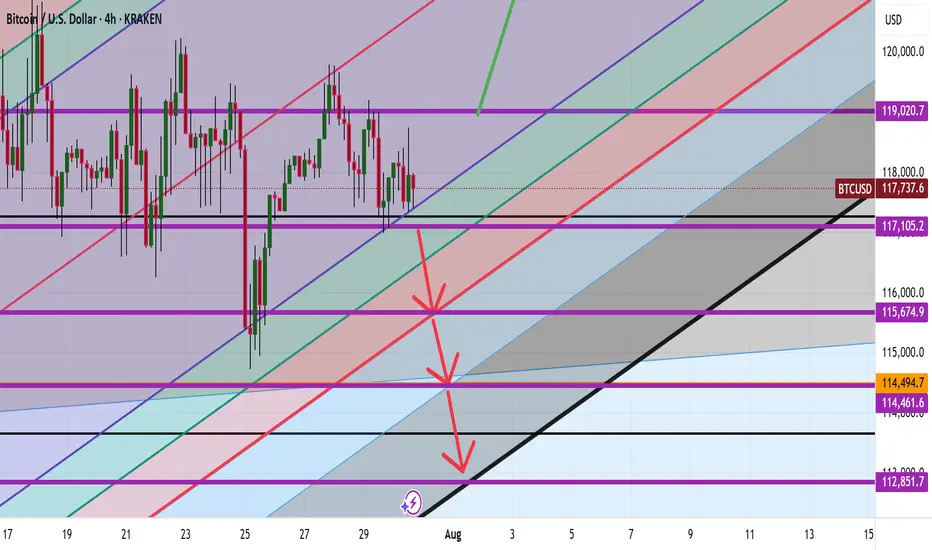
Bitcoin Are We Heading to 140K or 80K ??? Here is the Analysis Based on what is happening here is what we currently see with Bitcoin
Idea 1: If we can break 119K then here are the following levels Bitcoin can go to :
122K
126K
135K
140K
Idea 2: If we continue and break further bearish here are the levels BTC can go to
115,600
114,500
112,800
If we go below this level then a larger correction thesis would point us with a deeper bearish level
Happy Trading
Trade Smarter Live Better
Mindbloome Exchange
Kris
USD/ CAD Are We Heading to $1.46 Territory Watch OUT Afternoon Trading Family
Based on what we are seeing is a nice bullish run up to the following levels :
Levels To Watch For:
1) $1.39
2) $1.41
3) $1.43
4) $1.46
However be aware if we for whatever reason we sink back into the 1.35 territory then we could see a drop down to 1.34
Trade Smarter Live Better
Kris

Healthy Retest After Explosive Move – XRP Eyes More UpsideCRYPTOCAP:XRP broke out of a long accumulation range and is now coming back to retest that breakout level, a classic and healthy move.
If this retest holds, we could see the next leg up kick off soon.
Accumulated. Broke out. Now confirming.
DYOR, NFA

US100/NQ short idea PM session I expect yesterdays high to hold. For NQ reaching a discount, a 400 point move can happen. WATCH A 5m FVG formation for entry

AUD/USD ANALYSIS: WHERE ARE WE HEADED Good afternoon
Based on what we are saeeing with AUD/USD we see two options
1) Below .645 low then we can see a decent drop down to .635
2) If we can break the highs of .652 then a drive up to .65951 makes sense
Trade Smarter Live Better
Kris

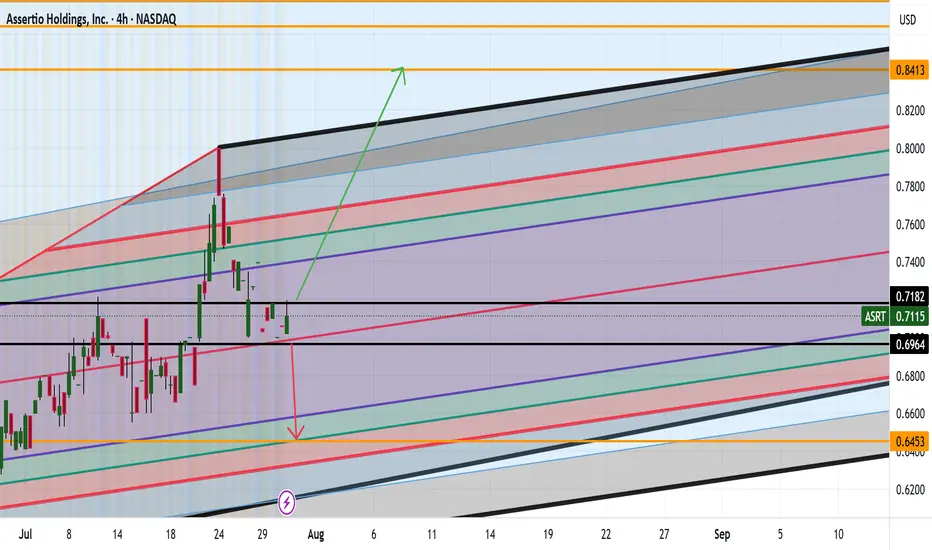
ASRT ARE WE HEADING TO .84CENTS AND HIGHER? Good afternoon Trading Family
So looking at ASRT we see two options here:
1) We break .71 cents high which then would give confirmation to a drive up to 84 cent range
2) We break below the .69 cent low which then would help us confirm a possible short down to .64 cents
Trade Smarter/ Live Better
Kris
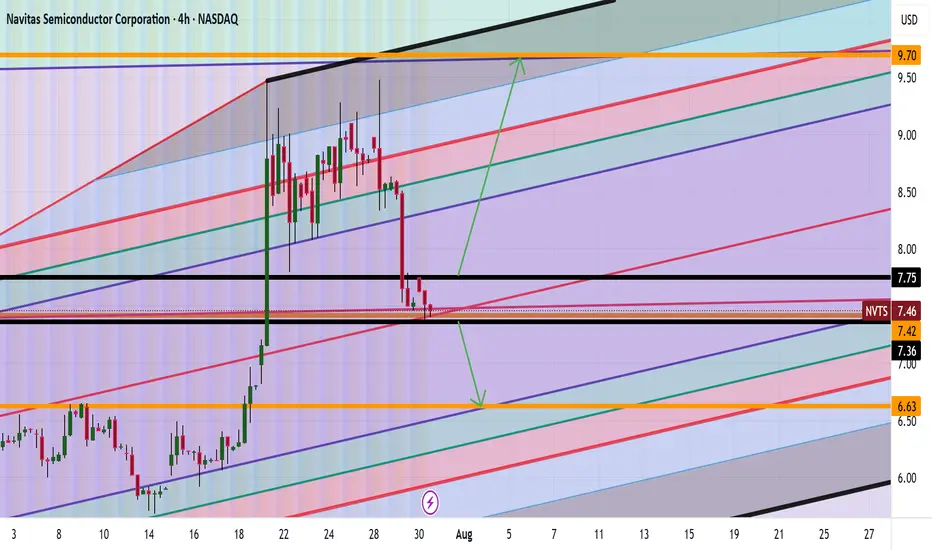
NVTS Analysis Are we Heading to $9+ Good afternoon Trading Family
Based on what we currently see with NVTS are two scenarios happening:
1) Above 7.80 highs we will thus be heading to the 9-9.7 range
2) Below 7.30 lows then we will be heading to the 6 dollar range
Happy Trading
Trade Smarter/ Live Better
Kris
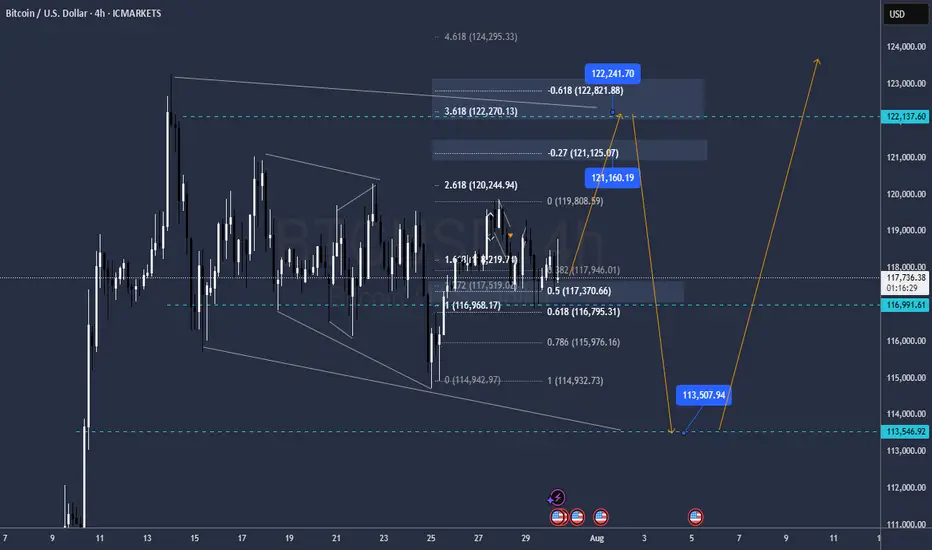
BTC FOMCOnce Again Ive the same view on BTC
There is a chance that it will go down now towards 113.500 straight so the internal buy towards 122.600 should be taken with low risk
if that level is reached the sell to 113.500 is prettyu much asured and also on 113.500 the buy to all time highs 127.500 and 133.000
GG
Gold May Dip Mildly Before US Data📊 Market Overview:
Spot gold is trading around $3,329/oz, up ~0.1%, supported by falling U.S. Treasury yields and a slightly weaker dollar, while investors await potential Fed dovish signals or rate cut in September . Meanwhile, easing U.S.–EU trade tensions weighed on safe-haven demand for gold.
📉 Technical Analysis:
• Key Resistance: ~$3,335–3,350 (recent highs and potential test zone)
• Nearest Support: ~$3,310 (previous stable support)
• EMA09 position: Price is above EMA9, indicating a mild bullish bias in the short term
• Momentum/Volume: RSI ~53 (neutral), MACD & StochRSI showing small buy signals. However, bullish momentum is fading, suggesting a possible mild pullback
📌 Conclusion:
Gold may dip modestly toward $3,310 if the dollar strengthens or if Fed rate-cut expectations recede. A break above $3,335–3,350 could pave the way for further gains, though current momentum remains insufficient to confirm a breakout.
💡 Suggested Trade Strategy:
SELL XAU/USD: $3,333–3,336
🎯 Take Profit: 40/80/200 pips
❌ Stop Loss: $3339
BUY XAU/USD: $3,310–3,308
🎯 Take Profit: 40/80/200 pips
❌ Stop Loss: $3305

We go up!Gold trapped all the buyers, flash crash like said yesterday, now we buy till 3400. Rates ain't getting cut, they already have gold at the price they want.

BONK | Waiting for DemandNo position yet—alerts are set for the FVG and HTF demand zone below. DOGE/BONK still showing relative strength, so patience here is warranted.
Plan:
Wait for price to tag HTF area of interest (FVG/demand).
Look for LTF trigger for a long entry.
Prefer clean sweep/reclaim for confirmation.
Reasoning:
BONK has strong momentum, but entry here is late after an extended run.
Letting the setup come to me reduces risk of getting caught in a local top.
DOGE/BONK relative strength signals not to rush.

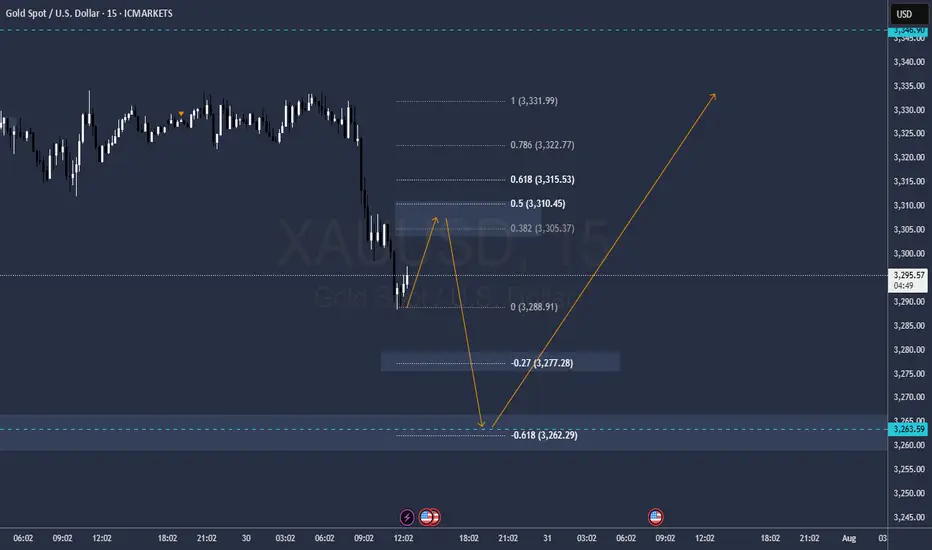
GOLD FOMC Ok it will be rising this previous FOMC 90 minutes but then will fall fasta and sharp
Sell levels 3305 / 3310 SL above .618
Targets 3277 3263
Reversal spectation on 3263 towars all time highs 3550 and 3650
Ethereum Analysis – July 30, 2025📊 Ethereum Analysis – July 30, 2025
Ethereum is currently testing a key descending trendline (blue line).
If the price breaks above this resistance and confirms with strong candlestick closures, there's a high probability that ETH will rally toward the ascending red trendline, acting as the next dynamic resistance.
🚀 A confirmed breakout could trigger a bullish continuation, opening the door for higher targets in the short term.
However, failure to hold above this level may result in a pullback or range-bound movement.
📌 Keep both the blue and red trendlines on your chart — they’re currently the most critical zones to watch for potential entries or exits.

HYPE | Sweep & Reclaim SetupPlan:
Watching for a sweep into the blue H4 Untapped Demand zone, then a reclaim of 41.237 (green line) to add longs.
Ideal target: new ATH and 55 extension.
If the blue zone fails or we can't reclaim 41.237, risk-off mode: equal lows at 30.6 could be the draw.
Reasoning:
A sweep into demand would reset local liquidity and trap late shorts.
Reclaiming 41.237 confirms a shift in momentum and invalidates the breakdown.
Structure is bullish above 41.237; below, risk increases for deeper downside.

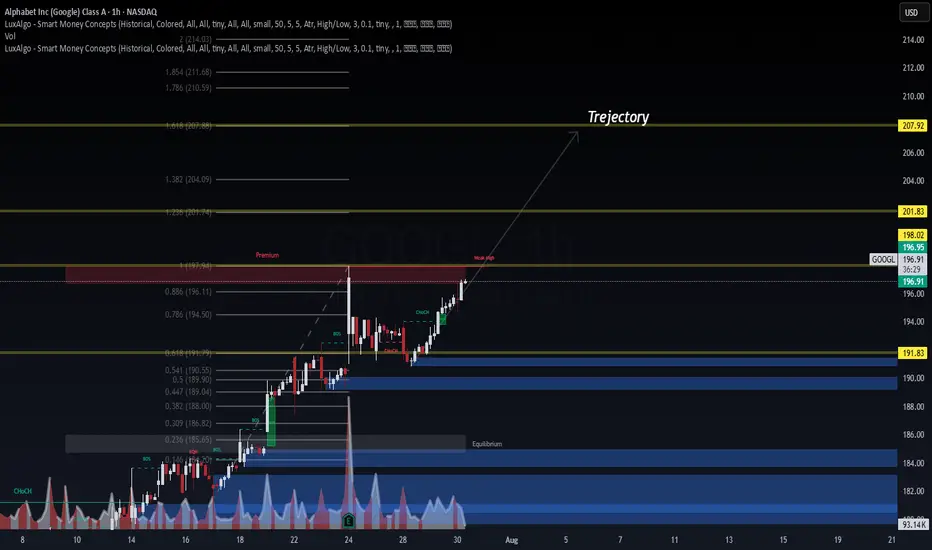
GOOGL Forecast – Dual AI Model Confirmation📊 GOOGL Forecast – Dual AI Model Confirmation
🔹 Posted by WaverVanir | VolanX Protocol
NASDAQ:GOOGL is showing strong bullish structure backed by both Smart Money Concepts (SMC) and AI model consensus.
🧠 VolanX AI Protocol Forecast (30-Day)
🎯 Target: $223.08 (+13.3%)
📈 Accuracy: 98.2%
📉 Drawdown: 0.00% (Backtested)
🧮 Sharpe Ratio: 7.70
🔵 Rating: Strong Buy
📉 WaverVanir DSS Model (Sentiment Score: 83)
🔸 30-Day Target: $198.47
🔸 Micro pullback expected before resuming uptrend
🔸 Ideal for refining short-term entries
🔍 SMC Structure:
BOS + CHoCH Confirmed
Premium zone at $197.94 cleared
1.236 Fib target: $201.83
1.618 Fib confluence: $207.92
Trajectory path = $223.08 if liquidity extends
📌 Strategy:
Entry: ~$196.95
TP1: $200.89
TP2: $223.08
SL: $188.80
R:R ~ 3.2:1
📢 Signal powered by WaverVanir DSS + VolanX Protocol
This is institutional-grade AI meets market structure.
#GOOGL #VolanX #WaverVanir #AITrading #SmartMoneyConcepts #SMC #Fibonacci #SwingTrade #Forecast #TradingView #StockSignals #InstitutionalAlpha #DecisionSupport #MachineLearning #DSS
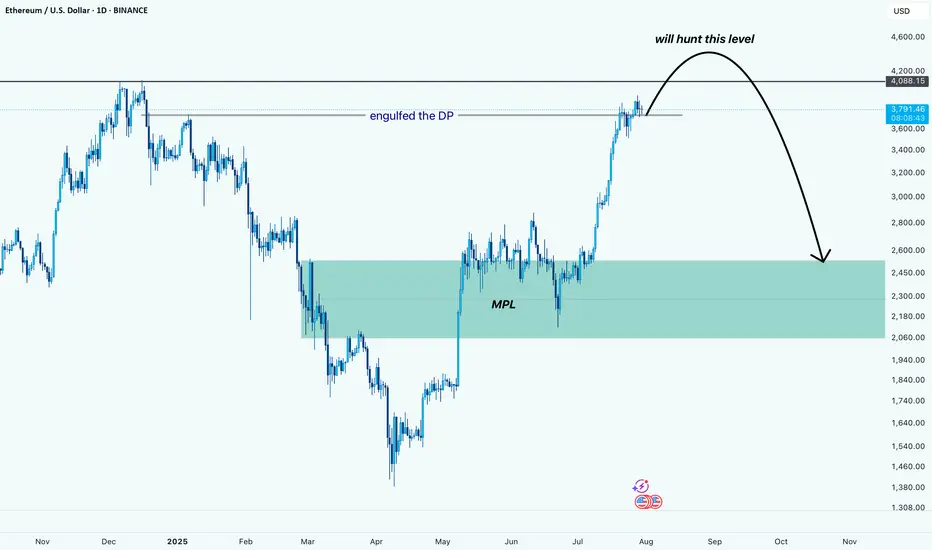
ETH (just a perspective): Potential Liquidity Grab Before DeeperPrice has engulfed the DP and is now pushing higher. Based on the current structure, it looks like ETH wants to hunt the liquidity resting above the $4,080 level.
After grabbing that liquidity, we might see a sharp reversal back down toward the MPL, which sits in the $2,100–$2,500 zone. This area is a strong demand zone and also where the most pain would be felt for late buyers, making it a key level to watch.
⚠️ This is not a prediction, just a perspective based on price behavior and structure.
DOGEUSD : Short-term longHere is the DOGEUSD level, which is likely to rebound on small timeframes. Those who trade intraday may wish to pay attention to it.
It will also be possible to look for a good long position from this level after volume has been accumulated on it.
