Ready to Raid the Chunnel? EUR/GBP Bullish Strategy Unveiled!🔐💸"The Chunnel Heist: EUR/GBP Bank Job with Thief Trading Style"💸🔐
Master Plan for Smart Money Robbers, Scalpers, and Swing Traders – Chart Ready Strategy to Boost Your TradingView Clout
🌍 Greetings, Global Hustlers & Strategic Traders!
Hola! Ola! Bonjour! Hallo! Marhaba! Ni Hao! Ciao! 👋🌟
Welcome to Thief Trading Style, where we treat the market like a high-stakes heist and every pip is precious loot! 🏦💰
This time, the target is the EUR/GBP Forex Vault – nicknamed "The Chunnel". It’s time to outsmart the system and execute a calculated plan that balances technical setups with a thief’s precision. 🐱👤🔥
🧠 Heist Blueprint: EUR/GBP Bullish Setup
🔍 Concept:
We're spotting a bullish bias with underlying momentum for a breakout heist.
This move is not for the faint-hearted – police traps (resistance zones) and bearish defenders are guarding the top, but our tools (TA + FA) suggest a strong breakout is brewing. ⚠️📊
🚀 Thief Strategy at a Glance:
🟢 Entry (Stealth Mode)
💥 "The vault is wide open – grab the bullish loot!"
Initiate BUY positions on pullbacks, using a layering/DCA style entry system.
📅 Recommended on 15m or 30m charts for precision.
🎯 Key Entry Zone: Recent swing lows/highs – the quieter, unguarded door into the vault.
🛑 Stop Loss (Silent Exit Strategy)
Set SL near the most recent 1D timeframe wick low – smart risk management is key.
Adjust size based on your risk tolerance, lot sizes, and how deep you’ve stacked the entries.
🏁 Target (Escape Route)
🎯 Main Target: 0.88000
But remember – sometimes it’s safer to exit early if things get hot. Use trailing SLs to secure your loot and dodge the heat. 🔥🚓
💸 Scalper Advisory – Quick Snatch & Run
Scalpers should only ride the bullish momentum.
If your wallet's heavy, jump in early. If not, trail the swing traders and plan your entry like a pro.
🛡 Use tight trailing SLs to keep your gains in the bag.
📈 Why the Chunnel Heist Now?
The market is shifting:
🔹 Overbought conditions
🔹 Signs of trend reversal
🔹 Bullish divergence + liquidity grab setups
🔹 Positioning based on COT reports, sentiment analysis, macroeconomic shifts, and intermarket flow
👉 Full FA/TA/COT breakdown liinkedd in the Klick 🔗🔗
📢 Heads-Up: News Alert 🚨
📰 Major news events ahead – stay sharp.
❌ Avoid fresh entries during high-impact announcements.
✅ Use trailing SLs to lock profits and reduce emotional exposure.
❤️ Support the Heist, Boost the Team
🔥 Smash the "Boost" button if you're down with the Thief Trading Style
– it powers our next robbery and keeps the strategy alive!
Each boost strengthens the team and spreads the loot. Let’s out-trade the market, not just survive it. 🚀💰
⚠️ Disclaimer (The Clean Getaway)
📌 This is an educational, entertainment-based strategic overview – not financial advice.
📌 Always do your own due diligence and trade based on your personal risk profile.
📌 Markets shift quickly – adapt, adjust, and don’t marry your trades.
💬 Leave a comment if you’re riding this plan or if you’ve got your eyes on the next target.
🎯 Follow for more Thief Trading Heists – the next plan drops soon!
Stay stealthy, stay profitable. See you at the vault! 🏦🐱👤💸
Beyond Technical Analysis

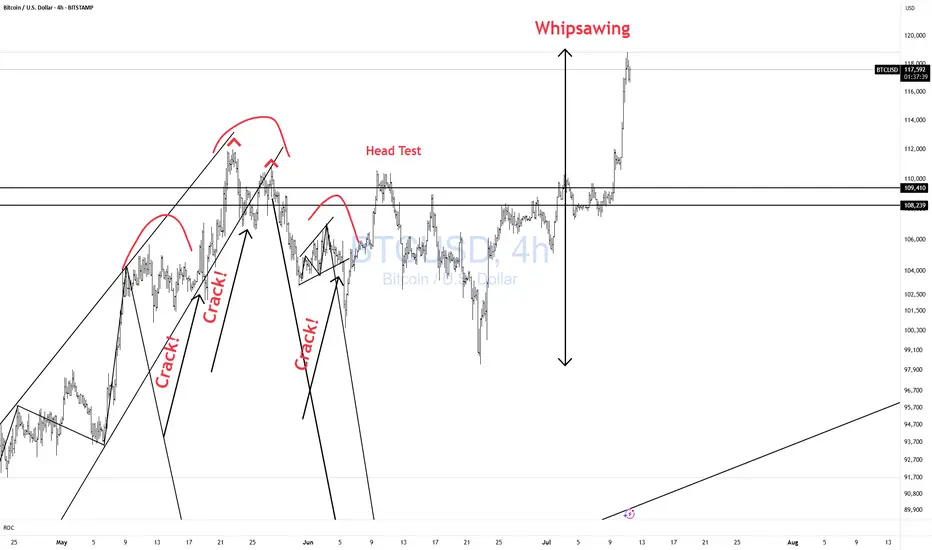
BTCUSD Whipsawing! CAUTION!Bulls CAUTION! Price is whipsawing all over the place.
Better to be out of the market wishing you were in than in wishing you were out!! Don't chase!!
ETHUSD Break- Test- GO!!! Nothing Changed! 3rd EditionI have been warning about this for some time. Please visit my previous two posts for more info and updates.
Magic!
Click boost, follow, and subscribe for more. Let's get to 5,000 followers ))

SOL — Breakout Watch & Range Play1. Watch for breakout above trendline
2. Hold support 151–147 for bullish scenario
3. Target: 168.4 (pre month high)
4. Stop: below 125.9 (pre month low)

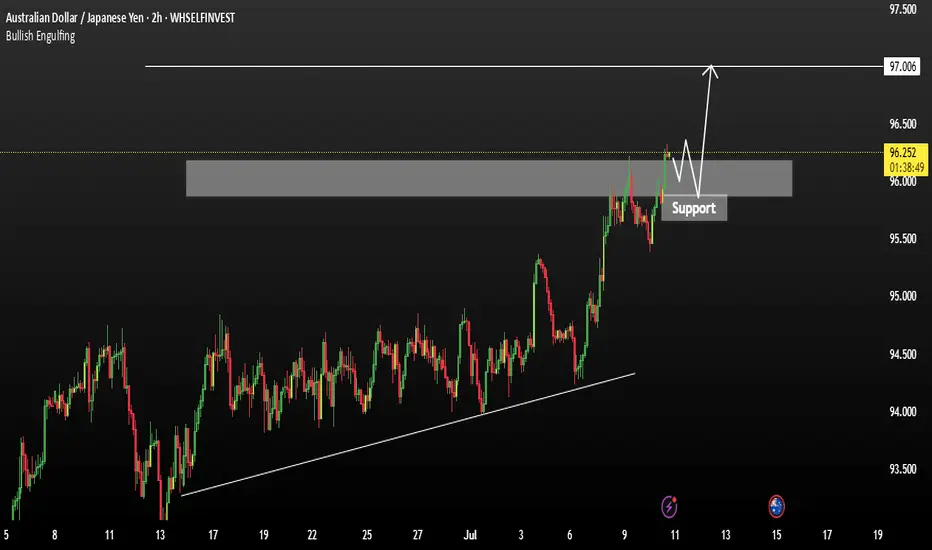
AUDUSD Technical Analysis: Bullish BreakoutAUDUSD has recently broken decisively above a key resistance zone that had previously cape price for several months. This bullish breakout followed a period of compression and range-bound price action, signalling strong accumulation and building momentum.
As long as price holds above the retested resistance zone, the bullish outlook remains intact. With the current structure and upward momentum, AUDUSD is likely to extend higher towards the next major target near 0.97006.
You can see more details in the chart Ps Support with like and comments for more analysis.
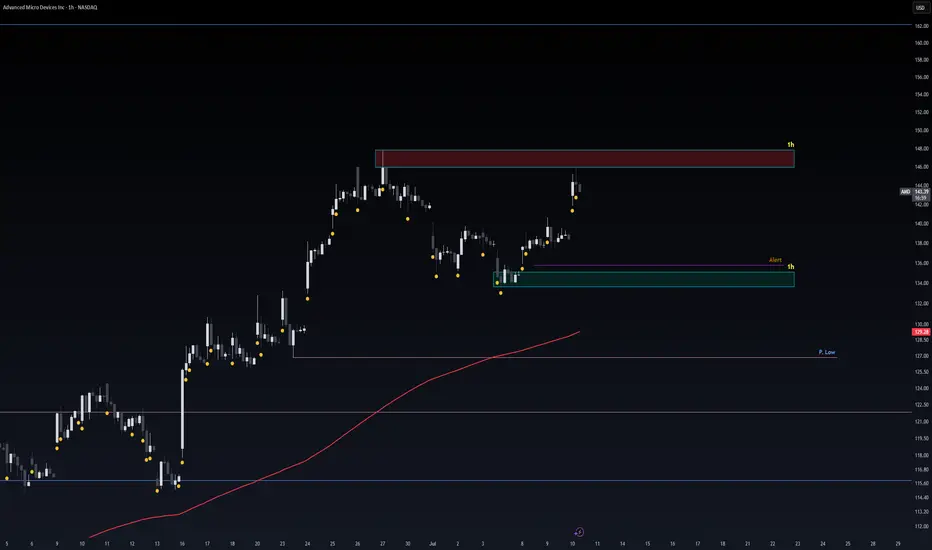
Safe Entry Zone AMDPrice Rejected From Resistance.
Safe Entry Green Zone.
Target after that 162$ price level.
Note: 1- Potentional of Strong Buying Zone:
We have two scenarios must happen at The Mentioned Zone:
Scenarios One: strong buying volume with reversal Candle.
Scenarios Two: Fake Break-Out of The Buying Zone.
Both indicate buyers stepping in strongly. NEVER Join in unless one showed up.
2- How to Buy Stock (safe way):
On 1H TF when Marubozu/Doji Candle show up which indicate strong buyers stepping-in.
Buy on 0.5 Fibo Level of the Marubozu/Doji Candle, because price will always and always re-test the
Take Care & Watch OUT !
GOLD Is About to CrushThe price is been ranging for more than 3 months , but with the bitcoin the scenario might change for its favor and the gold might crush for a while
CAD_JPY BULLISH BREAKOUT|LONG|
✅CAD_JPY broke the key
Structure level of 107.400
While trading in a strong uptrend
Which makes me bullish biased
And I think that after the retest of
The broken level is complete
A rebound and bullish continuation will follow
LONG🚀
✅Like and subscribe to never miss a new idea!✅
Disclosure: I am part of Trade Nation's Influencer program and receive a monthly fee for using their TradingView charts in my analysis.

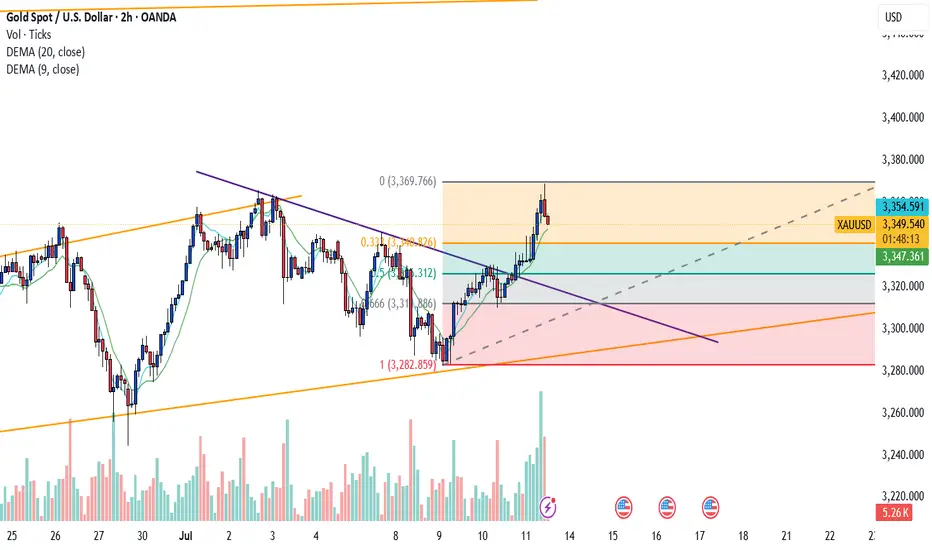
Reversal pattern. The price has tested $3,368.but failed to hold. A second failed attempt could form a double top—a classic bearish reversal pattern.

barrick, run it hotfiscal dominance adding downward pressure on dollar. long term chart look favourable with key fib levels being touched. added copper exposure in usa, abx has some legs

Safe Entry IONQGreen Zone is Safe Entry.
Stop loss below Green Zone (or blue line both are supports with 200MA below too).
Red Zone is Sell.
Note: each line(E.g. blue lines) acts as Strong Support/Resistance.
Note: 1- Potentional of Strong Buying Zone:
We have two scenarios must happen at The Mentioned Zone:
Scenarios One: strong buying volume with reversal Candle.
Scenarios Two: Fake Break-Out of The Buying Zone.
Both indicate buyers stepping in strongly. NEVER Join in unless one showed up.
2- How to Buy Stock (safe way):
On 1H TF when Marubozu/Doji Candle show up which indicate strong buyers stepping-in.
Buy on 0.5 Fibo Level of the Marubozu/Doji Candle, because price will always and always re-test the

WIF/USDT: A dog wif hat lost faith but may become Pehoenix soon WIF/USDT: A dog wif hat lost faith but may become Pehoenix soon
after a long lasting crash WIF started a decent move again
was heavyly rejected
in consolidation since then
building a "Falling Wedge"
the supposed breakout happend
but there is still way more to come
For this one I'm not going to explain everything in detail what me made find my BIAS, narrative etc.
But at least enough Information that should be "useful" or "work you must not do buy yourself then".
That could be the beginning of a race back to at least baseline or somehow below.
For now, the trade is only planed to TP 1. Also im already in.
I stepped in cuz:
- there are several FVGs on several timeframes. The price is likely to play them out and should than react that way. I followed them and we should be bullish now. One good argument is that the weekly bullish FVG keeps nicely respected, while the bearish monthly FVG is actually struggeling.
- very bullish Price Action on WIF
- the TP from the "Falling Wedge" alone would be 1.3943
So TP1 + 2 got really much conflunce. And 3 as well, tru pressure from the market. Maybe even higher, but im not that far yet.
I closed a WIF trade that evening, did the analysis after that, and just opened it again without trigger :D
But there are triggers and u should use them:
RB 1+2+3
Price Action
pullbacks into FVGs on 1h f.e.
"Hammer" candles with high Volumen
break of structure on a LTF
That was the second Idea i made here ever. So i'm happy you made it that far, thank you.
Also feel free to comment the trade/the writing style, question, whatever.
Sugartongue, and my hunger is still young. But I'll chase lights until the morning comes. And the world is flashing at the window.

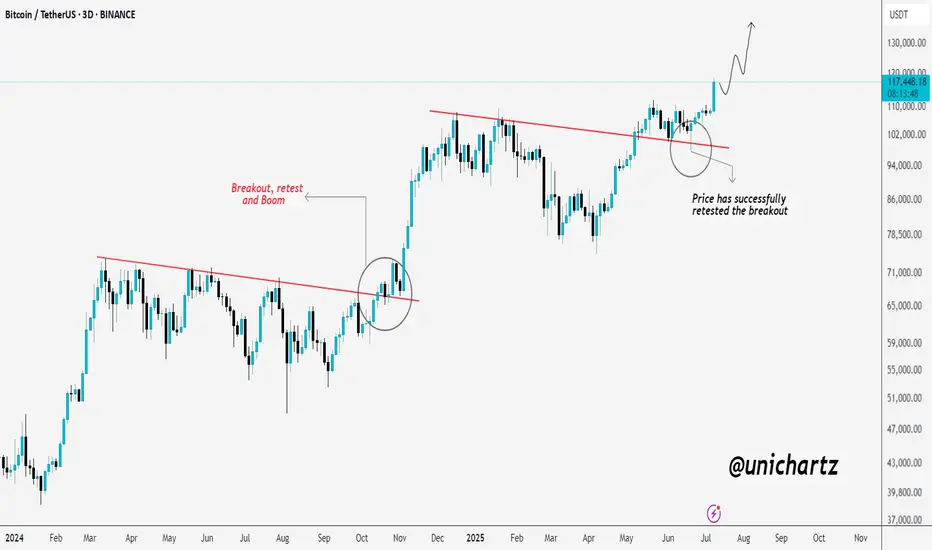
Bitcoin Looks Ready for LiftoffBitcoin is showing a textbook bullish continuation.
After breaking out of a long-term downtrend line, CRYPTOCAP:BTC came back for a clean retest — just like it did during the last breakout phase. That previous breakout led to a massive rally, and now we're seeing a very similar setup again.
The retest around $94K held perfectly, confirming strong demand and validating the breakout. Since then, price has pushed higher with momentum, now trading above $117K.
If this pattern continues to play out like before, Bitcoin could be eyeing $130K and beyond in the coming weeks.
The structure is strong, the trend is intact, and bulls are clearly in control.
EURUSD and Elliott Wave PrinciplesWe are currently on a Wave 5 that started when Wave 4(Red) completed. This 5th Wave expresses itself in 5 waves that are shown in Black. Our Wave 2 was a Zigzag and and we should expect a Flat correction for our Wave 4. When Wave 3 is complete an A Wave retests on the 261.8% Fib. level. Wave B goes beyond the end of Wave 3 and retests the confirms at the 423.6% Fib. level. This indicates the end of Wave B and the start of Wave C of the Flat, hence our Wave 4.

Is Gold (XAU/USD) Ready to Bounce? Bullish Setup on Key TrendlinHi traders! , Analyzing XAU/USD on the 1H timeframe, price is currently bouncing off a long-term ascending trendline, showing signs of a potential bullish continuation:
🔹 Entry: 3318
🔹 Take Profit (TP): 3424
🔹 Stop Loss (SL): 3207
After testing the ascending trendline multiple times, gold is once again showing bullish rejection near support. Price remains above the key trendline and is attempting to form a higher low within the broader uptrend.
The RSI is recovering from oversold territory (currently around 49), which suggests weakening selling pressure and possible buildup of bullish momentum.
If the structure holds, the target at 3424 aligns with a previous resistance area and a natural extension of the upward channel. The risk-reward is favorable with a strong technical confluence backing the setup.
⚠️ DISCLAIMER: This is not financial advice. Every trader is responsible for managing their own risk and strategy.

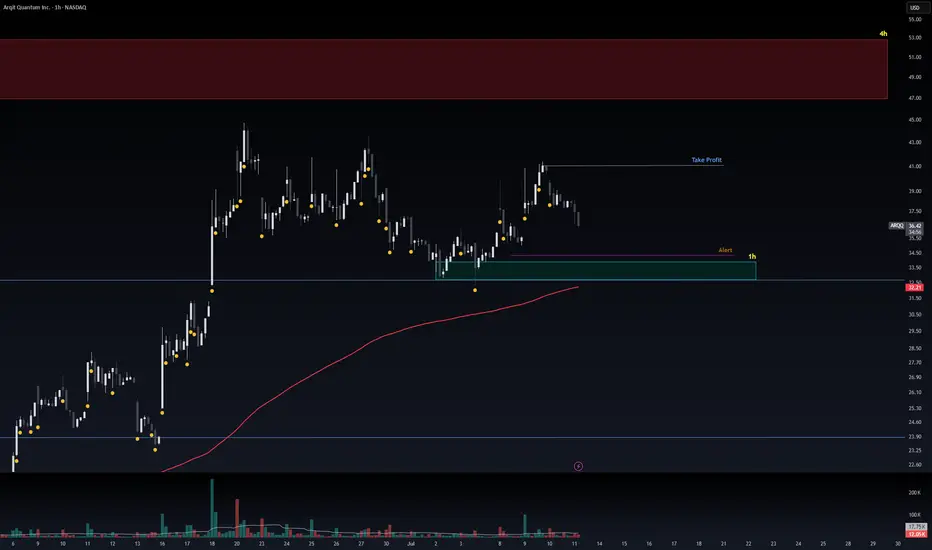
Safe Entry Zone ARQQGreen Zone is Safe Entry.
Stop loss below Green Zone (or blue line both are supports with 200MA below too).
Note: 1- Potentional of Strong Buying Zone:
We have two scenarios must happen at The Mentioned Zone:
Scenarios One: strong buying volume with reversal Candle.
Scenarios Two: Fake Break-Out of The Buying Zone.
Both indicate buyers stepping in strongly. NEVER Join in unless one showed up.
2- How to Buy Stock (safe way):
On 1H TF when Marubozu/Doji Candle show up which indicate strong buyers stepping-in.
Buy on 0.5 Fibo Level of the Marubozu/Doji Candle, because price will always and always re-test the
BTC AI Prediction Dashboard - 6h Price Path
BTCUSDT Forecast:
Crypticorn AI Prediction Dashboard Projects 6h Price Path (Forward-Only)
Forecast timestamp: ~13:45 UTC
Timeframe: 15m
Prediction horizon: 6 hours
Model output:
Central estimate (blue line): ~118,370
40% confidence band (light blue): 117,719 – 118,563
80% confidence band (dark blue): 117,040 – 119,652
Volume on signal bar: 331.4
Observations:
Price currently near central estimate, within 40% band
Continuation likely as long as price remains within 80% band
Moves outside 80% = low-probability fade or potential breakout
Model does not repaint. Forecast is fixed once published.

(probably) sell!Hi all. as you see my last idea on Gold was failed but I think market needs a new Lower Low. I wanna try this critical Top as a second option. Let see what happened.(wink)

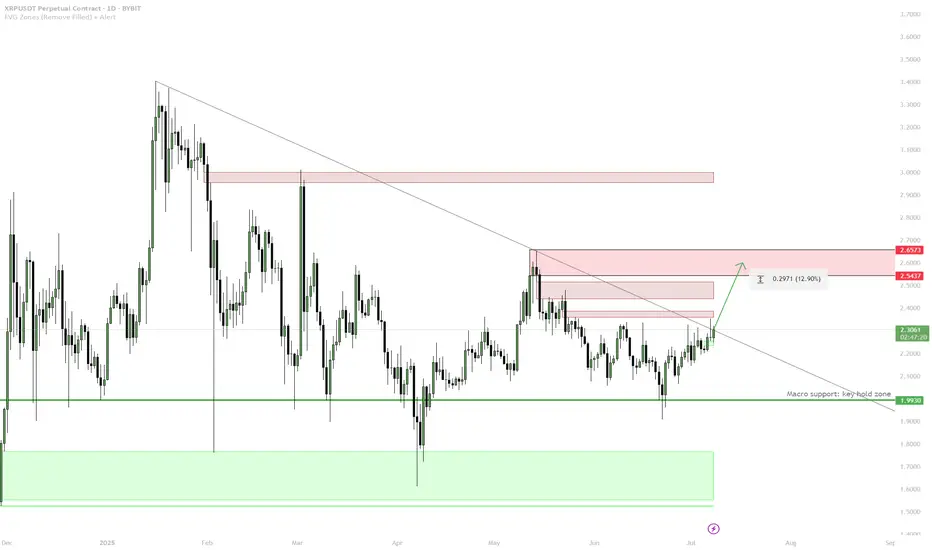
XRP — Macro Support Hold & Redbox Target1. Macro support (1.99) held — bullish bias
2. Enter on confirmed break and hold above trendline
3. TP1: 2.54–2.60 (first redbox)
4. TP2: 2.65+ (next supply)
5. Stop: Below macro support = invalid
Shorting Isn’t the Problem. Being a Psycho Bear Is.😵💫🪓 Shorting Isn’t the Problem. Being a Psycho Bear Is. 🔻📉
Hollywood is never wrong:
The genius from The Big Short is the psycho from American Psycho .
Same actor (C. Bale) — two sides of the same trader.
🎭 I made this chart because I see this often on TradingView:
People who prefer to short. Hoping for collapse.
Even Rooting for war. To Celebrating blood short profit.
Perma-bears who hate seeing price go up because they missed the trade.
Let’s be real — that’s not trading.
That’s emotional self-destruction masked as 'strategy'.
We just saw over $1B in shorts liquidated as Bitcoin ripped through $118K.
And still — some refuse to let go of their bias.
This chart says it all:
🔹 The "Smart Bear" — does research, uses structure, trades what’s real.
🔻 The "Psycho Bear" — needs things to collapse, just to feel right.
💔 And here’s the truth I want to share with you today:
If you catch yourself unable to celebrate others making money ,
If you feel angry when price pumps and you missed it,
If you’re wishing for collapse or chaos just so you feel seen...
Something’s off. That’s not trading. That’s pain talking.
Buying is more than just a trade — it’s hope , it’s optimism , it’s love .
Being bullish is an act of belief in the future.
And yes — we sometimes need to short. We do it with clarity.
But I’m a bull who sometimes must go short. Not a bear who wants the world to burn.
“We go long. We go short. But we never go blind.”
📉 Don’t let bitterness guide your charts.
📈 Let discipline, structure — and a bit of heart — guide you instead.
One Love,
The FXPROFESSOR 💙
⚠️ Disclosure:
Disclosure: I am happy to be part of the Trade Nation's Influencer program and receive a monthly fee for using their TradingView charts in my analysis. Awesome broker, where the trader really comes first! 🌟🤝📈

Cardano Forming Potential Reversal Structure Inside TriangleHello guys!
Cardano’s been stuck inside this big descending triangle for months. We had a fake breakout a while back that totally failed.
Now, price is back at support and showing bullish divergence. That’s usually a sign sellers are getting tired.
If buyers step in here, I’m expecting a move back up toward 0.67–0.70 (top of the triangle). But if it loses the 0.53 support, that setup’s off the table.
Bias: Leaning bullish
🎯 Target: 0.67–0.70
Invalidation: Clean break below 0.53
Let’s see how this plays out.

Opening (IRA): TLT Sept 19th 83 Short Put... for an .88 credit.
Comments: Camping out with a strike slightly below the 52-week low, where the options contract is paying a smidge more than 1% of the strike price in credit.
I don't really need more TLT, but wouldn't mind being assigned more at a lower price than the stock element of my covered calls.

UJ LongsLooking for today's daily bullish candle to make new high into NY session
I drew the CTL for clarity of what I am looking for my entry.
Need a break close above 4hr resistance
