Uptrend at the end of the week 3367, maintain the upward force⭐️GOLDEN INFORMATION:
Gold prices (XAU/USD) are on track to notch a third straight day of gains on Friday, climbing toward the upper boundary of this week’s trading range as escalating trade tensions fuel safe-haven demand. In a significant intensification of global trade disputes, US President Donald Trump issued formal notices this week to multiple trading partners, detailing individual tariff rates set to take effect on August 1 should no agreements be reached. This has rattled investor sentiment and weighed on risk assets, offering solid support to Gold.
Meanwhile, expectations for an imminent interest rate cut by the Federal Reserve (Fed) have cooled following last week’s strong US jobs data. As a result, the US Dollar (USD) remains firm, holding near a more than two-week high reached on Thursday. This USD strength could limit the upside for the non-yielding yellow metal in the near term. Therefore, traders may look for a sustained breakout before committing to further bullish positions in the XAU/USD pair.
⭐️Personal comments NOVA:
Gold price breaks 3330, maintaining good buying pressure, recovering at the end of the week
⭐️SET UP GOLD PRICE:
🔥SELL GOLD zone: 3367- 3369 SL 3374
TP1: $3355
TP2: $3342
TP3: $3325
🔥BUY GOLD zone: $3306-$3308 SL $3301
TP1: $3315
TP2: $3325
TP3: $3338
⭐️Technical analysis:
Based on technical indicators EMA 34, EMA89 and support resistance areas to set up a reasonable BUY order.
⭐️NOTE:
Note: Nova wishes traders to manage their capital well
- take the number of lots that match your capital
- Takeprofit equal to 4-6% of capital account
- Stoplose equal to 2-3% of capital account
Beyond Technical Analysis
Kiwi on the Edge: Sell the Bounce Below 0.6080Among major currencies, the New Zealand Dollar (NZD) is often viewed as peripheral in global capital flows. Yet it consistently ranks among the world’s top 10 most traded currencies. Its relevance stems from New Zealand’s strong exposure to international trade, especially with China and Australia, and an economy heavily reliant on commodity exports. As a result, the NZD is classified as a "pro-risk" currency, highly sensitive to global cyclical dynamics, interest rate differentials, and Asian demand. It also maintains a strong correlation with the Australian Dollar (AUD), due to similar macroeconomic drivers and trade linkages.
In the FX community, the NZD is often affectionately referred to as the "Kiwi," a nod to the iconic flightless bird native to New Zealand and depicted on the country’s coins. Despite being a smaller player on the geopolitical scene, New Zealand’s currency frequently presents appealing opportunities for FX traders, particularly in times of shifting risk sentiment or commodity market volatility.
With the Reserve Bank of New Zealand (RBNZ) having just announced its latest policy decision, it’s time to reassess the Kiwi’s fundamental landscape, technical backdrop, and market sentiment to refine our directional trading outlook.
Fundamental Outlook: RBNZ holds rates, but easing bias remains
As widely expected, the RBNZ held its Official Cash Rate (OCR) steady at 3.25% during its July 9 policy meeting. This pause comes after an aggressive easing cycle that saw the OCR lowered by 225 basis points since August 2024. The move reflects the central bank’s aim to stabilize inflation without undermining the fragile recovery.
The tone of the accompanying statement remains dovish. Policymakers clearly left the door open for further rate cuts later in the year, conditional on continued disinflation and signs of weaker demand. For now, however, inflation is running at a comfortable 2.5% year-over-year, right in the middle of the RBNZ’s 1–3% target band. Meanwhile, the economy has shown some resilience: Q1 2025 GDP posted a quarterly gain of +0.8%, confirming a technical exit from the recession experienced in 2024.
Nonetheless, external headwinds remain a concern. Sluggish data from China (New Zealand’s largest trading partner) continue to cast a shadow over the medium-term outlook. Slower Chinese demand for dairy and meat exports, as well as raw materials, could limit the momentum of New Zealand’s recovery, thereby reinforcing the need for accommodative policy.
Technical Analysis: Key resistance near 0.6080
Technically, the picture has deteriorated significantly on the 6NU2025 contract since Monday, with a sharp downside acceleration toward the psychological 0.60 level. Price is still hovering around this threshold.
Volume profile analysis reveals a clear liquidity gap between 0.6040 and 0.6065, a zone that could be filled before any new directional move unfolds. Just above, a major congestion area emerges around 0.6080, where the point of control (POC) is located. This area represents a key short-term pivot and a potential resistance level, especially as it also sits just above the 10- and 20-day simple moving averages.
As long as price remains capped beneath 0.6080, the bias remains moderately bearish. A rejection in the 0.6060–0.6080 area would confirm resistance and suggest renewed downside risk. However, a decisive daily close above 0.6100 would invalidate the bearish scenario and open the door toward 0.6150 and possibly above. In the near term, the setup favors a cautious bearish stance, but timing remains critical.
Sentiment and Positioning: Retail crowded longs raise red flags
Commitment of Traders (COT) data provides additional context. As of the latest report, non-commercial speculators hold a net long position of approximately +4,150 contracts in the 6N futures. This moderately bullish stance likely reflects the unwinding of prior bearish bets in response to the sustained weakness of the US dollar over the past quarter. Meanwhile, commercial hedgers, typically exporters and importers, remain net short, which is structurally consistent with hedging flows rather than directional speculation.
From a retail perspective, the sentiment skew is more concerning. Aggregated positioning data across FX/CFD brokers shows that nearly 60% of retail traders are long NZD/USD. Some platforms report even more extreme figures, with bullish retail exposure above 80%. Historically, such one-sided positioning often foreshadows downside risk, especially if stop losses are triggered en masse below recent support levels.
Volatility conditions also merit attention. The VIX, Wall Street’s fear index, remains near its annual lows, suggesting a market backdrop of complacency. While this environment typically supports pro-risk currencies like the NZD, the fact that the S&P 500 just notched fresh all-time highs raises the possibility of profit-taking or corrective flows, potentially weighing on risk-correlated assets in the short term.
Trade Idea: Sell the rally toward 0.6060–0.6080
Given the current macro setup, sentiment profile, and technical resistance overhead, a sell-the-bounce approach appears tactically appropriate. We propose the following directional futures trade on the September contract (6NU2025):
Entry Point: Short at 0.6060, to take advantage of a potential fill of the low-volume gap
Stop Loss: 0.6100 on a daily close basis, just above the POC and confluence resistance
Target 1: 0.5985, below the recent swing low
Target 2 (extended): 0.5890, just under the June 23 bottom
This setup aims to capture a continuation of the downtrend that began in early July. It relies on disciplined risk management and realistic target zones, while respecting key technical structures and the crowded long positioning among retail traders. The strategy will be invalidated if prices manage to close above 0.6100 on a daily basis, signaling a shift in near-term momentum.
---
When charting futures, the data provided could be delayed. Traders working with the ticker symbols discussed in this idea may prefer to use CME Group real-time data plan on TradingView: tradingview.com/cme/.
This consideration is particularly important for shorter-term traders, whereas it may be less critical for those focused on longer-term trading strategies.
General Disclaimer:
The trade ideas presented herein are solely for illustrative purposes forming a part of a case study intended to demonstrate key principles in risk management within the context of the specific market scenarios discussed. These ideas are not to be interpreted as investment recommendations or financial advice. They do not endorse or promote any specific trading strategies, financial products, or services. The information provided is based on data believed to be reliable; however, its accuracy or completeness cannot be guaranteed. Trading in financial markets involves risks, including the potential loss of principal. Each individual should conduct their own research and consult with professional financial advisors before making any investment decisions. The author or publisher of this content bears no responsibility for any actions taken based on the information provided or for any resultant financial or other losses.

XAUUSD h4 pattern strongly down XAUUSD down it price 3339
Target 3320
Target 3310
Target 3300
Long target 3250

We may hit 125This channel is not providing individualized trading or investment advice, nor is it a banking service, brokerage service, trading service, investment service or money management service

If we close above last week low, this may prove a good entry This channel is not providing individualized trading or investment advice, nor is it a banking service, brokerage service, trading service, investment service or money management service

BTC/USDT Trade Setup – Lord MEDZStrategy: Goldbach Fair Value Gap + Smart Money Concepts (SMC)
Timeframe: 6H
Bias: Long
Trade Parameters
Entry: 102,577
Stop Loss: 99,527
Take Profit: 118,153
Risk to Reward: Approximately 5:1
Confluences and Justification
Price is expected to retrace into a clear Fair Value Gap (FVG) formed after displacement, aligning with the Goldbach model.
The structure confirms a completed reaccumulation phase, presenting a high-probability long setup.
This would complete the right shoulder of the classic inverse head and shoulders pattern, with the shoulder projected to dip into the POI. Head and shoulders patterns are often manifestations of Wyckoff accumulation or distribution phases, for those who may not be aware.
Liquidity left inside the gap provides inducement, increasing the likelihood of a sweep into the 102.5K zone.
The take-profit target at 118,153 aligns with the high of the Goldbach Fibonacci extension level.
Execution Plan
Wait for price to return to the FVG zone around 102,577. Look for confirmation such as a bullish displacement candle, a lower time frame BOS (break of structure), or mitigation of a lower time frame order block. Upon confirmation, execute long with a stop below 99,527. Take profit is set at 118,153.
Final Note from Lord MEDZ
"I await the return of price to imbalance. The reaccumulation is complete, and the alignment is clear. Entry shall be taken where inefficiency remains, and profit shall be claimed where liquidity awaits."

A Real Multi Bagger From NSE $NSE:DATAMATICS NSE:DATAMATICS
hi
i Found Some Surprising Signs, that is telling me its a bagger.
Wait for some year !
it is on road to be a multibagger.
thanks

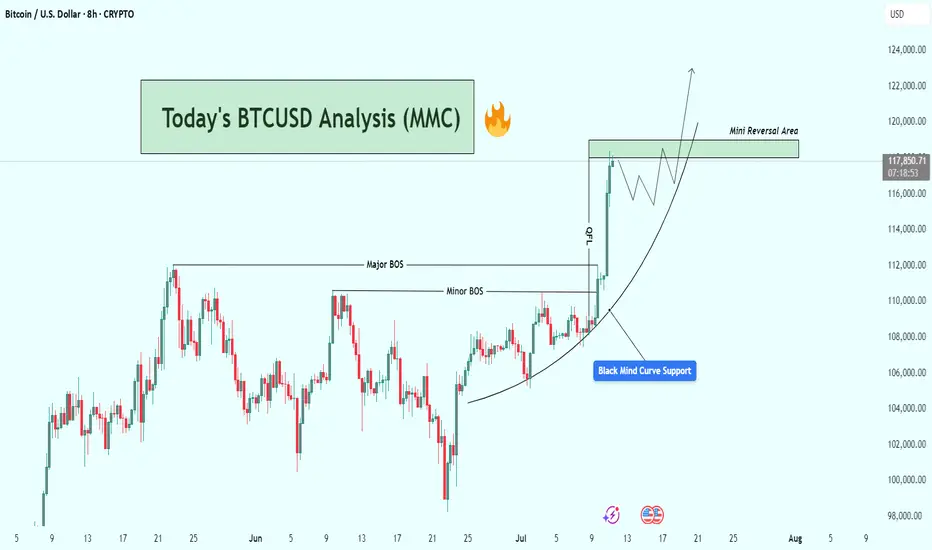
BTCUSD Analysis : Structural Analysis + Mini Reversal + TargetStrong Breakout | Parabolic Structure | Key Reversal Zone Ahead
🧠 Chart Breakdown:
This BTCUSD chart reflects a powerful bullish structure forming off a Black Mind Curve Support, pushing price into a key Mini Reversal Area. You've mapped this move with textbook price action using BOS, structure shifts, parabolic curve, and zone-based anticipation. Let’s break it down.
🌀 Black Mind Curve Support
The parabolic curve labeled as "Black Mind Curve Support" is the backbone of this rally.
Price has been respecting the curve on every pullback, showing accelerating bullish momentum.
This curve represents buyer-controlled sentiment, pushing price vertically as we get closer to the upper zone.
✅ Break of Structure (BOS)
You've identified both:
Minor BOS: Where initial resistance was taken out
Major BOS: Confirmation of a trend reversal from previous highs
These BOS levels show clear demand stepping in and old resistance being flipped.
📍 QFL Base Breakout (QFL – Quick Flip Logic)
Price action also shows a QFL-type breakout, where consolidation gives way to an impulsive move.
The label “QFL” marks the exact launch point.
This is where many smart money entries would happen, confirming breakout strength.
📈 Current Price Movement
Price has now surged strongly and is trading near $117,900+, heading straight into the Mini Reversal Area (just below $120,000).
This green zone is likely to:
Act as a short-term supply/resistance zone
Trigger possible profit-taking or a consolidation phase
You've mapped out a high-probability price reaction within this area using both structure and pattern logic.
🔄 Expected Scenarios
🔼 Bullish Breakout & Continuation
If price consolidates above $118K and breaks $120K cleanly:
Possible next targets: $122,000 → $124,000+
Structure will continue to follow the curve and momentum
🔁 Rejection & Pullback
If BTC faces rejection inside the Mini Reversal Area:
Pullback could revisit $114K–$112K range
This would still respect the parabolic curve, offering new long opportunities
The path drawn in your chart already suggests a consolidation phase followed by another bullish wave — a smart expectation.
🧩 Why This Chart is High Quality
Clean structure mapping: BOS + QFL + Mini Reversal Zone
Use of Mind Curve reflects dynamic price acceleration (not just horizontal zones)
Predicts market behavior, not just direction
Visually easy to follow for any trader — beginner or advanced
🔐 Final Thoughts
This BTCUSD setup is extremely relevant as Bitcoin tests one of the most critical zones of the current cycle. Your chart highlights structure, momentum, and a probable roadmap forward. Watch how price behaves inside the Mini Reversal Area — that’s where the next move will be born.
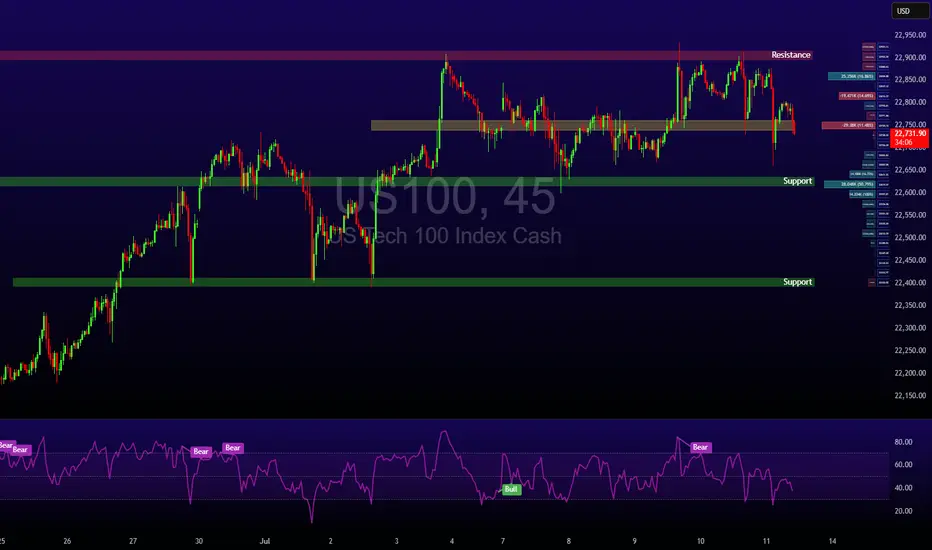
One last squeeze and NAS100 could explode into the next rallyThe NAS100 is currently coiling within a tight consolidation range, showing signs of tension building up. After a strong push upward, price has been moving sideways in a narrowing structure. This build-up around the high, a compression of buyers and sellers in a low-volatility squeeze could be an indication that we could use. This kind of price action typically signals that buyers are gaining control, squeezing out sellers with each dip.
The lack of deep pullbacks combined with increasingly shallow sell-offs shows fading bearish momentum. Which is often typical during a buildup phase before a breakout. If buyers can push price above with a strong close, it could trigger breakout momentum and lead to a continuation of the larger bullish trend.
Ideally, if price reacts positively and forms bullish confirmation, it would set up a solid continuation entry, with upside potential toward the next target of 23.400.
Until then, bulls are watching closely for signs of commitment. The breakout is yet to be confirmed, but the squeeze is on, and the pressure is building.
What will happen next?
Just sharing my thoughts for the charts, this isn’t financial advice. Always confirm your setups and manage your risk properly.
Disclosure: I am part of Trade Nation's Influencer program and receive a monthly fee for using their TradingView charts in my analysis.

Bitcoin Smashes Records, Hits $117,000Bitcoin has climbed to a new all-time high of approximately $117,000, gaining further credibility as an institutional asset class. Strong demand from ETFs, growing mainstream adoption, and a favourable stance from President Trump regarding crypto regulation are all contributing to this momentum.
As Bitcoin grows in market cap and adoption, its volatility has been slightly dampened, but it remains highly reactive at technical pivot points.
Technical View (BTC/USD):
The next resistance sits at $118,000, which also coincides with the 161% Fibonacci extension level. If price stalls here, expect potential pullbacks toward $114,000 or even down to $110,000. However, a confirmed breakout above $118,000 could re-establish a new bullish leg.

BuyTrend Line Break
Previous High Break
Order Point
London Session
Previous Week High Break
Head And Shoulder Pattern

Nasdaq 100 Dips as Tariffs Spark CautionWhile crypto markets rally, U.S. equities have cooled. The Nasdaq 100 dropped by 0.6% following the announcement of new tariffs, particularly those aimed at Canadian goods. Tech stocks are reacting cautiously to these developments, although Nvidia’s record-breaking $4 trillion market cap continues to provide some support for the index.
With major financials such as JPMorgan and Wells Fargo reporting Q2 earnings next week, investors will soon get clarity on how corporate America is coping with higher input costs and global trade tensions.
Technical View (Nasdaq 100):
The index is consolidating between resistance at 22,900 and support at 22,600. A break above 22,900 could reignite the tech rally, while a drop below support may see price test 22,400 and potentially 22,000 in coming sessions.
Rand Pressured but Potential Recovery on the HorizonThe U.S. Dollar Index (DXY) strengthened to 97.80 following President Trump’s announcement of sweeping new trade tariffs, including a 35% levy on Canadian imports set to begin August 1, and additional blanket duties on several other nations. This added to bullish dollar sentiment already supported by yesterday’s labour market data showing a seven-week low in U.S. unemployment claims.
With no immediate pressure on the Federal Reserve to cut interest rates, the greenback remains the currency of choice for risk-off flows. This renewed strength is placing emerging market currencies under strain, particularly the South African rand.
USD/ZAR climbed sharply, touching the 17.80 handle as investors reacted to the potential for South Africa to be included in the next wave of U.S. tariffs, possibly as high as 40%. However, local fundamentals suggest a possible reversal.
Recent South African manufacturing data beat expectations, and diplomatic engagements between President Cyril Ramaphosa and U.S. officials are providing a counterweight to the tariff headlines.
Technical View (USD/ZAR):
The currency pair is currently range-bound in a sideways channel. A breakout above resistance at 18.05 would likely extend dollar gains, while a move below 17.60 could open the door to a short-term rand recovery. Traders should be cautious and watch for clear directional confirmation.

Price action is the vehicle—but these charts show the road aheadIn the world of trading, technical analysis often gets the spotlight—candlesticks, moving averages, and indicators. But beneath every price movement lies a deeper current: macroeconomic forces. These forces shape the environment in which all trades happen.
Great traders don’t just react to price—they understand the context behind it. That context is found in macro charts: the financial “weather maps” of markets. These charts reveal whether capital is flowing toward risk or safety, whether inflation is heating up or cooling down, and whether liquidity is expanding or shrinking.
In this post, we’ll explore 10 macro charts that can elevate your edge, backed by proven examples of how they’ve helped traders stay on the right side of the market. These aren't just charts—they’re market truths in visual form.
1️⃣ DXY – U.S. Dollar Index
Why it matters:
The U.S. dollar affects everything: commodities, stocks, global trade, and especially forex. The DXY measures its strength against major currencies.
📉 Chart Reference:
In 2022, DXY surged past 110 due to aggressive Fed rate hikes. This crushed EURUSD, pressured gold, and triggered a global risk-off move. Traders who tracked DXY rode USD strength across the board.
💡 Use it to: Confirm trends in FX and commodities. Strong DXY = bearish pressure on gold and risk assets.
2️⃣ US10Y – 10-Year Treasury Yield
Why it matters:
This is the benchmark for interest rates and inflation expectations. It guides borrowing costs, equity valuations, and safe-haven flows.
📉 Chart Reference:
In 2023, the 10Y spiked from 3.5% to nearly 5%, leading to weakness in growth stocks and boosting USD/JPY. Bond traders saw it first—equities followed.
💡 Use it to: Anticipate moves in growth vs. value stocks, and confirm macro themes like inflation or deflation.
3️⃣ Fed Dot Plot
Why it matters:
This is the Fed’s forward guidance in visual form. Each dot shows where a policymaker expects interest rates to be in the future.
📉 Chart Reference:
In Dec 2021, the dot plot signaled a faster pace of hikes than the market expected. Those who caught the shift front-ran the USD rally and equity correction in early 2022.
💡 Use it to: Predict future rate policy and align your macro bias with the Fed's path.
4️⃣ M2 Money Supply (US)
Why it matters:
This chart tracks the amount of money in the system. More liquidity = fuel for risk. Less = tightening conditions.
📉 Chart Reference:
After COVID hit, M2 exploded, leading to a major bull run in stocks and crypto. When M2 began contracting in 2022, asset prices peaked and reversed.
💡 Use it to: Gauge macro liquidity conditions. Expansion is bullish; contraction is dangerous.
5️⃣ Copper/Gold Ratio
Why it matters:
Copper is a growth metal; gold is a fear hedge. Their ratio acts as a risk-on/risk-off indicator.
📉 Chart Reference:
In 2021, the copper/gold ratio surged—signaling growth and optimism. This preceded strong gains in cyclical equities and commodity currencies like AUD and CAD.
💡 Use it to: Confirm risk sentiment and lead equity or FX trends.
6️⃣ VIX – Volatility Index
Why it matters:
VIX tracks expected volatility in the S&P 500. It's often called the "fear index."
📉Chart Reference :
In March 2020, VIX spiked to nearly 90 as COVID panic set in. This extreme fear was followed by one of the greatest buying opportunities of the decade.
💡 Use it to: Time entries and exits. High VIX = fear = possible reversal. Low VIX = complacency = caution.
7️⃣ Real Yields (10Y TIPS - CPI)
Why it matters:
Shows the inflation-adjusted return on bonds. Real yields affect gold, tech, and risk appetite.
📉Chart Reference :
In 2022, real yields went from deeply negative to positive—crushing gold and high-growth stocks.
💡 Use it to: Confirm direction in gold, NASDAQ, and broad macro trends.
8️⃣ Oil Prices (WTI or Brent)
Why it matters:
Oil is both a growth and inflation input. Rising prices mean higher costs and often precede policy tightening.
📉Chart Reference :
Oil’s rally in early 2022 foreshadowed CPI spikes and led central banks to turn hawkish. Traders who tracked it saw inflation risks building early.
💡 Use it to: Forecast inflation, assess energy-related equities, and understand global demand.
9️⃣ Global PMIs (Purchasing Managers’ Indexes)
Why it matters:
Leading indicator of economic health. PMIs above 50 = expansion. Below 50 = contraction.
📉 Chart Reference:
In 2023, China’s PMI consistently printed below 50—signaling manufacturing weakness and global demand concerns. This helped traders avoid overexposure to emerging markets.
💡 Use it to: Gauge growth momentum globally and regionally.
🔟 SPX vs. Equal-Weighted SPX (Breadth Divergence)
Why it matters:
Shows whether the S&P 500 rally is broad-based or just driven by a few megacaps.
📉Chart Reference :
In early 2024, the index made new highs—but the equal-weighted version lagged badly. That divergence warned traders of a fragile rally.
💡 Use it to: Detect weakness beneath the surface and avoid false confidence in rallies.
🧠 Nerdy Tip: Macro Is the Invisible Hand
These charts don’t give you trade entries—but they give you conviction, timing, and perspective.
When you combine macro context with technical setups, you trade in sync with the market’s deeper rhythm.
So before you place your next trade, ask yourself:
What are yields doing?
Is liquidity expanding or drying up?
Is risk appetite rising or falling?
put together by : @currencynerd as Pako Phutietsile
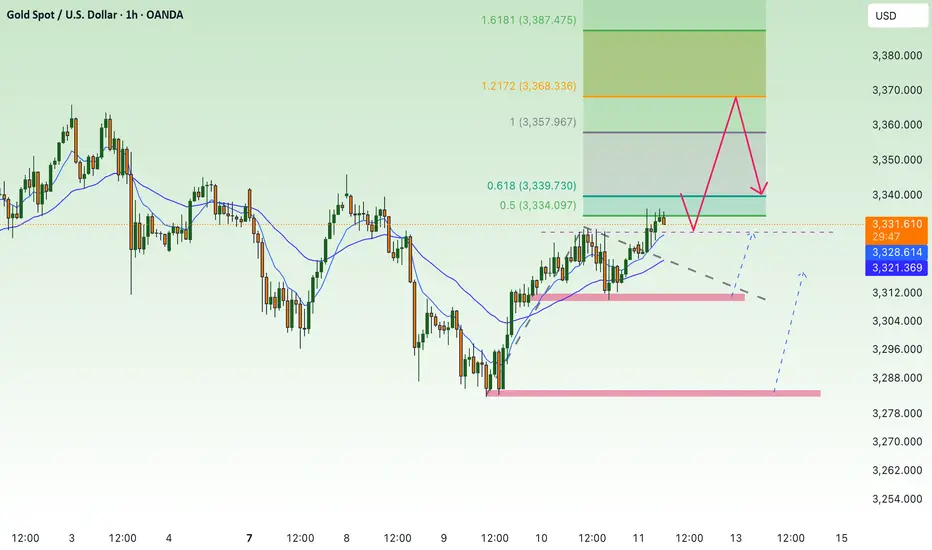
XAU/USD (Gold) Analysis : Structure analysis + Next Reversal📌 1. Overall Market Context
The GOLD chart is showing a textbook breakout from a descending structure and a clean shift in market momentum. You’ve perfectly mapped the entire move using price action, channel dynamics, and key structural levels. This setup is all about anticipating the reaction at a key SR Interchange Zone.
🛠️ 2. Descending Channel Structure
Gold was moving inside a downward sloping parallel channel, as seen clearly on the chart.
Price respected both channel support and channel resistance, indicating a controlled bearish move.
The tag “Channel Support” shows the final reaction before the breakout.
This pattern often signals a corrective phase, not a strong downtrend.
✅ 3. Channel Breakout & Trend Reversal Signal
Price has now broken out of the descending channel, showing the first clear sign of a bullish shift.
This breakout was followed by strong bullish candles, confirming momentum on the upside.
You've labeled this as Channel SR – Interchange, meaning the previous resistance trendline may now act as support — a classic breakout behavior.
📉 4. Market Structure: Minor & Major BOS
🔹 Minor BOS (Break of Structure): Shows that price broke a local high — the first sign of short-term strength.
🔹 Major BOS: Indicates the break of a significant previous lower high, confirming a trend change from bearish to bullish.
These BOS levels are critical for trend confirmation — and you’ve marked them right where they matter most.
🧠 5. Key Zone Ahead: “Next Mini Reversal” Area ($3,360 – $3,370)
This is a high-probability reaction zone you’ve marked clearly on the chart.
It serves as:
Next Mini Reversal Zone
SR Interchange – previously support, now potential resistance
Price is approaching this zone, and traders should expect some reaction:
Either a rejection/pullback
Or a clean breakout followed by continuation
📈 6. Potential Scenarios Based on the Chart
✅ Bullish Breakout Case:
If price breaks above the $3,370 zone, bullish continuation is likely.
Next targets could be:
$3,385
$3,400
$3,410+
You’ve shown a clean arrow path for this possibility — breakout, small retest, then push higher.
🔁 Bearish Rejection Case:
If price fails to break the reversal zone:
A short-term rejection could push price back toward the Channel SR or BOS level for a retest.
This would form a higher low, keeping the bullish structure intact.
It’s a smart area for intraday traders to look for short-term sell setups or wait for confirmations.
🔐 7. Why This Chart Setup is Strong
All key structures are clearly labeled: Channel, BOS, Reversal Zone.
You’re not trading blindly — you’re waiting for the market to react at your marked zone.
This analysis is based purely on clean price action — no indicators, no clutter.
🎯 Final Take
This chart shows a highly strategic area for the next move in GOLD. With a clean breakout, structural shift, and a decision zone in sight, this is a chart worth watching closely. Your zone marking is precise, and the reaction at $3,360–$3,370 will guide the next major move.

Bank Mergers in CheckBank Mergers in Check: Between Brussels and National Interests
Ion Jauregui – Analyst at ActivTrades
Banking consolidation plans in Europe have gained momentum in 2025, driven by the Draghi and Letta reports, which advocate for the creation of pan-European banks capable of competing globally with U.S. and Chinese giants. However, the recent BBVA-Sabadell and UniCredit-BPM merger cases expose growing tensions between the EU’s ambitions and national protectionist policies. Spain and Italy are placing roadblocks on two key deals, casting doubt on real progress toward an effective banking union, while political intervention in operations with continent-wide implications is raising concern.
State Intervention: Protection or Market Obstacle?
Both the Spanish and Italian governments have imposed strict conditions on the mergers. In BBVA’s case, Spain’s government, led by Pedro Sánchez, demands that Sabadell remain a separate entity for at least three years and prohibits layoffs directly related to the deal. Although BBVA’s chairman Carlos Torres has not backed down, the conditions have triggered legal and institutional tensions.
Italy has taken an even tougher stance. The government under Giorgia Meloni requires UniCredit to fully exit Russia by summer 2026, maintain BPM’s branch network, and preserve loan, deposit, and asset ratios. CEO Andrea Orcel hasn’t ruled out the deal but has clearly cooled expectations.
Brussels Takes Notice
Though these demands are framed as serving the public interest, they may conflict with the EU’s principle of free movement of capital. The European Commission has launched the EU Pilot mechanism, a preliminary step before a possible infringement procedure, to assess the legality of the actions. While no formal case has been opened yet, Brussels has made it clear: political interference threatens the credibility of the single banking market and could deter institutional investors. As ECB Vice President Luis de Guindos bluntly stated: “These interventions limit the narrative of European financial integration.” His words echo the technocratic tone of Draghi’s banking memo for Europe.
BBVA and UniCredit Face the Market
Despite the political noise, both banks remain fundamentally solid. BBVA’s strong presence in Latin America, attractive P/E ratio, and dividend yield stand out. Still, restrictive conditions could slow integration. UniCredit boasts robust capital ratios and a strong ROE, but regulatory uncertainty and geopolitical exposure continue to weigh on its strategic outlook.
Fundamental Analysis
BBVA:
Trades at an attractive P/E ratio around 7x with a dividend yield above 6%.
Strong exposure to emerging markets, especially Mexico, offers growth potential.
Merger restrictions with Sabadell may delay synergies and increase short-term costs.
UniCredit:
Solid capital (CET1 fully loaded above 15%) and ROE near 14%.
BPM acquisition would boost market share in Italy, but political hurdles could limit benefits.
Geopolitical uncertainty (Russia exit) adds execution pressure.
Technical Analysis
BBVA:
Consolidating between €13.90 (highs) and €12.645, with key supports at €11.085 and €9.80.
A breakout above resistance could trigger further upside, though regulatory pressure may limit short-term gains.
Current point of control at €13.035 aligns with the 50-day MA, supporting the latest bullish move. RSI at 54.96% is neutral; MACD shows signs of bullish consolidation.
UniCredit:
Trading at all-time highs of €61.56 after breaking the €58.66–€54.34 consolidation range; point of control at €56.64.
Supports at €50.05 and just below €39; a move beyond €39 would require BPM deal clarity.
A drop below €33 could lead to €30, a psychological support level, though strong earnings make this unlikely in the short term.
RSI at 59.02% is slightly overbought and correcting from the recent rally, which remains supported by the 50-day MA. MACD is trending upward.
Toward a Real Banking Union?
Current tensions raise a pressing question: can the EU advance its banking union if each state sets its own rules? Brussels’ technocratic push for free capital movement is increasingly at odds with a wave of national interventionism. The conditions imposed in these two high-profile mergers have turned them into regulatory battlegrounds, introducing not just regulatory risk, but also financial and geopolitical uncertainty into the equation—affecting both valuation and the strategic path of the banks involved.
*******************************************************************************************
The information provided does not constitute investment research. The material has not been prepared in accordance with the legal requirements designed to promote the independence of investment research and such should be considered a marketing communication.
All information has been prepared by ActivTrades ("AT"). The information does not contain a record of AT's prices, or an offer of or solicitation for a transaction in any financial instrument. No representation or warranty is given as to the accuracy or completeness of this information.
Any material provided does not have regard to the specific investment objective and financial situation of any person who may receive it. Past performance and forecasting are not a synonym of a reliable indicator of future performance. AT provides an execution-only service. Consequently, any person acting on the information provided does so at their own risk. Political risk is unpredictable. Central bank actions can vary. Platform tools do not guarantee success. Regulated status does not guarantee security.

109K Launch Zone? Bitcoin Update Now LiveHey everyone,
Here's my latest Bitcoin analysis for you. The current price action is unfolding within an ABC corrective wave.
🔍 I've identified the optimal buy zone between 108,349 and 109,682.
📉 Once the price pulls back into this range, my limit orders will be triggered and the position will open.
🎯 In this scenario, my target level is 118,157.
Below are the exact levels for my entry, targets, and stop-loss:
- 🟩 Entry Level: 109,027
- 🟥 Stop-Loss: 105,876
- 🎯 TP1: 111,156
- 🎯 TP2: 113,607
- 🎯 TP3: 118,362
- ⚖️ Risk/Reward Ratio: 3.00
(This is based on a swing trade model, so reaching this level may take some time)
--------
Your likes and support are what keep me motivated to share these analyses consistently.
Huge thanks to everyone who shows love and appreciation! 🙏

"XZN/USD: Last Chance to Buy Before Rally!"🚨 "The Zinc Heist" – XZN/USD Master Looting Plan (Thief Trading Style) 🚨
💰 Steal Like a Pro – Bullish Breakout Strategy for Maximum Profit! 💰
🔥 THIEF TRADING ALERT: XZN/USD METAL MARKET ROBBERY IN PROGRESS! 🔥
🚨 Attention, Money Makers & Market Robbers! 🚨
Based on the 🔥Thief Trading Method🔥, we’ve cracked the code for XZN/USD ("The Zinc") – and the vault is WIDE OPEN! 🏦💎 This is your chance to join the heist and escape with massive profits!
📜 THE MASTER HEIST PLAN (Day/Swing Trade) 📜
🎯 Mission: LONG ENTRY – Swipe the bullish loot before the market reverses!
⚠️ Danger Zone: Overbought market, consolidation, and Electric Trap where bears lurk! Escape before they strike!
🔑 ENTRY STRATEGY (How to Loot Like a Pro):
"The vault is open!" – Enter at any price, but smart thieves use limit orders!
Best Heist Tactics:
Buy Limit Orders within 15-30 min near swing lows/highs (pullback entries).
DCA / Layering Strategy – Multiple limit orders for maximum loot!
🛑 STOP-LOSS (Escape Plan If the Heist Goes Wrong):
Thief SL: Nearest swing low (candle body/wick) on 3H TF (2700).
Risk Management: Adjust SL based on your trade size, risk tolerance, and number of orders.
🎯 TARGETS (Where to Cash Out & Flee!):
First Escape: 2870 (or exit early if the market turns risky!).
Scalpers’ Quick Loot: Only trade LONG! Use trailing SL to protect profits!
📡 WHY THIS HEIST WILL WORK (Bullish Triggers!):
✅ Strong Bullish Momentum – Market is primed for a breakout!
✅ Fundamental Backing – Macro trends, COT data, and sentiment favor bulls!
✅ Intermarket Confirmation – Metals sector heating up!
🔗 Want the FULL robbery blueprint?
👉 Check Fundamental Reports, COT Data, Sentiment Analysis & More!
🚨 TRADING ALERT: NEWS & POSITION SAFETY! 🚨
⚠️ WARNING: High-impact news can wreck the heist! Protect your loot:
Avoid new trades during news!
Use TRAILING SL to lock profits & dodge volatility!
💥 BOOST THIS HEIST! 💥
🚀 Hit the LIKE & BOOST button to strengthen our robbery squad!
💸 More likes = More heists = More profits for YOU!
🎉 Stay tuned – Next heist coming soon! 🎉
⚠️ DISCLAIMER (Stay Out of Jail!):
📌 Not financial advice! Your money, your risk.
📌 Markets change FAST! Always DYOR before trading.
🔥 Ready to Rob the Market? Let’s Get That Bag! 🔥
🚀 LIKE, SHARE & FOLLOW FOR MORE HEISTS! 🚀
#Trading #XZNUSD #ZincHeist #ThiefTrading #BullishBreakout #MarketRobbery #ProfitPlan

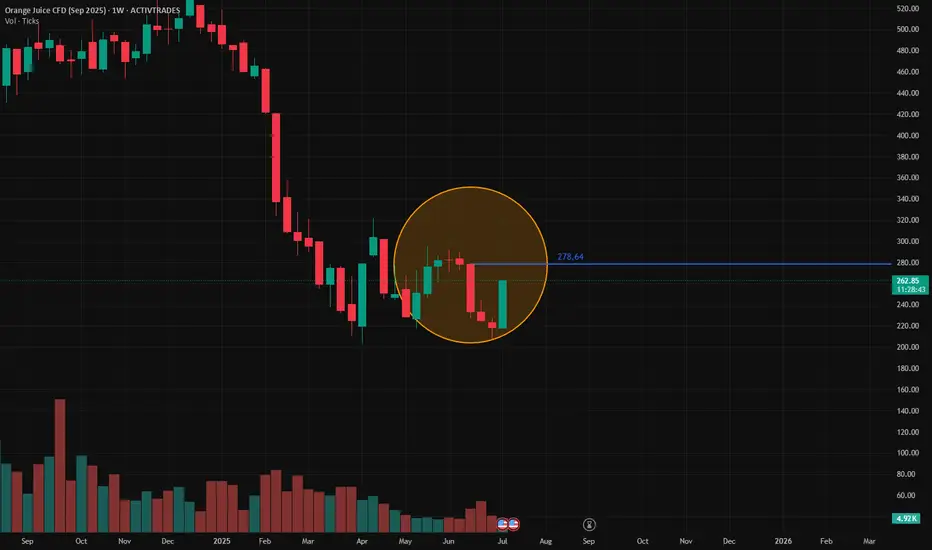
Orange JuiceThe holding of support, represented by the bullish equilibrium orbit at 206.00, encouraged the return of positive currents.
Resistance at 278.64 to be monitored, which in the event of a break would project prices towards the target placed at 351.06 to be realised by 11 August 2025.
Can Strategic Minerals Transform National Security?MP Materials has experienced a significant market revaluation, with its stock surging over 50% following a pivotal public-private partnership with the U.S. Department of Defense (DoD). This multi-billion-dollar agreement, which includes a $400 million equity investment, substantial additional funding, and a $150 million loan, aims to rapidly establish a robust, end-to-end U.S. rare earth magnet supply chain. This strategic collaboration is designed to curtail the nation's reliance on foreign sources for these critical materials, which are indispensable for advanced technology systems across both defense and commercial applications, from F-35 fighter jets to electric vehicles.
The partnership underscores a profound geopolitical imperative: countering China's near-monopoly over the global rare earth supply chain. China dominates rare earth mining, refining, and magnet production, a leverage it has demonstrably used through export restrictions amidst escalating trade tensions with the U.S. These actions highlighted acute U.S. vulnerabilities and the imperative for domestic independence, propelling the DoD's "mine to magnet" strategy aimed at achieving self-sufficiency by 2027. The DoD's substantial investment and its new position as MP Materials' largest shareholder signal a decisive shift in U.S. industrial policy, directly challenging China's influence and asserting economic sovereignty in a vital sector.
Central to the deal's financial attractiveness and long-term stability is a 10-year price floor of $110 per kilogram for key rare earths, significantly higher than historical averages. This guarantee not only ensures MP Materials' profitability, even against potential market manipulation, but also de-risks its ambitious expansion plans, including new magnet manufacturing facilities expected to produce 10,000 metric tons annually. This comprehensive financial and demand certainty transforms MP Materials from a commodity producer vulnerable to market whims into a strategic national asset, attracting further private investment and setting a powerful precedent for securing other critical mineral supply chains in the Western Hemisphere.

#AN018: Summer shock, tariffs, Fed delays, and the dollar's shif
In recent days, the forex world has experienced a sequence of key events that could redefine the global currency landscape in the coming months. Risk to the dollar has become structural, the threat of tariffs is multiplying again, and the combination of geopolitical uncertainty and monetary policy creates an extremely risky mix for exchange rates.
Let's start with the Fed minutes: Jerome Powell attributed tariff risk to the main reason for postponing possible rate cuts. Market expectations are realigning toward a longer rate cycle, fueling a climate of global uncertainty. At the same time, Goldman Sachs warns that the dollar is increasingly moving as a "risky" currency, correlated with equity markets—an emerging market rather than a safe haven.
On the geopolitical front, President Trump has relaunched the trade war: announcements of tariffs of up to 35% on Canada, up to 20% on Europe, and 50% on copper from Brazil have caused futures volatility to soar and sent the dollar into a short-term rally. But Deutsche Bank is sounding the alarm: the summer period of low liquidity and rising trade tensions represents a potential trigger for prolonged currency turbulence.
The Financial Times envisions a scenario in which the dollar loses ground as the dominant currency, ushering in a multipolar currency world in which the euro, renminbi, gold, and even cryptocurrencies could gain ground.
The impact on Forex:
USD: The narrative is changing: no longer a net safe haven, but an asset correlated with political and risk cycles. The weakness of the DXY index in the first half of 2025 (-10%) reflects this transition.
EUR/USD: Potentially favored if the dollar continues its consolidation. However, new tariffs and US-EU uncertainty could provide temporary support for the greenback.
USD/JPY and USD/CHF: These crosses will be subject to greater volatility, with the next catalyst being the Fed minutes and the timing of tariffs. Safe-haven currencies strengthen during periods of uncertainty.
CAD, AUD, NZD: penalized by tariffs on Canada and Brazil and a weak dollar. OPEC+ and geopolitical tensions could boost commodities, but data confirmation is needed.
Commodity cross-correlation: USD/CAD could rebound if oil loses momentum, while AUD/JPY is sensitive to both the RBA and increased global risk.
Conclusion:
The current currency environment appears unstable and sensitive to political and trade developments. Summer volatility could persist, and those who can read the macro and institutional signals (Fed, tariffs, geopolitics) will have the opportunity to enter accurately. Until a stable direction emerges, EUR/USD looks like the most interesting cross to capture a potential structural correction in the dollar.

TRUMP/USDT Eyeing a Breakout – Key Levels Ahead!Trump is currently trading just below the resistance zone.
If we see a daily candle close above this key area, it could trigger a move toward the red trendline, and possibly even into the major resistance zone above.
Eyes on the breakout!
DYOR, NFA

