GBPUSD Pullback Another Bullish PatternThe GBPUSD recently closed around 1.33750, testing a key support zone. Although there are signs of potential further decline, the broader outlook depends significantly on the strength of the US Dollar.
A corrective move against the backdrop of a strong overall trend is within normal expectations, and bullish sentiment remains intact.
If buyers are able to defend the 1.33750 – 1.33600 support zone, a pullback or reversal could be expected then next resistance would be 1.36004 / 1.37001.
You can find more details in the chart Ps Support with like and comments for more better analysis Thanks for Supporting.
Beyond Technical Analysis

$AUDUSD - Who will win this breakout wedge? Who else is spotting this wedge in the OANDA:AUDUSD ?
As an orderflow trader, my bet is going Short $$$

Next stop 125 can we go to 145 k?This channel is not providing individualized trading or investment advice, nor is it a banking service, brokerage service, trading service, investment service or money management service

Gold and DXY. Day before CPI 14.07.2025, MondayExplaining about the thoughts on CPI. Expect major movements on GOLD

ETHFI Key Reclaim Watch — Only Long Above $1.09 Confirmation✅ Price currently below major 1D S/R — no bullish bias yet
✅ Only looking for a long entry after confirmed reclaim of $1.09
✅ Structure remains bearish until then
Primary Scenario (Bullish):
Enter long only after confirmed reclaim/close above $1.09
Targets: Move to upper range ($2.76) on strength
Bearish/Flat Scenario:
If price fails to reclaim $1.09, no position — stay sidelined
🔔 Triggers & Confirmations:
Only long above $1.09 with confirmation (candle close, volume spike, or strong reclaim)
No trade below $1.09
🚨 Risk Warning:
Structure remains bearish below $1.09 — avoid bottom picking or forced trades

Global M2 Money Supply (70/84/90 Day offset) and $150k BTCIn this video I show how I'm using Global M2 slightlty different than most, and showing it behaves differently during different periods of the cycle.
And revisit briefly how (and why) Bitcoin may get to $150k - $200k this cycle.
See my previous video showing how we could hit $246K this cycle (early 2026) and the forecasted next bear market Low -- using a discovery I made during the last cycle.
Let me know what you think.
Please like the video and comment.
See bio for more links and analysis.

VIRTUAL — Clean MSS+BOS Flip Long | #1D | BULLISH1. Limit order on retest S/R flip (1.65–1.68)
2. Entry after confirmed hold above support
3. Main target: 2.18
4. Stop: Below 1.49

ENA — Buy Reload Below $0.30 | #1D | BULLISH1. Take profits at mid-range resistance ($0.35–0.46)
2. Set limit order for reload in $0.25–0.30 zone
3. Stop below $0.22
4. Alert on retest of $0.35

ETH — 3D OB + FVG Swing Long | #3D | BULLISH1️⃣ Buy zone: 2,500–2,600
2️⃣ TP: 3,280–3,495
Stop: < 2,500
Alert: FVG fill

Mid-Session Market InsightsMid-Session Market Insights
In today's session, I'm closely monitoring eight different futures markets: S&P 500, NASDAQ 100, Russell 2000, Gold, Crude Oil, Euro Dollar, Yen Dollar, and Aussie Dollar.
S&P 500: We're seeing a rotational pattern within the prior day's value area and the CVA. I'm eyeing long opportunities from the prior value area low up to the high.
NASDAQ 100: The market is a bit choppy around the PVA and CVA highs, with a slight upward intraday trend. I'm staying cautious here.
Russell 2000: Also choppy, but we've got acceptance within the CVA. I'm looking for long opportunities from the CVA low, which aligns with the prior day's low.
Euro Dollar: I'm currently short from the CVA high, with the first target at the prior day's low. We've broken below the prior value area, so I'll trail this trade and see how it develops.
Yen Dollar: It’s been a bit of a mixed bag. I took a short below the CVA and prior day's low, got stopped out, but it was still a decent setup.
Aussie Dollar: I took some long positions that weren't the best setups, as it was quite choppy near the CVA high and prior day's low. Lesson learned for next time.
Crude Oil: I took a short from the CVA and PVA highs, hit my target at the low of those areas, and we’re currently hovering around that level.

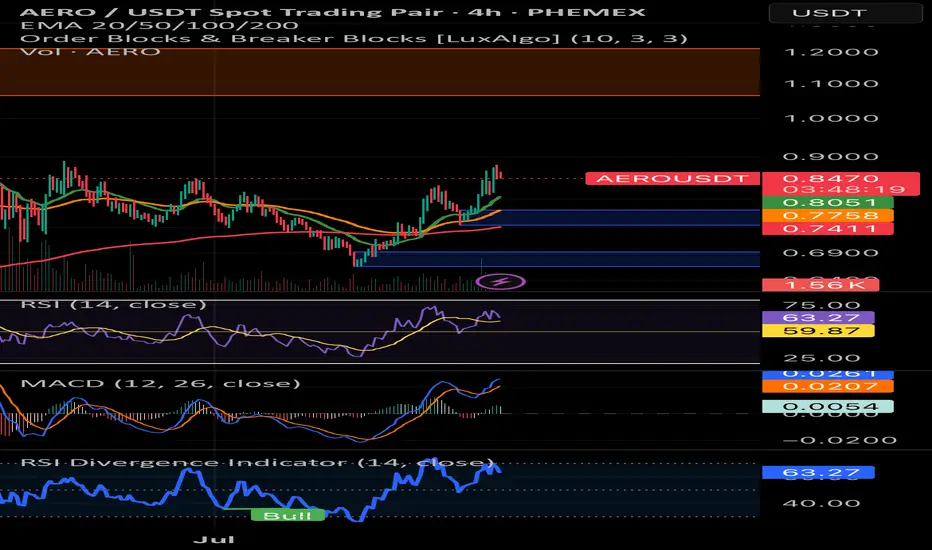
I want to short aeroI really want to short AERO but I have reason to believe it may still go up. I’m waiting on one more confirmation
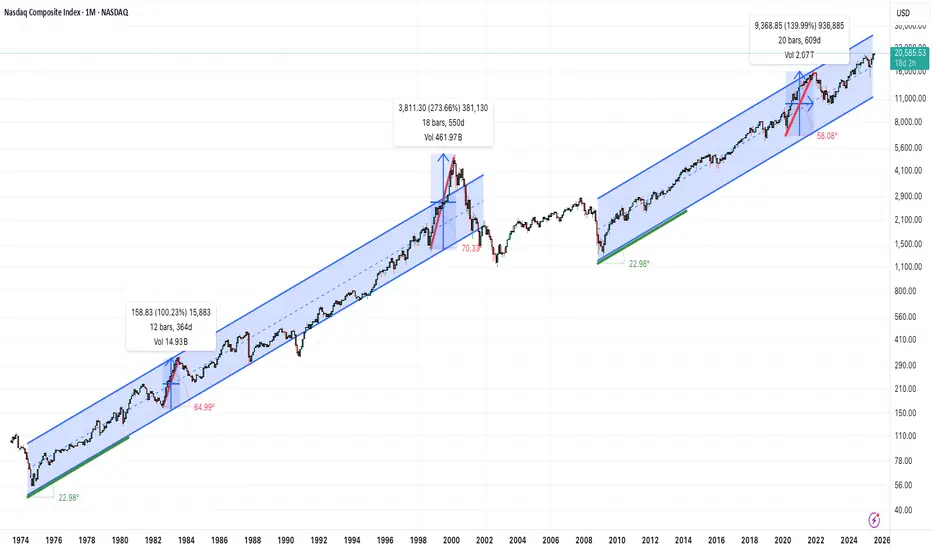
Is the Nasdaq in a bubble?On the monthly timeframe, there are no signs of an over-extended, parabolic condition for the Nasdaq Composite(IXIC).
It's interesting to note that for a 25 year period from 1974 to 1999 the overall trend was roughly a positive 23 degree angled climb. We see that again in the current 16 year trend that started in 2009.
Much steeper parabolic periods can be seen in shorter time frames like the 1998-2000 move, where the angle reached 70 degrees. That didn't end well. It's also worth noting that in 1982 and 2020 we saw similar behavior, though slightly less frothy. Both of those periods were also followed by significant retracements.
Maybe we are at the beginning of one of those multi-month, over-extended runs. But not seeing it today. If we are trading at 45,000 or more in 2026, that's a different story...
Week of 7/13/25: EURUSD AnalysisLast week's candle was a bearish engulfing meaning that most likely price will continue lower this week as a daily trend retracement. Waiting for LTF bearish price action before entering.
Major News:
Tuesday - CPI
Wednesday - PPI
Thursday - Unemployment

ETHEREUM - ETH Weekly Recap & Projection 13.07.2025Current Structure
Ethereum is showing a clear bullish bias.
Last week’s price action broke above a significant weekly swing level with solid candle closures — suggesting continuation.
Short-Term Scenarios
We could see two potential outcomes:
• A consolidation range forming at current levels
• A short-term retracement influenced by Bitcoin’s movement
Due to ETH’s high correlation with BTC, traders should review Bitcoin’s chart to understand ETH’s likely path.
Trading Plan
Wait for Bitcoin to complete a retracement
Monitor ETH for LTF (lower timeframe) confirmation and bounce
Seek long setups below the CME Gap (pink line)
Step 2 will serve as the trigger to initiate any positions on ETH.
Macro Risk-On Catalyst – Powell Resignation?
There are growing rumors regarding Federal Reserve Chairman Jerome Powell potentially resigning.
If confirmed, this could result in a strong rally across risk assets, including ETH — likely pushing prices higher without traditional pullbacks.
Summary
• ETH broke major weekly structure
• Watch BTC for clues — correlation remains high
• Plan favors long entries after BTC retrace + ETH LTF confirmation
• Powell resignation rumors could accelerate bullish trend

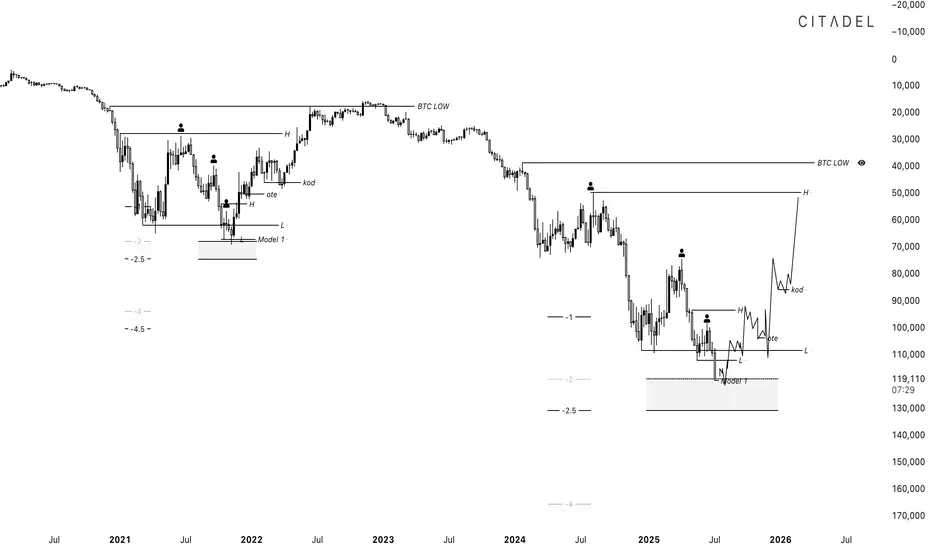
Inverted BTC tells the full storyahhh here we are again bulls with the same playbook late in the cycle. we will see 40k before 200k
Everybody and their mother is waiting for another bigger XRP DIPEveryone and their mother is waiting for an XRP dip. The biggest liquidation wave of all time happened last week. But nothing is enough for them and they assume that the market will be so kind as to offer another place to buy and win.
The train has already left and the journey is just beginning. I can't give exact dates but my graph follows the historical price development of XRP in 2017-2018 when it rose explosively. A similar graph adjusted to today's prices could roughly raise XRP 0.5$->3$->10$->100$ which could be the peak prices of this bull run in about a year.
nfa dyor ...

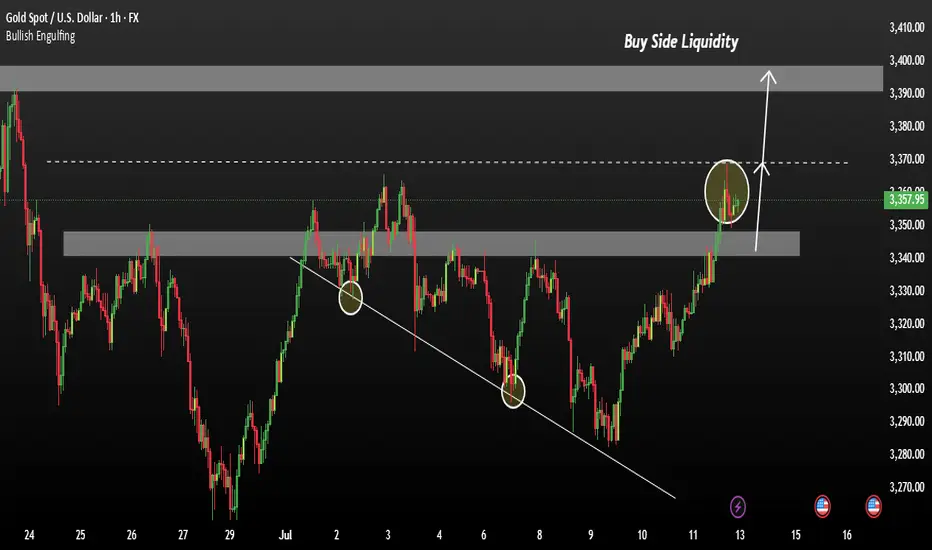
XAUUSD Bullish Trend Fallowing the chart condition Gold continues its bullish trajectory, showing potential for an extension towards the 3400 level, driven by geopolitical concerns and dovish central bank sentiment. Recent tariff related comments from former President Trump have reignited global trade tensions. Fed Chair Powell's recent remarks suggest a cautious stance on future rate hikes, reinforcing bullish sentiment in precious metals.
Technical Overview:
Last Friday, XAUUSD reached the 3368 resistance zone, a critical level where price may consolidate. Momentum remains strong, and if the price breaks above this zone with volume confirmation, the next leg could target 3380–3400 However, caution is advised: if the price falls below 3342, but then regains ground quickly, it may still continue in the bullish trend.
You may find more details in the chart Ps Support with like and comments for more analysis.
USDJPY M15 Support & Resistance Levels🚀 Here are some key zones I've identified on the 15m timeframe.
These zones are based on real-time data analysis performed by a custom software I personally developed.
The tool is designed to scan the market continuously and highlight potential areas of interest based on price action behavior and volume dynamics.
Your feedback is welcome!

#BTC/USDT It's not over yet! Eying at 130K +ALTCOIN CHEAT SHEET!The last time I shared this chart was on April 14th, when Bitcoin was trading around $84,000 — right when panic was setting in across the market.
The message back then was simple: don’t panic, it’s just a retest.
And here we are again, revisiting the same sentiment with a new chart!
There are a lot of “double top” charts circulating in the space right now, but let me be clear: it’s not over yet.
Before jumping to conclusions, go through this chart and analysis to understand the full picture.
Bitcoin closed the week at $105,705 — certainly higher than most expected just a few days ago.
This marks the first red weekly candle after seven consecutive green closes, which is normal in the context of a healthy uptrend. We're still midway toward the broader target, so there’s no reason to panic or shift into disbelief.
Yes, we may see further corrections in BTC over the coming days or week, potentially down to $98K, and in a less likely scenario, even $ 92K. But this time, Ethereum is showing signs of strength and is likely to outperform Bitcoin, creating high-quality entry opportunities across the altcoin market. In other words, this phase is not a threat, it's an opportunity. BTC is still destined to hit $130k+ as per charts and other important metrics.
Here’s a typical market structure and reaction flow to help put things in perspective:
1. Bitcoin rallies — Altcoins underperform or get suppressed due to capital rotation into BTC.
2. Bitcoin corrects — Altcoins correct further as fear increases and dominance rises.
3. Bitcoin stabilises — Ethereum begins to gain strength, often leading the altcoin recovery.
4. ETH/BTC ratio increases — Ethereum holds up better while many altcoins continue to lag.
5. Bitcoin breaks ATH — This triggers a gradual recovery in altcoins.
6. BTC dominance peaks — Altcoins start gaining serious momentum.
7. Capital rotates from BTC and ETH into altcoins — Sectors tied to the current narrative (like meme coins this cycle, and Metaverse/NFTs in the last one) begin to lead.
8. Altcoin season begins — Utility and mid-cap tokens follow, often delivering strong returns in the final phase.
This pattern has repeated across cycles. Currently, we appear to be in the transition between Bitcoin stabilising and Ethereum gaining dominance — typically the stage that precedes a strong altcoin rally.
Now is not the time to assume the move is over. Stay objective, monitor capital rotation closely, and prepare for what comes next.
If your views resonate with mine, or if this post adds any value to you, please boost with a like and share your views in the comments.
Thank you
#PEACE

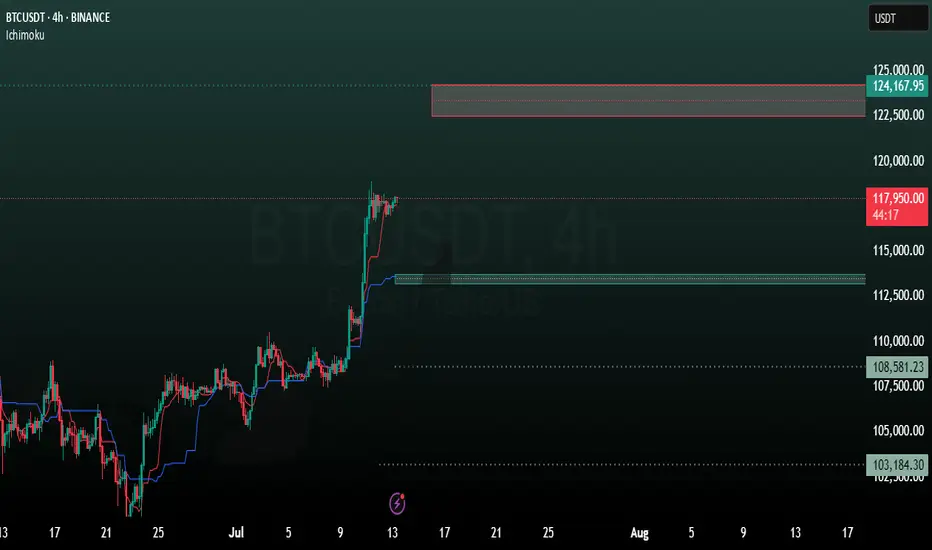
BTC 4H analysisBased on our previous analysis, BTC trend is still bullish. It reacts to our mentioned support level (98699) and moving to new resistance levels.
ICHIMOKU shows these levels as resistance:
122500
124000
137000
And these as support:
113788
113181
108581

Gold LongsFollowing last weeks bias. Looking for REQH target.
Want to pair longs with a weekly profile. Ideally Monday or Tuesday creates the low of week. Will look to get onside with longs once theres a clear intraweek reversal. Trade the continuation higher. A close below 3320 is invalidation. Expecting previous week low to be protected and expansion to the upside

NIFTY 24740: Smart Money Signals Bearish Move IncomingThe directional bias is clear – bearish – and I'm currently waiting for a precise setup to present itself. Based on the Smart Money Concept, we could be looking at a potential short opportunity around the 24740 zone.
📍 Once the setup is confirmed, I’ll be sharing the exact entry and stop-loss levels with you.
Stay tuned – patience here is key. Let the market come to us.
