BTCUSDT – The Liquidity Mirage: This Pump Is a Setup!Chart Type: BTCUSDT | 1D & 8H Analysis
Status: Live Reversal Setup | FOMO Trap Triggered
⸻
🧠 Overview:
What looks like a breakout is actually a trap. This pump has violated key sniper rules:
• No reactive volume confirmation
• No structure retest
• Triggered FOMO entries at the highs
• TP booked by whales while retail enters late
Instead of continuation, BTC is setting up for a controlled distribution dump.
⸻
🔍 Sniper Observations:
Component Kaizen Verdict
Volume >> ❌ Weak → No relative confirmation
RSI >> ⚠️ Flat → Bearish Divergence Expected
Structure. >> ❌ No retest or reclaim → Just exhaustion
FOMO Activity >> ✅ High → Clear Retail Entry Trap
Liquidity Above >> ✅ Filled → Nothing left to chase
Whale Behavior >> ✅ TP Booked → Exit has begun
⸻
💣 Liquidity Cloud Mapping:
112,000–114,000 = Retail Exhaustion Zone
✅ TP Booked
✅ FOMO Entry Triggered
✅ Liquidity Grab Completed
108,000 = First Profit Zone (TP1)
Institutional cluster > Buy-back likely
105,000 = Final Target Zone (TP2)
Reversal + SL stack of FOMO longs
93,000–95,000 = Full Trap Unwind
Bonus TP for deep reversal setups
⸻
🎯 Short Plan
(Live Deployment Ready)
Component Value
Entry Zone | 🔫 112,450 – 113,000
Stop Loss | 🛡️ 114,050 (Above fake breakout wick)
Take Profit 1 | 🎯 108,092
Take Profit 2 | 🎯 105,175 (Retail Flush & Whale Reload)
Bonus TP | 🎯 93,218 (Full exhaustion if volume spike appears)
Leverage | ⚔️ 3x–5x recommended for precision swing short
Position Type | 🧠 Swing short / Trap Reversal
⸻
🔑 Trigger Confirmation Before Entry:
1. ✅ 4H Candle Rejection from 112,450+ zone
2. ✅ Divergence in Volume (Price ↑ but volume ↓)
3. ✅ Momentum Fade on RSI or OBV
4. ✅ Spoof walls appear above 112,700 (signs of artificial sell pressure)
⸻
🧠 Why This Trade Works:
• Retail just entered at highs after seeing “confirmed breakout”
• Whales already exited at 112K+
• Market requires fuel for reversal = Retail SLs + Exit Liquidity
• Volume does NOT support real continuation
• Price will trap both bulls & late shorts before true reversal triggers
⸻
🚨 Risk Warning:
If BTC closes above 114,000 with sustained volume AND retests that level, the setup invalidates.
Don’t hold a sniper entry into strength. This is a precision trap entry, not a momentum chase.
⸻
📢 Final Note:
“The most profitable trades come when the crowd is silent, and the volume is fake. This is one of those setups — you’re not late. You’re right on time.”
Beyond Technical Analysis

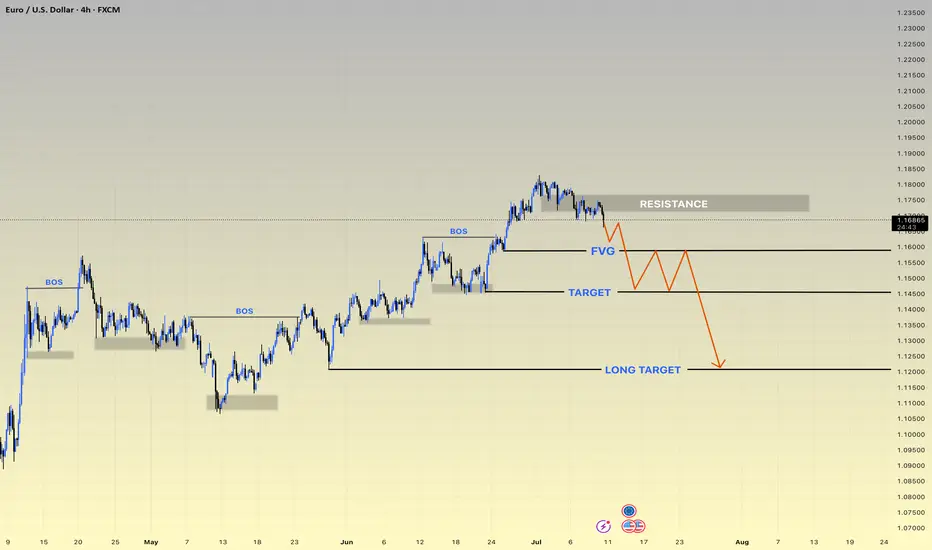
EURUSD h4 update ⚠️ Current Outlook: Reversal Zone Hit
• Price tapped into the strong RESISTANCE zone (~1.1800), failing to break higher.
• Market structure BOS (Break of Structure) confirms bearish intent.
• FVG (Fair Value Gap) likely to act as a short-term liquidity trap.
📍 Disrupted Bearish Flow:
1. Price rejects resistance aggressively ✅
2. Pullback into FVG may trigger a liquidity hunt 🧲
3. Fake bounce → Smart Money re-entry expected 👀
4. Target levels:
• 🥅 TARGET: 1.1550 zone (first major support)
• 🎯 LONG TARGET: 1.1200 zone (high probability zone for HTF buyers)
🔁 Bear Trap Setup Possibility:
• After hitting the LONG TARGET, price could reverse sharply.
• Watch for accumulation signs and deviation below key levels.
⸻
🔥 Key Zones to Watch:
• 🔳 Resistance: 1.1790–1.1820
• 🟦 FVG Retest Zone: 1.1630–1.1660
• 📉 Target Zone: 1.1500–1.1550
• 🚨 Long-Term Demand Zone: 1.1180–1.123
Wyckoff Pattern- To understand trading at its core, you need to understand the Wyckoff Theory.
- Everything you need is in the chart and yes, it's simple and might look like copy-paste, but it's pure Wyckoff.
- Remember this post i made in 2021 ? check it again :
Remember, trading is like a washing machine, it shakes you up, spins you around, and pressures you to sell when you should be buying or Holding.
Not a price prediction, just a smarter way to level up your strategy.
Happy Tr4Ding !

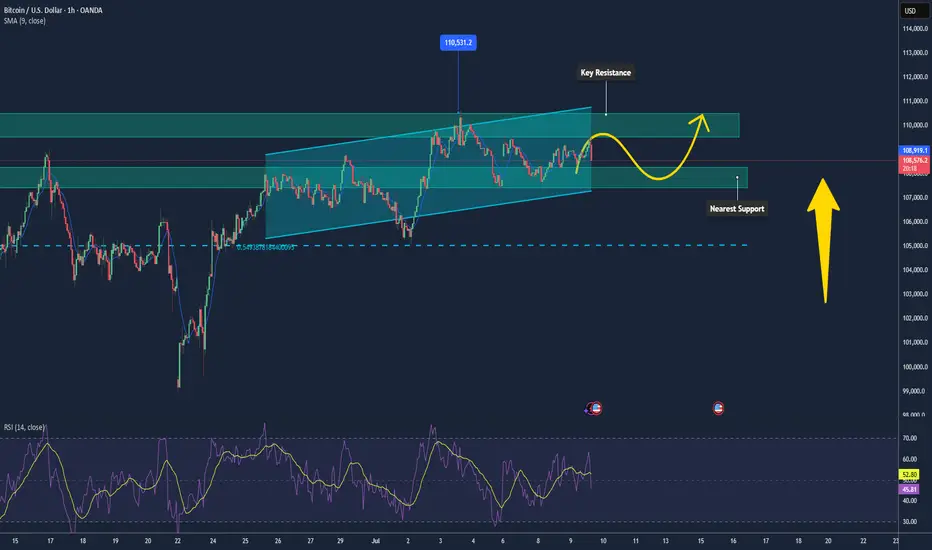
Bitcoin Maintaining Mild Uptrend, Poised Toward $110k📊 Market Overview:
• Strong ETF inflows continue, with over $13.5 billion in YTD flows into BTC, now making up nearly 70% of gold ETF inflows.
• Institutional investors like BlackRock (IBIT currently holds ~700k BTC) are still accumulating. The U.S. is also building a “Strategic Bitcoin Reserve,” reinforcing long-term confidence.
📉 Technical Analysis:
• Key Resistance: $109,000–$110,000, opening the path toward $110,500–$110,600 (Supertrend around $110,174).
• Nearest Support: $108,300 (EMA), followed by $107,800–$108,000; deeper pullback support at $105,000.
• EMA 09: Price is above this EMA → short-term trend remains bullish.
• Candlestick/Volume/Momentum: RSI is neutral around 58; MACD is converging near the zero line, signaling weakening bearish momentum and possible base formation.
📌 Outlook:
Bitcoin may continue its mild upward movement if it holds above $108,300–$108,000 and breaks clearly above $109k–110k with strong volume. Failure to do so could trigger a pullback toward $107,000–$108,000.
💡 Suggested Trading Strategy:
📉 SELL BTC/USD at: 109,500–110,000
🎯 TP: 108,000
❌ SL: 110,400
📈 BUY BTC/USD at: 108,200–108,500
🎯 TP: 109,500–110,000
❌ SL: 107,800
"DXY Bullish Setup – High Probability Trade!"🚨 "DXY DOLLAR BANK HEIST" – THIEF TRADING STYLE MASTER PLAN (HIGH-IMPACT TRADE ALERT!)
🔥 "Steal the Market Like a Pro – This DXY Heist Could Print Serious Cash!" 🔥
🌍 Greetings, Market Pirates & Profit Raiders! 🌍
🤑 "Money isn’t made… it’s TAKEN!" 💰💸
Based on the 🔥 Thief Trading Style 🔥 (a lethal mix of technical + fundamental + psychological warfare), we're executing a DXY Dollar Index Bank Heist—a high-stakes robbery where YOU get to keep the loot!
📜 THE HEIST BLUEPRINT (TRADE PLAN)
🎯 ENTRY ZONE – "BREAK THE VAULT DOOR!"
📍Key Trigger: Wait for price to SMASH through the Moving Average Wall (97.700) – then STRIKE!
🔪 Thief’s Entry Trick:
Buy Stop Orders above MA (aggressive)
Buy Limit Orders near recent swing low (smart pullback play)
DCA/Layering Strategy for max profit extraction (real robbers scale in!)
🚨 ALERT SETUP: "Don’t miss the breakout – set an ALARM!" ⏰
🛑 STOP LOSS – "DON’T GET CAUGHT!"
"Yo, rookie! If you’re entering on a breakout, WAIT for confirmation before placing SL!"
📍Thief’s SL Zone: 97.400 (30min swing low – adjust based on your risk appetite!)
⚠️ WARNING: "Place it wrong, and the cops (market) will lock YOU up!" 🚔
🎯 TARGET – "ESCAPE WITH THE LOOT!"
🏆 Primary Target: 98.350 (Take profits before the resistance police show up!)
🔄 Scalper’s Bonus: "Trail your SL, squeeze every pip!"
💡 Pro Tip: "If you’re underfunded, ride with the swing traders – teamwork makes the dream work!"
💣 WHY THIS HEIST WILL WORK (MARKET DYNAMICS)
✅ Bullish Momentum Building (DXY showing strength!)
✅ Overbought? Maybe… but thieves don’t wait for permission!
✅ Trend Reversal Potential (Big money shifting!)
✅ Police (Resistance) Trap Ahead (Escape before they catch you!)
📡 NEWS & RISK MANAGEMENT (DON’T GET BUSTED!)
🚨 High-Impact News? AVOID new trades! (Use trailing stops to lock profits!)
📊 Check COT Reports, Macro Data, Geopolitics (Smart thieves do their homework!)
💥 BOOST THIS HEIST – LET’S GET RICH TOGETHER!
👊 "Hit the LIKE & BOOST button to fuel our next heist!"
💖 "More boosts = More robberies = More FREE money for YOU!" 🚀
⚠️ DISCLAIMER (LEGAL SPEAK)
"This ain’t financial advice – just a damn good robbery plan. Trade at your own risk, and don’t cry if you ignore the SL!" 😎
🔔 Stay tuned for the next heist… The market’s our playground! 🏴☠️💰
🚀 "See you at the next breakout, thief!" 🚀
🔥 #DXY #Forex #Trading #BankHeist #ThiefTrading #ProfitPirates #MakeMoney #TradingView #SmartMoney 🔥

$ETHUSDT: Uptrend signal in the daily timeframeEthereum is ready to move higher, as I anticipated when the BINANCE:ETHBTC signal flashed...
Best of luck lads!
Cheers,
Ivan Labrie.

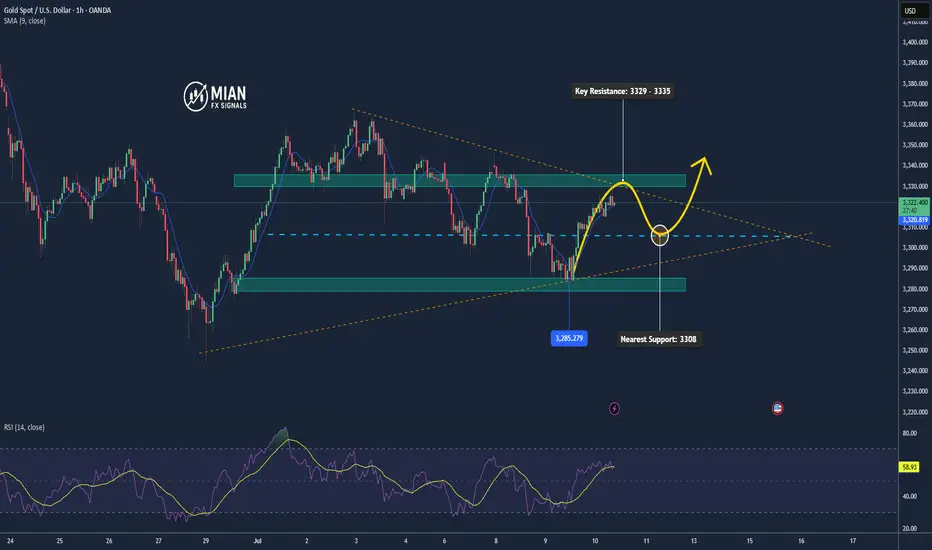
Gold Rejected at 3329.5, Profit-Taking Pressure Rises📊 Market Overview:
Gold surged to 3329.5, approaching key resistance, but quickly dropped to 3319.8 due to strong selling pressure, signaling short-term profit-taking. It’s now slightly recovering and trading around 3321.
📉 Technical Analysis:
• Key Resistance: 3329 – 3335
• Nearest Support: 3308 – 3285
• EMA 09: Price remains above EMA 09 → uptrend still intact.
• Candlestick / Volume / Momentum: H1 candle shows long upper wick at resistance. High volume at the top suggests profit-taking activity.
📌 Outlook:
Gold may continue a short-term correction if it fails to break above 3330 decisively. Bulls need to hold 3308 to maintain the upward structure.
💡 Suggested Trading Strategy:
🔻 SELL XAU/USD : 3330 – 3333
🎯 TP: 40/80/200 pips
❌ SL: 3336
🔺 BUY XAU/USD at: 3302 – 3305
🎯 TP: 40/80/200 pips
❌ SL: 3399
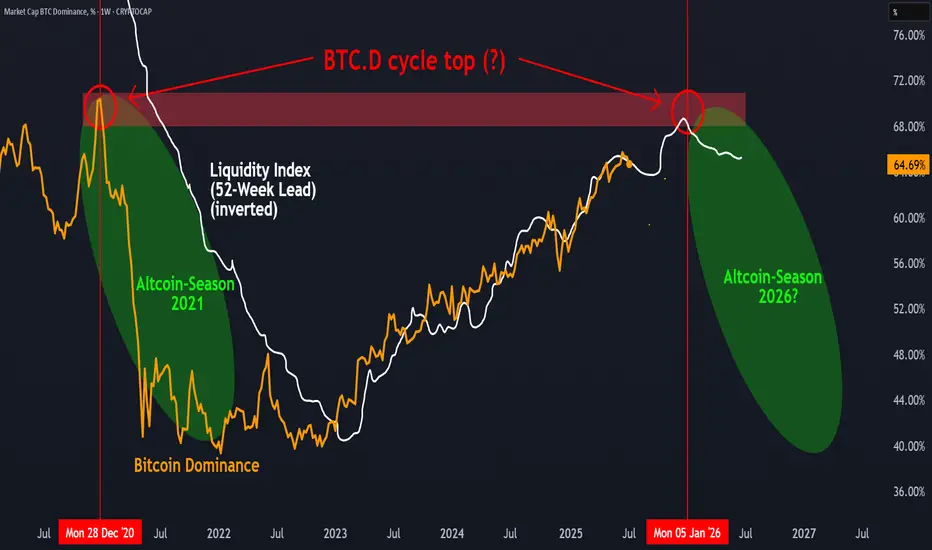
BTC.D Cycle top in?There are signs that Bitcoin Dominance (BTC.D) could be leaving a cyclical top, similar to what we saw in late 2020. When overlaid with the Global Liquidity Index (inverted and leading by 52 weeks), a potential correlation appears: previous peaks in liquidity were followed by turning points in BTC.D about a year later.
If this pattern repeats, a shift in market dynamics — possibly in favor of altcoins — could unfold over the coming year. However, this remains a hypothesis rather than a confirmed signal. The relationship between macro liquidity and crypto sector rotation is worth watching, but it’s not guaranteed to play out the same way again.
What’s your take: Altcoin Season loading or not yet?
$XAGUSD: Silver lagging Copper, not for long...OANDA:XAGUSD lagging OANDA:XCUUSD in this move...
Daily up trend signal flashed today in Silver, seems like a good trade to play catch up vs Copper next.
Best of luck!
Cheers,
Ivan Labrie.

XAU/USD (Gold) Bearish Outlook – H1/H4 Chart AnalysisGold is currently showing signs of weakness within a confirmed downtrend, forming lower highs and lower lows on the short-term charts. The price structure suggests continued bearish momentum as sellers maintain control beneath key resistance levels.
At present, a potential bearish opportunity is observed if price retraces near the 3320 zone, which aligns with a recent supply area and resistance in the ongoing downtrend. From this level, price action could continue its downward move in line with trend dynamics.
Entry Zone: Around 3320
Primary Target: 3300 (near-term support level)
Final Target: 3280 (extended target aligning with previous demand zone)
Invalidation/Stop Loss: Above 3340 (a break above this may invalidate the bearish bias)
🔸Disclaimer; This setup is based on technical structure and market flow, not financial advice. Always confirm with your own analysis and risk management plan.

GJ bearslooking for a break of this new support and closure below before entering. daily candle is bearish, and the 4 hr resistance above has been respected.
you can monitor entries on the 30min, again just looking for a candle to close bearish below the zone before entering.

Lumber: Buy the dip...Good reward to risk to go long here with a stop at yesterday's open.
Exit at the targets on chart or in 4 days.
Best of luck!
Cheers,
Ivan Labrie.

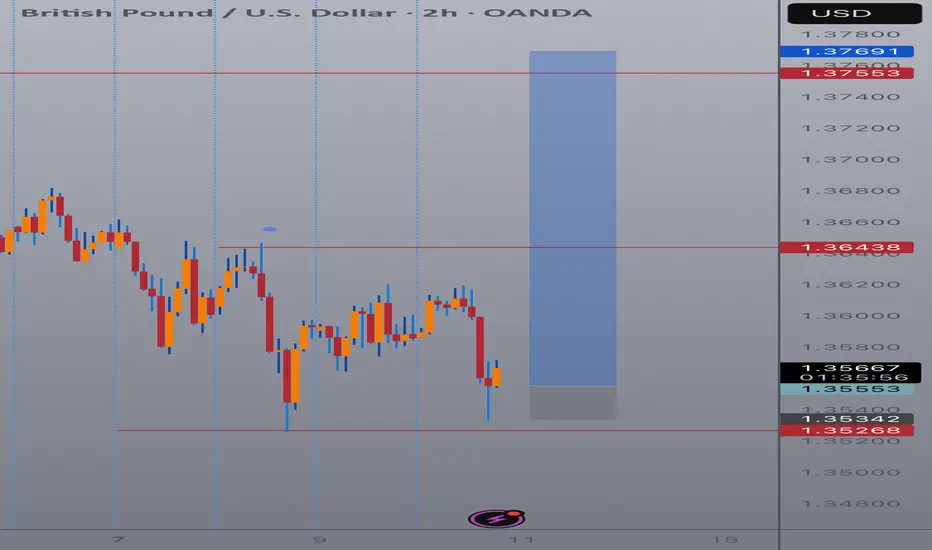
GBPUSD Bearish Signal | Technical + Custom AlgoSmart Trend Signal | Technical Analysis + Custom Algorithm
This signal is the result of a combination of classic technical trend analysis and a proprietary software I personally developed.

Report - 10 jully, 2025Nvidia Becomes First $4 Trillion Company: AI Euphoria Drives Tech Boom
Key Highlights
Nvidia surged 40% since May, reaching a $4 trillion market cap, surpassing Apple and cementing its leadership in the AI chip space.
Drivers:
Thawing US-China trade tensions in early May boosted market sentiment.
Major sovereign AI infrastructure deals in Europe and Middle East.
Continuous demand from Big Tech (OpenAI, Microsoft, Google).
Nvidia’s projected 2025 revenue: ~$200bn (+55% YoY), net income ~$105bn, gross margin >70%.
Strategic Analysis
Nvidia’s success highlights the dominant role of AI infrastructure as a "new digital oil". It also underscores the increasing gap between top-tier AI firms and the rest of the semiconductor sector.
The "AI flywheel effect" is evident: Nvidia’s chips enable AI growth → Big Tech scales → Nvidia sells even more, creating a compounding loop.
Risks & Watchpoints
Export restrictions to China remain a ceiling on growth.
Rising competition from domestic Chinese players like DeepSeek.
Potential regulatory pushbacks or tech sovereignty initiatives in key markets.
Market Implications
Supports strong flows into US Tech ETFs and growth factor strategies.
Reinforces demand for high-performance computing infrastructure investments.
Spillover benefit to data center REITs, cloud infrastructure providers, and advanced memory suppliers.
European Airlines Face Worst Delays Ever
Key Highlights
Severe staff shortages, record post-COVID demand, and extreme weather events (wildfires) expected to create "worst ever" delays.
Critical air traffic control capacity constraints in major hubs: France, Germany, Greece, Spain.
Strikes further disrupt operations, impacting airlines financially (e.g., Air France-KLM).
Strategic Analysis
Operational risk for European carriers is increasing sharply.
Near-term margin pressure due to reroutings, cancellations, and compensations.
Possible reputational harm and longer-term adjustments to travel insurance premiums.
Market Implications
Negative near-term for airline stocks, potential hedge opportunity via short positions.
Supports defensive consumer stocks and travel insurers.
Potential boost to domestic tourism and alternative transport sectors (rail).
EU Removes UAE and Gibraltar From AML Grey List
Key Highlights
EU parliament voted to delist UAE and Gibraltar, facilitating smoother transactions and trade negotiations.
Move strategically driven by EU trade talks with Abu Dhabi.
Strategic Analysis
Improves transaction flows and reduces compliance costs for EU-based banks and corporates engaging with UAE.
Enhances UAE’s reputation as a credible financial hub, possibly attracting more institutional capital flows.
Market Implications
Positive for European banks with Middle East exposure.
Supports UAE sovereign and quasi-sovereign bond demand.
Brain Aging Identified as Top Predictor of Longevity
Key Highlights
Stanford research: brain aging is the single most important determinant of lifespan, more than other organ systems.
Opens new frontiers for diagnostics and personalized medicine.
Strategic Analysis
Potential shift in longevity biotech investments toward neuro-focused therapies and diagnostics.
Emerging new segment in consumer health testing (bio-age clocks).
Market Implications
Positive for neurodegenerative research-focused biotech (e.g., companies working on Alzheimer’s, brain rejuvenation).
Creates thematic investment opportunities in longevity ETFs and specialized VC.
US Space Safety System Faces Funding Cuts
Key Highlights
Proposed 85% funding cut to Office of Space Commerce’s collision-avoidance system (Tracss).
Industry concerns: increased collision risk, higher operational costs, and potential insurance implications.
Strategic Analysis
Rising risks in orbital operations may accelerate private solutions and partnerships.
Could indirectly benefit specialized private space tracking firms and insurance providers.
Market Implications
Near-term negative sentiment for US-based satellite operators.
Supports consolidation or premium valuation of private orbital tracking players.
FSB Proposes Leveraged Limits for Hedge Funds
Key Highlights
New proposals to limit non-bank leverage and improve transparency.
Aims to mitigate systemic risk amplified by strategies like Treasury basis trades.
Strategic Analysis
Could compress returns in highly leveraged strategies, particularly macro and relative-value hedge funds.
May shift flows toward lower-leverage, higher-transparency structures.
Market Implications
Increased scrutiny likely benefits regulated fixed-income and public credit markets.
Hedge fund sector might see short-term outflows or strategy shifts.
Trump’s “Big Beautiful Bill”: Winners & Losers
Winners
Private equity & fossil fuels (carried interest loophole preserved, tax breaks).
Coal & nuclear (additional incentives).
Defense contractors (additional $150bn budget).
Certain retail segments (tariff exemptions phased out benefiting domestic).
Losers
Renewables (wind, solar incentives cut).
AI firms (lack of national regulation moratorium).
EV sector (credits scrapped).
Top universities (endowment taxes).
Strategic Analysis
Supports US traditional energy transition back toward fossil fuels.
Encourages private equity capital inflows.
Defensive healthcare positioning validated, but long-term funding risks persist.
Market Implications
Rotation into energy and defense stocks.
Potential pullback in renewable energy and select tech.
Beneficial for defense ETFs, private equity-exposed indices.
Chinese Bank Stocks Surge in Hong Kong
Key Highlights
Driven by strong dividend yields (4.6%–5.7%) vs 1.65% in local debt.
Backed by Chinese insurance giants like Ping An.
Strategic Analysis
Shows investor pivot to "quasi-fixed income" attributes of big banks.
Reflects stabilizing credit conditions and support from state capital injections.
Market Implications
Supports bank-heavy indices like Hang Seng Financials.
Reinforces China yield-hunting narrative.
Copper Market Shaken by US Tariff Threat
Key Highlights
US threatens 50% tariff on global copper imports.
Potential reduction in global copper demand, investment hesitation.
Strategic Analysis
Long-term supply chain risk for US green energy and electrification.
May lead to regional trade distortions, price volatility.
Market Implications
Bearish pressure on global copper prices despite short-term US price premiums.
Chilean and Zambian miners may face margin squeezes.
Temasek Turns Bearish on Europe
Key Highlights
Shifts focus due to US tariff uncertainty and weaker European domestic outlook.
Increased Middle East and US exposure.
Strategic Analysis
Illustrates global capital reallocation away from EU toward more "policy-stable" regions.
Encourages European corporates to further diversify geographic revenue streams.
Market Implications
Could slow inflows into European equities and private markets.
Supports Middle East infrastructure and US tech/consumer exposure.
Markets Recap
Global equities at record highs; Nvidia leads tech euphoria.
US Dollar slightly higher; Euro weaker.
Government bonds strong, yields decline on flight-to-quality and rate cut hopes.
Copper volatile; oil and gold remain firm.

Sell idea!Hello all. market react to the br node and make a low, then after hitting to an LOZ was going higher. now after breaking the IHS market will collapse. R:R 11 is enough. be happy(wink)


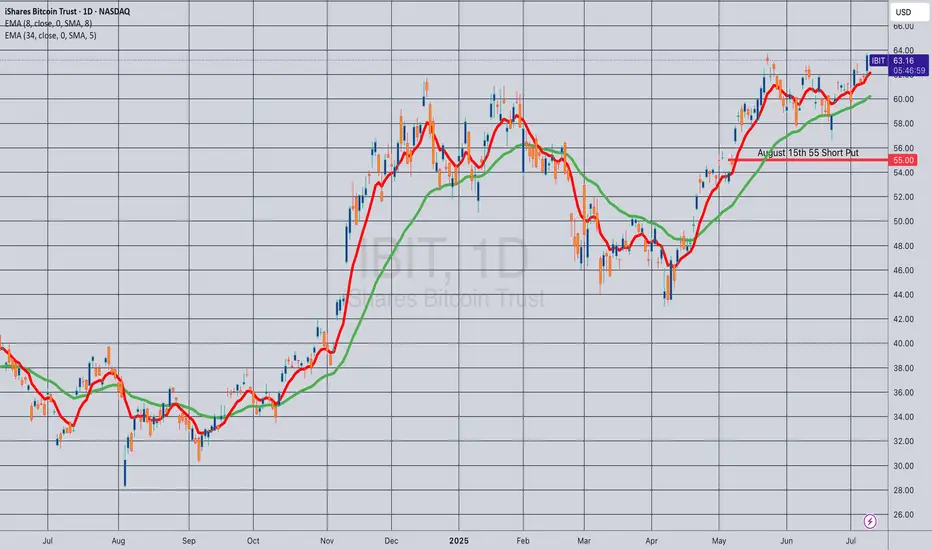
Opening (IRA): IBIT August 15th 55 Short Put... for a .62 credit.
Comments: One of the higher IV ETF's on my board. Targeting the strike paying around 1% of the strike price in credit.
Opening (IRA): IBIT July 18th 51 Short Put... for a .59 credit.
Comments: One of the higher IV ETF's on my board at the moment. A starter position, targeting the strike paying around 1% of the strike price in credit.
Will look to ladder out at intervals ... .

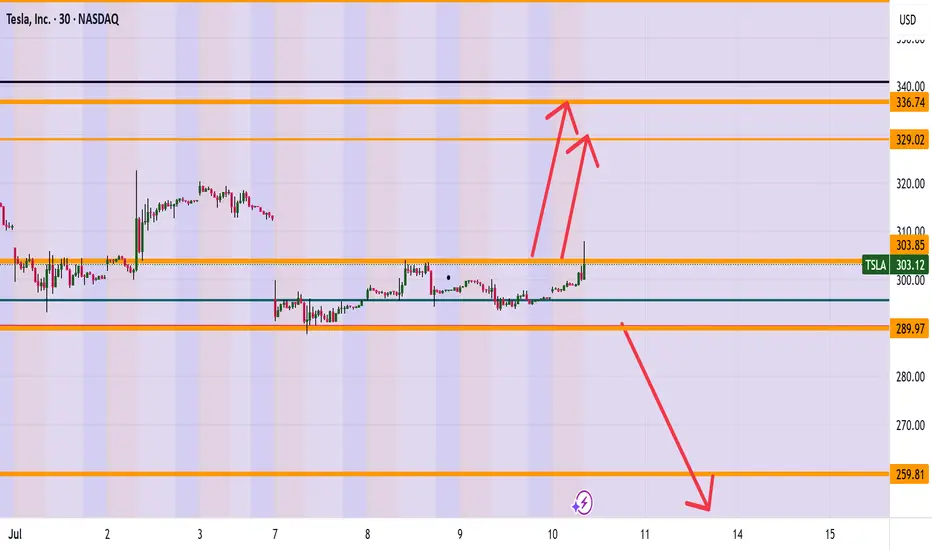
TESLA (TSLA) ARE WE HEADING TO 336? Morning Folks
It appears we are trying to break the highs of 304 and if we are successful a nice range up to 327-336 makes sense. However be careful if sink back down under 289 which then can see levels of 259 getting hit.
What are your thoughts on Tesla? Put in the comments section below
Kris Mindbloome Exchange
Trade Smarter Live Better
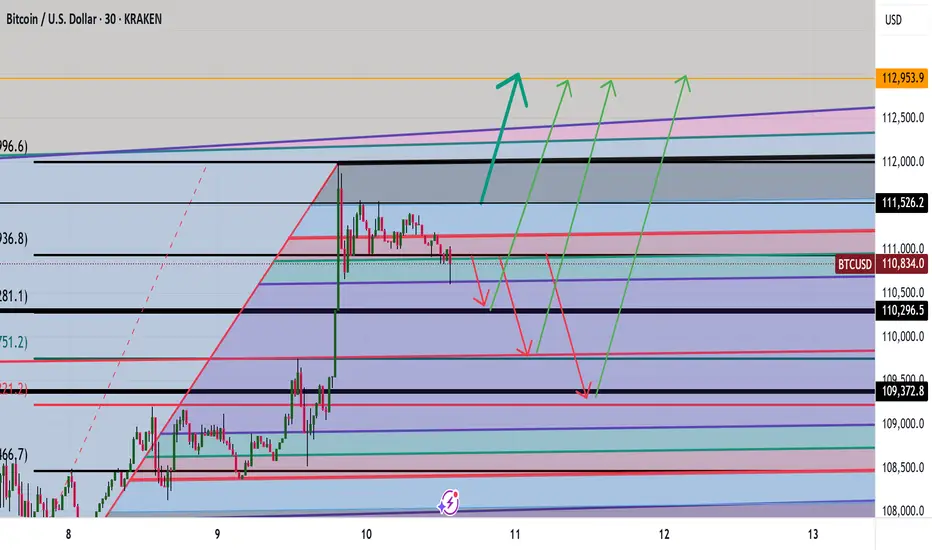
BTC Analysis TO 112,981 LEVELS AND BEYOND ? Good morning folks
BTC analysis with a little correction down to 110,300- 109,300 levels then a drive up to 112-113K levels
Let me know what you think
Kris/Mindbloome Exchange
Trade Smarter Live Better
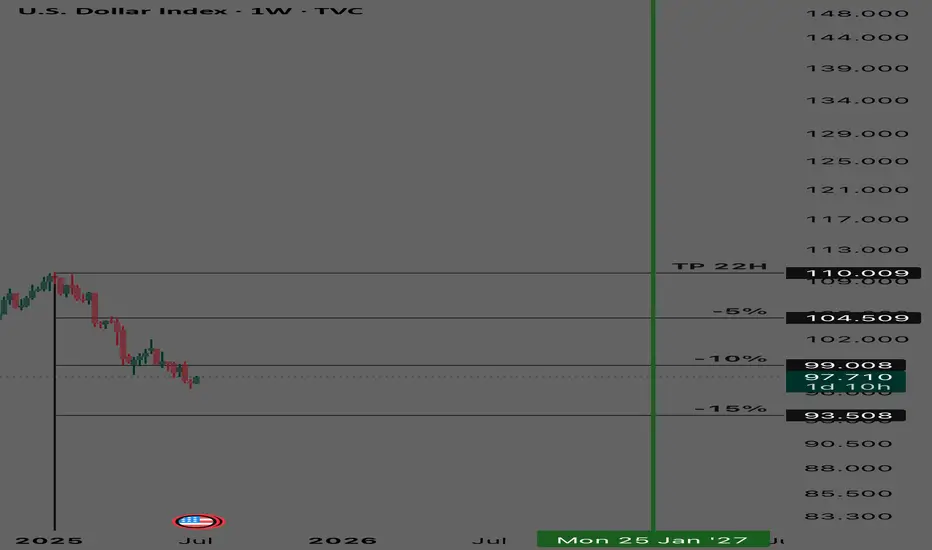
DXY - Long Term Buy Cycle DXY
Long term buy cycle
Started January 2025
TP 110
% Bubble Ratio
Currently in a negative bubble with a fair value at 110
SOL TO 167?Good morning folks
so it looks like we are correcting down possibly down to 153 then seeing a drive up to 167. What are your thoughts on the market for Solana
Looks like things are heating up for Solana
Kris/Mindbloome Exchange
Trade Smarter Live Better
